Introduction
The purpose of this article is to present further longitudinal data for short-term and long-term stability, following up our previous article in the surgery literature with a larger sample and 2 years of stability data.
Methods
Data from 38 patients enrolled in this prospective study were collected before treatment, at maximum expansion, at removal of the expander 6 months later, before any second surgical phase, at the end of orthodontic treatment, and at the 2-year follow-up, by using posteroanterior cephalograms and dental casts.
Results
With surgically assisted rapid palatal expansion (SARPE), the mean maximum expansion at the first molar was 7.60 ± 1.57 mm, and the mean relapse was 1.83 ± 1.83 mm (24%). Modest relapse after completion of treatment was not statistically significant for all teeth except for the maxillary first molar (0.99 ± 1.1 mm). A significant relationship ( P <0.0001) was observed between the amount of relapse after SARPE and the posttreatment observation. At maximum, a skeletal expansion of 3.58 ± 1.63 mm was obtained, and this was stable.
Conclusions
Skeletal changes with SARPE were modest but stable. Relapse in dental expansion was almost totally attributed to lingual movement of the posterior teeth; 64% of the patients had more than 2 mm of dental changes. Phase 2 surgery did not affect dental relapse.
Although a number of articles on the stability of surgically assisted rapid palatal expansion (SARPE) have been published, the reported stability varies considerably. It is apparent that most conclusions about the stability of SARPE depend on what was measured and when the measurements were made during the sequence of treatment. The goal of this article was to present further longitudinal data for short-term and long-term stability, following up our previous article in the surgery literature with a larger sample and 2 years of stability data.
Material and methods
Thirty-eight patients, 19 females and 19 males between 15 and 54 years of age, agreed to participate in a prospective, observational study of SARPE outcomes approved by the Ethics Committee of Laval University in Québec, Canada. All had dental casts and posteroanterior (PA) cephalograms immediately before SARPE (T1), at the completion of expansion (T2), and at the removal of the expander approximately 6 months later (T3). As of the end of January 2010, 32 had the same records before any second surgical phase (T4), 37 had records at the completion of orthodontic treatment (T5), and 23 had records 2 years after the end of orthodontic treatment (T6). Treatment characteristics are described in Table I .
| Observation time point | n | Mean time (mo) | SD | Minimum | Maximum |
|---|---|---|---|---|---|
| T1-T2 (distraction completed) | 38 | 0.68 | 0.23 | 0.46 | 1.81 |
| T2-T3 (expander retention) | 38 | 5.95 | 0.68 | 4.21 | 7.13 |
| T1-T4 (start to second surgery) | 32 | 15.27 | 3.99 | 9.40 | 24.28 |
| T2-T5 (end of expansion to deband) | 37 | 21.59 | 5.28 | 12.88 | 41.69 |
| T3-T5 (expander out to deband) | 37 | 15.64 | 5.09 | 7.79 | 35.19 |
| D1-T5 (total treatment time) | 37 | 23.57 | 5.27 | 15.41 | 43.07 |
| T5-T6 (postorthodontic treatment) | 23 | 25.35 | 4.49 | 20.96 | 39.49 |
A tooth-borne expansion device (Superscrew Superspring, Highwood, Ill), either banded (n = 21) or bonded with occlusal coverage (n = 17) was used ( Fig 1 ).

The surgical technique (described in detail previously) included separation of the pterygoid junction and the midpalatal suture between the incisors’ roots. All surgery was performed by the same surgeon.
After the surgery, a latency period of 7 days was observed, and then the patients were instructed to activate the screw by 0.25 mm twice a day. The patients were monitored twice a week until the planned expansion was achieved 14 to 21 days later. Active orthodontic treatment for the maxillary dentition began 2 months after expansion had stopped. The expansion device was kept in place for approximately 6 months. In the mandibular arch, orthodontic alignment of the teeth began 1 week to 2 months before SARPE.
After the removal of the expander, no other retention except the main archwire was used until the end of orthodontic treatment. When the braces were removed, a bonded lingual wire was placed from canine to canine in both arches. No removable retainers were used.
Of the 38 patients who completed the distraction phase, 32 had a second surgical phase planned (usually superior repositioning of the maxilla or mandibular advancement), but 4 of them did not need it after reassessment. One patient was overexpanded and needed constriction of the maxilla at the second surgical phase to achieve arch coordination. His data were removed at T5. Twenty-three patients so far have returned for records 2 years after the end of orthodontic treatment.
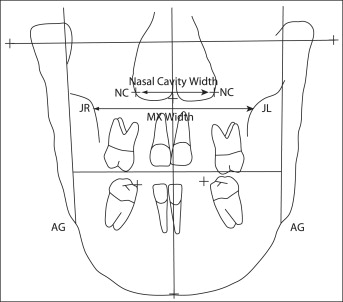
On the PA cephalograms, posterior maxillary width was measured as the distance between the bilateral jugula points, and nasal width was measured across the lowest wide part of the nasal cavity ( Fig 2 ). The enlargement factor was assessed by using the width of the screw in situ and compared with the width of the screw on the PA cephalogram. On the dental casts, maxillary intercanine, interpremolar, and intermolar widths were measured as the distances between the cusp tips of the canines, mesial fossae of the premolars, and central fossae of the molars. Mandibular inter-first molar width was measured in the central fossae.
The statistical significance of changes between baseline and posttreatment data was assessed by using paired 2-sample t tests and repeated measures analysis of variance (ANOVA). The first test was used as a microinvestigation of any significant changes between 2 specific times, and the last test was used as a macroinvestigation of the global evolution of the measurements through more than 2 times. Since there were 6 t tests for dental changes, the level of significance was corrected by the Bonferroni adjustment (α = 0.05/6) to prevent type 1 error. Moreover, unpaired 2-sample t tests were used to compared the means of dental or skeletal changes between the 2 types of appliance (bonded, banded) or between the 2 subgroups for the mandibular arch (extraction, nonextraction). ANOVA models were also used to measure the effect of phase 2 surgery. After a significant effect, protected least significant difference multiple comparisons were used to test the differences between all pairs of surgery. Finally, the association between dental and skeletal changes was investigated by using Pearson correlation coefficients. The method error was also evaluated on dental changes at T6 for which the measurements were taken twice. To do so, the Shrout and Fleiss intraclass correlations were used as a coefficient of fidelity; these were all greater than 0.99, indicating a small method error.
Results
Dental changes, as measured on the dental casts obtained at each time point, are shown in Figure 3 and Appendix. The changes in the maxillary arch during expansion (T3-T1) and after expansion (T5-T3) were significantly different from zero ( P <0.001), as were the net expansion amounts at debonding (T5-T1) and the 2-year recall (T6-T1). The amount of expansion at the second molars (7.36 mm) was similar to that at the first premolars (7.61 mm), showing the parallelism of maxillary expansion anteroposteriorly viewed from the occlusal aspect. Greater relapse was noted across the second molars; therefore, the net expansion at the second molar was significantly less than across the first premolars ( P = 0.0013). This can be explained by arch-form coordination during treatment.
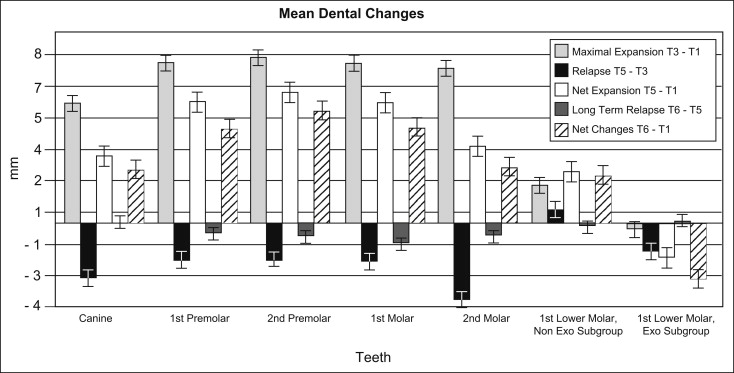
The mandibular arch changes should be interpreted cautiously. Eight patients had the first premolars extracted in the mandibular arch for second stage surgery preparation. Therefore, 2 subgroups were assessed according to this variable. The nonextraction subgroup with records at T5 (n = 28) showed significant expansion of mandibular intermolar width at debonding (2.45 ± 2.18 mm; P <0.0001), whereas the extraction subgroup (n = 8) showed variable responses with a tendency toward decreased intermolar width.
Figure 4 shows the changes over time in nasal cavity width and skeletal maxillary width (see Fig 2 for the points that were measured). In both locations, significant expansion was obtained ( P <0.0001) and post-SARPE change was negligible ( P = 0.1166). Therefore, the skeletal changes produced during SARPE can be considered to be quite stable.
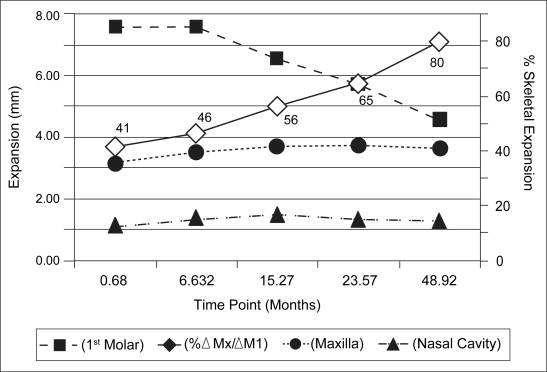
Table II shows that the 2 expansion devices had no significant difference in terms of expansion at the first molar ( P = 0.2727), the skeletal level measured at jugula ( P = 0.2735), or the nasal cavity ( P = 0.3779).
| Variable | Type of appliance | n | Mean (mm) | SD | Minimum | Maximum | P value |
|---|---|---|---|---|---|---|---|
| First molar expansion | Bonded | 17 | 7.91 | 1.29 | 5.48 | 10.99 | 0.2727 |
| Banded | 21 | 7.34 | 1.75 | 4.95 | 10.98 | ||
| Jugula expansion | Bonded | 17 | 3.88 | 1.98 | 2.00 | 8.90 | 0.2735 |
| Banded | 21 | 3.21 | 1.93 | −1.40 | 6.40 | ||
| Nasal cavity expansion | Bonded | 17 | 1.20 | 1.13 | −1.10 | 3.60 | 0.3779 |
| Banded | 21 | 1.56 | 1.33 | −1.10 | 4.20 |
Of the 36 subjects whose treatments were completed by January 2010, 10 underwent a second-stage maxillomandibular surgery for AP or vertical repositioning, 12 had mandibular advancement only, 5 had maxillary surgery only, and 9 did not need a second surgical phase. There was no significant effect of any phase 2 surgery on dental relapse ( P = 0.6637).
The data available at T3 to T4 and T5 ( Table III ) were used to analyze the timing of dental relapse changes at the first molar. About 57% of the total relapse occurred during the first 9 months after expander removal, and 43% occurred in the next 6 months. There was a significant relationship ( P <0.0001) between the amount of relapse seen after SARPE and when the posttreatment observation was made. Long-term data show that some relapse, although nonsignificant, continues to occur after orthodontic treatment. The exception was the maxillary first molar, which reached the level of significance. Thirty-nine percent of the patients with 2 years of follow-up had more than 1 mm of relapse across the first molars during those 2 years. For those 9 patients, the mean relapse was 2.2 mm.
| Time-point comparison | Relapse (mm) | Error | T or F value | df | P value |
|---|---|---|---|---|---|
| T3 vs T4 vs T5 vs T6 | 28.98 (F) | 3, 125 | <0.0001 | ||
| T3 vs T4 (9.5 ± 3.2 mo) | −1.05 | 0.30 | 3.53 (T) | 125 | 0.0006 |
| T4 vs T5 (5.7 ± 1.5 mo) | −0.79 | 0.30 | 2.62 (T) | 125 | 0.0098 |
| T3 vs T5 (15.2 ± 5.1 mo) | −1.85 | 0.29 | 6.43 (T) | 125 | <0.0001 |
| T5 vs T6 (24.7 ± 3.1 mo) | −1.09 | 0.34 | 3.23 (T) | 125 | 0.0016 |
Table IV shows that, of the different independent and dependent variables assessed in this study, only 2 variables, the diastema at T2 and the change in length of the screw during expansion, were significantly correlated with the amount of first molar expansion at T3. There was no significant association between diastema width and net expansion, skeletal and dental changes, skeletal and screw length changes, relapse and molar expansion, or relapse and skeletal expansion.
| Variable | n | r | P value |
|---|---|---|---|
| Diastema at T2 vs first molar expansion at T3 | 38 | 0.640 | <0.0001 |
| Diastema at T2 vs first molar expansion at T5 | 36 | 0.355 | 0.0334 |
| Diastema at T2 vs skeletal changes at T3 | 38 | 0.217 | 0.1902 |
| Screw changes vs first molar expansion at T3 | 38 | 0.936 | <0.0001 |
| Skeletal changes at T3 vs dental changes at T3 | 38 | 0.338 | 0.0381 |
| Skeletal changes at T3 vs screw changes at T3 | 38 | 0.295 | 0.0719 |
| Relapse T5-T3 vs first molar expansion at T3 | 36 | −0.265 | 0.1186 |
| Relapse T5-T3 vs skeletal expansion at T3 | 36 | −0.259 | 0.1271 |
Stay updated, free dental videos. Join our Telegram channel
VIDEdental - Online dental courses


