Introduction
Biochemical markers are agents directly involved in bone growth and remodeling and can be quantitatively evaluated from various biologic fluids. The aim of this study was to assess the changes in the levels of insulin-like growth factor-1 (IGF-1) in serum and urine as a growth maturity indicator and to compare them with the cervical vertebral maturation radiographic stages.
Methods
The study was conducted with 72 female subjects aged 8 to 20 years. Cervical vertebral maturation stages, and serum and urine IGF-1 levels were recorded for all subjects, and the subjects were equally divided into the 6 cervical vertebral maturation groups. Median values of IGF-1 for each stage of cervical vertebral maturation were calculated and statistically compared with those of the other stages.
Results
The levels of serum and urine IGF-1 at stage 4 of cervical vertebral maturation were significantly higher than those from the other stages ( P <0.01). Stage 4 corresponded to a mean age of 13.67 years. A significant correlation was observed between serum and urine IGF-1 ( P <0.001).
Conclusions
Urine IGF-1 follows the growth curve similar to serum IGF-1. Thus, urine IGF-1 may be regarded as a promising noninvasive tool for growth assessment. Further research is necessary to validate these results in a different population and with a larger sample.
Highlights
- •
Urine and serum insulin-like growth factor-1 (IGF-1) are regarded as promising biomarkers for growth assessment.
- •
They follow the pubertal growth curve without the subjectivity of radiographic markers.
- •
The peaks in serum and urine IGF-1 were observed in stage 4 of the cervical vertebral maturation index.
- •
A significant positive correlation was seen between serum and urine IGF-1.
- •
Urine IGF-1 is a noninvasive surrogate for serum IGF-1.
Identification of skeletal maturity—ie, the growth phase—with particular regard to the onset of the pubertal growth spurt, has major clinical implications when dealing with orthodontic treatment in growing subjects, especially when there are skeletal disharmonies.
The use of the cervical vertebrae has the advantage of not requiring an additional radiograph. However, the assessment of the maturational stage depends on the subjective evaluation and perception of the clinician, thereby questioning its repeatability and validity.
Newer possibilities might be provided with biochemical markers representing agents that are directly involved in bone growth and remodeling. Levels of biochemical markers of bone formation and resorption change with longitudinal bone growth and remodeling, and these changes are related to the pubertal stages. Biomarkers have the advantage of avoiding invasive x-ray exposure. They can be measured from various biologic fluids such as blood, saliva, and urine, thereby overcoming the subjectivity associated with radiographs.
Insulin-like growth factor-1 (IGF-1) mediates most of the physiologic actions of growth hormones and is the major effector of bone growth. IGF-1 accelerates growth, differentiation, and substrate synthesis activities in the osteoblasts and chondroblasts.
IGF-1 is measurable in serum (in which it was first detected) as well as in urine and saliva. Studies conducted on serum IGF-1 have reported that its levels in children and adolescents follow a pattern that is closely related to the pubertal growth curve: low in the prepubertal stages followed by a sharp increase at puberty and returning to lower baseline values after pubertal growth.
Hizuka et al were the first to demonstrate IGF-1 in urine, and they stated that the quantity of IGF-1 in urine was altered in patients with either growth hormone excess or growth hormone deficiency. Although IGF-1 was initially detected in urine about 27 years ago and has been shown to be lower when compared with that of serum under healthy conditions, no investigation has evaluated the possibility of using this urinary parameter as a clinical diagnostic aid in dentistry and orthodontics.
The aims of this study were to assess the changes in the levels of IGF-1 in serum and in urine as growth maturity indicators and to compare them with the cervical vertebral maturation index (CVMI) radiographic stages. Furthermore, we intended to study the relationship between serum and urine IGF-1.
Material and methods
This cross-sectional clinical study was conducted on female subjects aged 8 to 20 years who came to the out patient department at the Department of Orthodontics and Dentofacial Orthopaedics, Maulana Azad Institute of Dental Sciences, New Delhi, India. Approval for the study was obtained from the research ethical committee of the institute. The subjects and their parents were informed about the research plan through a bilingual patient information sheet, and written informed consent was obtained for collection of blood and urine samples and appropriate radiographs. Selection of the subjects was done on the basis of the following inclusion criteria: absence of systemic (acute or chronic) disease, growth abnormality, or bleeding disorder; no history of chronic medication; and no history of any trauma or surgery in the area of the cervical vertebrae.
The sample size estimation performed at the 5% level of significance (α = 0.05) with power of 80% showed that a minimum of 10 subjects per CVMI group was necessary. With further inclusion of a 20% attrition rate, the total number of subjects finally evaluated was 72, with 12 per CVMI group.
Personal information and history were recorded, and standardized lateral cephalograms were taken of all subjects in natural head position for assessing the cervical vertebral maturation stages. The criteria of Hassel and Farman were used to evaluate the cervical vertebral radiographic morphology. These criteria involve an evaluation of the morphologic features of the cervical vertebral bodies restricted to those that are visible on the lateral cephalogram even when a protective collar is worn. The purely subjective assessment is easy to learn and simple to apply clinically. Hassel and Farman’s assessment is based on the change in shape of the vertebral bodies, mainly the height-width ratio and the appearance of the inferior concavity. These features have been shown to progress during ontogeny in a caudal direction, from stages 2 to 6.
To reduce the subjective variability in CVMI stage assessment, 2 examiners (M.S., T.T.) reviewed the 72 radiographs. They were blinded to each subject’s age and pubertal status to ensure interexaminer reliability. The same examiners revaluated the radiographs a week later for intraexaminer reliability.
For the subjects, 5 mL each of blood and random morning midstream urine samples were collected on the day of the radiographs. The blood samples were centrifuged to separate the serum from blood. The urine and serum samples were then pipetted out separately using individual tips, into plastic Eppendorf tubes (Eppendorf, Hamburg, Germany), which were stored in a sealed plastic box in a deep freezer at −80°C until assay. On the day of the assay, all the samples were brought to room temperature, and the urine samples were ultracentrifuged. During the entire period of sample collection, utmost care was taken to prevent multiple freeze-thaw cycles before the final assay procedure.
Measurements of serum and urine IGF-I levels were made using human IGF-1 ELISA (RayBiotech, Norcross, Ga) kits. The kit uses an in-vitro sandwich enzyme-linked immunosorbent assay for the quantitative measurements of IGF-1 in serum, plasma, cell culture supernatants, and urine, with an antibody specific for human IGF-1 coated on a 96-well plate. The kit has a coefficient of variation for intra-assay reproducibility of less than 10%. We constructed the standard calibration curves for the ranges corresponding to serum and urine IGF-1 values. By testing duplicate samples, we estimated the average errors across 18 observations to be about 0.15 ng per milliliter for urine IGF-1 and about 15 ng per milliliter for the serum IGF-1. The urine IGF-1 assay was followed by creatinine estimation using an auto analyzer, to rule out any renal disorder.
Statistical analysis
The kappa statistic was used to measure the interexaminer and intraexaminer reliabilities. The Kruskal-Wallis test was used to compare the mean ranks of serum IGF-1 (ng/mL) and urine IGF-1 (ng/mL) across the different stages of the CVMI. The Mann-Whitney U test was used for pair-wise comparisons between the values of each study variable (serum IGF-1, urine IGF-1) across all the possible combinations of CVMI stages. The Spearman correlation coefficients were determined between serum IGF-1 and urine IGF-1 levels. All statistical analyses were performed using SPSS software (version 17; SPSS, Chicago, Ill).
Results
We calculated the interexaminer kappa statistics for both weeks and found the average to be 0.89. We computed the average intraexaminer kappa statistic to be 0.91, thus showing no statistically significant difference between the examiners’ readings.
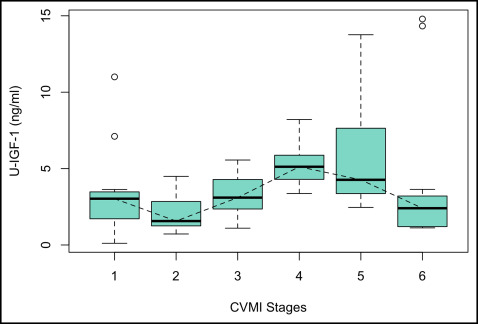
Table I summarizes the median values and ranges of serum and urine IGF-1 for every stage of the CVMI. It was observed that the serum IGF-1 levels gradually increased from stage 1 toward stage 2. A steep increase was observed between stages 2 and 3, and the peak value was reached at stage 4, followed by a decline toward stage 5, to reach its baseline level at stage 6. The highest median serum IGF-1 value was observed in stage 4 (408.59 ng/mL), at a mean age of 13.67 years, whereas the lowest median was observed in stage 1 (176.75 ng/mL) ( Fig 1 ). The levels of IGF-1 in urine declined from stage 1 to stage 2, followed by a steady increase from stage 2 to stage 3, and finally reaching its peak at stage 4. Thereafter, a gradual decline was observed from stages 4 through 6. The highest median value was recorded for stage 4 (5.12 ng/mL), and the lowest median was observed for stage 2 (1.57 ng/mL) ( Fig 2 ).
| Serum IGF-1 (ng/mL) | Urine IGF-1 (ng/mL) | |||||||||||
|---|---|---|---|---|---|---|---|---|---|---|---|---|
| CVMI stage | n | Mean age (y) | Mean | Median | SD | Minimum | Maximum | Mean | Median | SD | Minimum | Maximum |
| 1 | 12 | 8.75 | 175.81 | 176.75 | 10.46 | 157.86 | 189.23 | 3.41 | 3.03 | 2.97 | 0.11 | 11.00 |
| 2 | 12 | 10.92 | 207.38 | 207.38 | 9.76 | 193.76 | 224.20 | 2.11 | 1.57 | 1.29 | 0.72 | 4.49 |
| 3 | 12 | 11.83 | 329.49 | 323.30 | 22.17 | 300.87 | 371.76 | 3.28 | 3.10 | 1.28 | 1.10 | 5.56 |
| 4 | 12 | 13.67 | 410.63 | 408.60 | 11.92 | 396.67 | 432.10 | 5.18 | 5.12 | 1.35 | 3.37 | 8.21 |
| 5 | 12 | 16.42 | 303.12 | 303.33 | 7.63 | 290.80 | 315.45 | 5.68 | 4.27 | 3.51 | 2.46 | 13.76 |
| 6 | 12 | 18.92 | 205.81 | 206.44 | 6.65 | 197.65 | 220.89 | 4.14 | 2.41 | 4.93 | 1.12 | 14.79 |
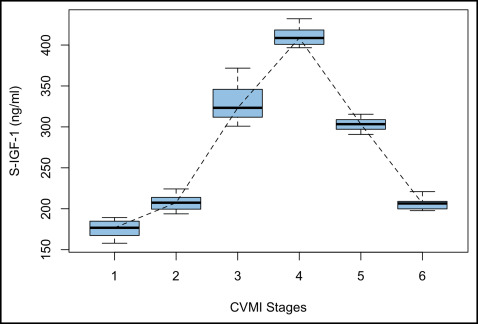
The Kruskal-Wallis test showed that the mean ranks of serum IGF-1 and urine IGF-1 for 1 stage of the CVMI were statistically different from at least 1 other stage of the CVMI, implying that the distributions were not identical across the 6 stages. The results of the Mann-Whitney U test showed that the serum IGF-1 level at stage 4 was significantly higher and different from the serum IGF-1 levels at stages 1, 2, 3, 5, and 6 ( P <0.001). Serum IGF-1 at stage 1 was statistically significantly lower than serum IGF-1 at all other CVMI stages ( P <0.001) ( Table II ).
| Serum IGF-1 (ng/mL) | Urine IGF-1 (ng/mL) | ||||
|---|---|---|---|---|---|
| Kruskal-Wallis test on serum IGF-1 vs CVMI stage is significant: P <0.001 | Kruskal-Wallis test on urine IGF-1 vs CVMI stage is significant: P <0.002 | ||||
| Mann-Whitney U tests comparing the median of serum IGF-1 for CVMI stage a vs b | Mann-Whitney U tests comparing the median of urine IGF-1 for CVMI stage a vs b | ||||
| CVMI stage a | CVMI stage b | Difference in location (median): a − b | P value | Difference in location (median): a − b | P value |
| 1 | 2 | −31.43 | 0.0000 | 0.95 | 0.2475 |
| 3 | −150.70 | 0.0000 | −0.45 | 0.4186 | |
| 4 | −233.89 | 0.0000 | −2.24 | 0.0072 | |
| 5 | −126.58 | 0.0000 | −1.74 | 0.0350 | |
| 6 | −29.20 | 0.0000 | 0.26 | 0.6859 | |
| 2 | 3 | −118.13 | 0.0000 | −1.11 | 0.0281 |
| 4 | −202.42 | 0.0000 | −3.42 | 0.0002 | |
| 5 | −95.91 | 0.0000 | −2.59 | 0.0015 | |
| 6 | 1.58 | 0.7125 | −0.48 | 0.5062 | |
| 3 | 4 | −84.82 | 0.0000 | −1.80 | 0.0046 |
| 5 | 21.85 | 0.0005 | −1.46 | 0.0530 | |
| 6 | 117.66 | 0.0000 | 1.05 | 0.3260 | |
| 4 | 5 | 105.81 | 0.0000 | 0.65 | 0.5443 |
| 6 | 202.67 | 0.0000 | 2.61 | 0.0086 | |
| 5 | 6 | 97.36 | 0.0000 | 1.86 | 0.0262 |
The level of urine IGF-1 at stage 4 was found to be statistically significantly higher than at stages 1 ( P <0.01), 2 ( P <0.001), 3 ( P <0.01), and 6 ( P <0.01). Urine IGF-1 at stage 2 was statistically significantly lower than urine IGF-1 at stage 3 ( P <0.05), stage 4 ( P <0.001), and stage 5 ( P <0.001). The mean rank difference suggested that urine IGF-1 was highest at stage 4 followed by stages 5, 3, 1, and 6, with the lowest value at stage 2. The difference between stages 4 and 5 was not statistically significant. ( Table II ).
The Spearman correlation coefficient (Spearman ρ) determined the correlations between serum IGF-1 and urine IGF-1 for the 6 CVMI stages ( Table III ). Statistically significant positive correlations were seen between serum IGF-1 and urine IGF-1 (ρ = 0.388, P <0.001). Serum IGF-1 and urine IGF-1 levels showed a significant positive correlation (ρ = 0.454, P <0.001) from CVMI stages 1 through 4, and a negative correlation, although not significant, from CVMI stages 1 to 2. Similarly, the levels of serum IGF-1 and urine IGF-1 showed statistically significant positive correlations from CVMI stages 5 to 6 (ρ = 0.391, P <0.05), and a negative correlation from stages 4 to 5.
| CVMI stage | Spearman correlation coefficient | P value |
|---|---|---|
| 1 to 6 | 0.388 | 0.0008 |
| 1 to 4 | 0.454 | 0.0012 |
| 4 to 6 | 0.391 | 0.0184 |
| 1 to 2 | −0.264 | 0.2120 |
| 2 to 3 | 0.362 | 0.0821 |
| 3 to 4 | 0.529 | 0.0079 |
| 4 to 5 | −0.072 | 0.7390 |
| 5 to 6 | 0.331 | 0.1137 |
Discussion
The CVMI as an indicator for skeletal maturity has had its share of proponents and opponents. In a recent study, Perinetti et al concluded that visual assessment of the CVMI stages was accurate and repeatable to a satisfactory level. Although the validity of the CVMI has been questioned occasionally, many authors have proposed its efficacy in assessing growth potential when used with other diagnostic tools. Hassel and Farman stated that since skeletal maturation is a continuous process, 1 diagnostic tool should not be relied on too heavily. Thus, the various growth maturity indicators must be used together when considering orthodontic corrections to ensure accuracy.
Baccetti et al stated that an “ideal” biologic indicator of individual mandibular skeletal maturity should be characterized by the following features: (1) efficacy in detecting the peak in mandibular growth, (2) no need for additional x-ray exposure, (3) ease in recording, and (4) consistency in the interpretation of the data. Urine can be collected in large amounts in a noninvasive manner. The discovery of urinary biomarkers holds potential for early prediction of skeletal maturation and is useful in making diagnostic choices in orthodontics.
We used only female subjects, thereby eliminating any confounding sex bias, because IGF-1 levels differ in the sexes. Also, determining the timing of maturation with sufficient accuracy is particularly important for girls because they have shorter pubertal spurts and complete their growth earlier than do boys. The IGF-1 assay was performed with an ELISA IGF-1 technique because of its increased analytic sensitivity and specificity and the easy availability of the kit.
Yamamoto and Kato compared IGF-1 concentrations in timed urine samples for a day and found that IGF-1 concentrations were highest in the morning samples. They also concluded that there was a positive correlation between IGF-1 values for the 24-hour urine sample and those from the early morning. Thus, we collected the urine samples in the morning in our study, followed by blood and radiographs on the same day.
Ryan et al measured IGF-1 in saliva and found its levels to be very low, thereby making accurate measurements difficult. In addition to the technical difficulties in sample collection and storage, contamination with gingival fluid or blood can also result in inaccurate measurements. On the other hand, collection, storage, and processing of urine samples are effortless and less technique sensitive, and the assay can be easily performed in any clinical setting.
Our results for serum IGF-1 were similar to those of Ishaq et al, who evaluated the applicability of serum IGF-1 level as a maturation indicator by correlating it with the CVMI in Egyptian subjects. In their study, the 60 female subjects had the highest mean IGF-1 value in stage 4 at a mean age of 14 years and a mean value of 794 ± 217 ng/mL.
A similar trend was observed in our study, with the highest median value of serum IGF-1 observed at stage 4 (408.59 ng/mL) at a mean age of 13.67 years, followed by stage 3 (323.30 ng/mL) and then stage 5 (303.33 ng/mL). The differences in the levels of IGF-1 at each stage between our study and the one previously reported may be attributed to the ethnicity of the populations under study, in addition to the effects of genetics and the environment on the local and systemic factors influencing craniofacial growth.
Masoud et al correlated IGF-1 with cervical vertebral maturation in 83 subjects (44 female, 39 male) aged between 5 and 25 years. They reported that serum levels of IGF-1 peaked at stage 5 of cervical vertebral maturation, and the highest mean IGF-1 value was 406.8 μg/L. The differences in observations might be attributed to the facts that only female subjects were included in our study to eliminate any confounding effects of sex bias, and that there was a uniform distribution of the subjects in the 6 stages of the CVMI.
Hizuka et al collected random urine IGF-1 samples from 8 normal subjects, 10 subjects with acromegaly, and 9 with hypopituitarism and observed that IGF-1 in urine reflected each subject’s growth hormone status.
We investigated the levels of IGF-1 in urine. It was observed that the urine IGF-1 levels were very low, approximately 0.01 of the levels of serum. Yokoya et al and Gargosky et al also reported that concentrations of IGF-1 measured in urine by radioimmunoassay were low, approximately 0.001 of the levels found in serum.
Urine IGF-1 level peaked late in puberty with the highest median value recorded in stage 4 (5.12 ng/mL) corresponding to the mean age of 13.67 years. Ratcliffe et al assessed the relationship of urinary IGF-1 with age, pubertal status, and urinary growth hormone and observed a pubertal rise in urinary IGF-1, peaking at pubertal stage 3. Hall et al also reported that the levels of urinary IGF-1 rose during puberty to peak at the Tanner stage 4. Quattrin et al quantitated IGF-1 in children with normal and abnormal growth and stated that IGF-1 excretion was significantly higher in pubertal children than in prepubertal children. Yokoya et al conducted a study on immunoreactive IGF-1 in urine from normal subjects, subjects with pituitary dwarfism, and subjects with acromegaly and also demonstrated that urinary IGF-1 excretion was elevated at puberty and decreased with age.
In this study, we observed a statistically significant correlation between serum IGF-1 and urine IGF-1 across the 6 stages of the CVMI (ρ = 0.388, P <0.001). Gill et al studied the serum and urine levels of IGF and IGF binding protein-3 in 69 children and observed significant correlations between serum and urine IGF-1 levels. They concluded that urine IGF-1 could be used as a noninvasive physiologic marker of the growth hormone-IGF axis. Hall et al, in their study on the relationship between serum and urinary IGF-1 through childhood and adolescence, concluded that there is a significant relationship between serum and urinary IGF-1. They also stated that the levels of serum and urine IGF-1 change in a similar manner through childhood and adolescence.
Our results demonstrated a rise in the levels of serum and urine IGF-1 starting at stage 2 and peaking at stage 4, followed by a gradual decline to stage 5 as pubertal growth approached its final stages. Skeletal responses with growth modification can be maximized at CVMI stages 3 and 4. The peak growth velocities in height and mandibular growth have been shown to occur between stages 3 and 4 of the CVMI, with a peak late in puberty and a more gradual decline thereafter. Maximum changes in ramus and body length and the greatest apposition at condylion have also been observed from stages 3 to 4; this also corresponds to the increasing levels of IGF-1 in our study from stages 3 to 4, and to the stage that showed the greatest anterior morphogenetic rotation of the mandible with the largest closure of gonion at the peak interval of stages 3 to 4.
The Mann-Whitney U test showed that the medians of serum and urine IGF-1 values recorded at stages 3 and 4 of the CVMI were statistically different from the values recorded at the other stages. Thus, IGF-1 may provide a legitimate and an objective assessment of the peak of the pubertal growth spurt. Also, as observed by Masoud et al, IGF-1 testing could prove to be a promising tool for predicting the timing and the intensity of the mandibular growth spurt.
The quantification of IGF-1 would help us to know the maturity status better because a patient’s time spent in each CVMI stage is variable, and not all subjects pass through each stage. Also, because of the limitations posed by exposure to radiation and the subjectivity associated with radiographic techniques, it is unclear how long each cervical stage lasts. Each stage blends into the next, and it may be difficult to classify some borderline cases. There can be mistakes, since the CVMI stage does not always determine the exact timing of maturation accurately.
Hence, from our results on serum and urine IGF-1, it could be hypothesized that an additional growth component (residual mandibular growth) exists in the craniofacial skeleton well after the completion of statural growth as assessed from the morphologic patterns of the cervical vertebrae. This allows orthodontists to correct skeletal discrepancies in the craniofacial skeleton with orthopedic therapeutic regimens even during the late circumpubertal stages of development. Quantitative estimation of IGF-1 may calculate residual facial growth and thus be helpful in borderline cases for growth modification of patients whose orthodontist predicts the possibility of using a myofunctional appliance but whose chronologic age does not suggest growth modification therapy.
It will also help orthodontists in identification of subjects who are at the opposite end of the growth curve with complex dentofacial deformities amenable to surgical correction. The concept of residual skeletal growth has expanded the dimensions of treatment options for patients. A treatment plan can vary from orthognathic surgery to extraction of teeth to nonextraction of teeth, depending on the growth factor. We believe that IGF-1 assessment would give the orthodontist a reasonable idea of how much growth can be factored into planned treatment. Thus, it would benefit a wide range of orthodontic patients at different stages on the pubertal growth curve.
Furthermore, we have demonstrated that serum and urine IGF-1 show similar changes with pubertal maturation and increasing age. To properly describe the relationship between IGF-1 and mandibular growth, it would be necessary to collect IGF-1 samples over regular intervals. This would more accurately describe the levels and pattern of IGF-1. Since urine IGF-1 follows the growth curve and overcomes the limitations of salivary measurements, it may be a surrogate for a noninvasive clinical biomarker for the identification of the pubertal growth spurt.
Although obtaining blood and urine samples is not a common practice in orthodontics, we encountered less resistance in collecting them than we had expected. Making the subjects aware of the interdependence among growth, orthodontic treatment options, and the stability of treatment results followed by an explanation of the simplicity of the procedures involved, we saw that the subjects were more than willing to participate in our study and know the results.
Stay updated, free dental videos. Join our Telegram channel
VIDEdental - Online dental courses


