Introduction
We assessed the relationship between race and orthodontic service use for Medicaid-enrolled children.
Methods
This cross-sectional study focused on 570,364 Medicaid-enrolled children in Washington state, ages 6 to 19 years. The main predictor variable was self-reported race (white vs nonwhite). The outcome variable was orthodontic service use, defined as children who were preauthorized for orthodontic treatment by Medicaid in 2012 and subsequently received orthodontic records and initiated treatment. Logistic regression models were used to test the hypothesis that nonwhites are less likely to use orthodontic care than are whites.
Results
A total of 8223 children were approved by Medicaid for orthodontic treatment, and 7313 received records and began treatment. Nonwhites were significantly more likely to use orthodontic care than were whites (odds ratio [OR] = 1.18; 95% confidence interval [CI] = 1.02, 1.36; P = 0.031). Hispanic nonwhite children were more likely to use orthodontic care than were non-Hispanic white children (OR = 1.42; 95% CI = 1.18, 1.70; P <0.001).
Conclusions
In 2012, nonwhite children in the Washington Medicaid program were significantly more likely to use orthodontic care than were white children. The Washington Medicaid program demonstrates a potential model for addressing racial disparities in orthodontic service use. Future research should identify mechanisms underlying these findings and continue to monitor orthodontic service use for minority children in Medicaid.
Highlights
- •
We examined racial disparities in orthodontics for children in Medicaid.
- •
Nonwhite children were significantly more likely to use orthodontic services than white children.
- •
State Medicaid programs can address racial disparities in pediatric orthodontic use.
Racial and ethnic minorities comprise a significant portion of the population in the United States. According to the Centers for Disease Control and Prevention, minorities are defined as Hispanic or Latinos, black or African Americans, Asian Americans, American Indians and Alaska Natives, and Native Hawaiians or Pacific Islanders. Based on 2011 US Census Bureau data, 36.6% of the population is of minority descent, including 16.7% Hispanic or Latino, 13.1% black or African American, 5% Asian, 1.2% American Indian or Alaska Native, and less than 1% Native Hawaiian or Pacific Islander. As the proportion of minorities in the United States continues to grow, it is critical to understand and address racial and ethnic oral health disparities, which is an important step toward achieving health equity and social justice.
Minority children experience oral health disparities. Based on data from the 2007 National Survey of Children’s Health, 15% of non-Hispanic white children did not have an annual preventive dental visit, and 24% of Hispanic children and 18% of black children did not have a visit. Based on the same data, 8.8% of white children were rated by their parent as having fair or poor oral health, but 20.4% of Hispanic children and 10% of black children had fair or poor oral health. In another study focusing on privately insured children in Milwaukee, Wisconsin, black and Hispanic children received significantly fewer preventive dental procedures than did white children. After adjusting for household income, black children were less likely than whites to receive most dental procedures. These findings parallel studies focusing on Medicaid populations. In Iowa, African American children in Medicaid were significantly less likely to have a dental checkup than were white children.
Minorities are also more likely to have malocclusions and orthodontic treatment needs. Authors of a study in 1998 examined Class II and Class III malocclusions using National Health and Nutrition Examination Survey III data for 7000 children. Class II malocclusion was defined as an overjet greater than 2 mm. Whites, blacks, and Mexican Americans had varying prevalence values of Class II malocclusion (57.6%, 64.4%, and 66.4%, respectively). Class III malocclusion was defined as an overjet of 0 mm or less. The prevalences of Class III malocclusion among whites, blacks, and Mexican Americans were 4.9%, 8.1%, and 8.3%, respectively. These data indicate that Class II and Class III malocclusions are more prevalent in blacks and Mexican Americans. The Index of Orthodontic Treatment Need was used to evaluate need, and minorities were more likely to have orthodontic treatment needs.
Despite data indicating greater orthodontic treatment needs for minorities, there are relatively few studies on minority orthodontic service use. Over 30% of white teenagers reported receiving orthodontic treatment—3 times the rate for Mexican American and 4 times the rate for black teenagers. In another study based on Medical Expenditure Panel Survey data, whites accounted for 59.9% of the population yet disproportionately accounted for 77.1% of those who received orthodontic treatment. After adjusting for income, blacks and Hispanics were less likely than whites to receive orthodontic treatment. Using survey data from over 2800 US high school sophomores in Ohio, the authors of a 2004 study reported that orthodontic treatment figures for whites, Mexican Americans, and African Americans were 31%, 11%, and 8%, respectively. Orthodontic use figures were over 50% in schools in suburban, affluent areas and were less than 10% in inner city high schools, which consist disproportionately of lower-income, minority students.
The federal Early and Periodic Screening, Diagnosis, and Treatment program mandates orthodontic care to correct a handicapping malocclusion for all Medicaid-enrollees through age 21 years. Based on previous findings, it is unlikely that the requirements of the Early and Periodic Screening, Diagnosis, and Treatment program are being met by state Medicaid programs for minorities, but studies to date have not examined orthodontic care use for minorities in Medicaid. To address this knowledge gap, we hypothesized that among Medicaid-enrolled children in Washington, nonwhites would be less likely to use orthodontic services than whites. We also hypothesized that factors such as ethnicity would modify the relationship between race and orthodontic use. This study is the first step in assessing the extent to which there are racial disparities in orthodontic care in Medicaid programs.
Material and methods
There are 1.6 million children between 0 and 17 years of age in the state of Washington; 39% are nonwhite. In comparison, 59% of Medicaid-enrolled children in Washington are nonwhite. The Handicapping Labiolingual Deviation Index is used by Washington Medicaid as a orthodontic treatment screening tool. This index provides diagnostic information about anterior overjet, overbite, ectopic eruption, crowding, buccal overjet, and labiolingual spread. Once a potential candidate is identified by an orthodontic care provider, an application with Handicapping Labiolingual Deviation Index data is submitted to the state approval committee. If a child is preauthorized for care, orthodontic records are obtained, and treatment begins. The orthodontic provider submits claims at the appropriate intervals to be reimbursed by Medicaid for treatment. In January 2012, Washington Medicaid reimbursement rates for orthodontic care were $276.75 for records, $1836.18 for treatment initiation, and $308.46 for each additional 3 months of active treatment.
Medicaid enrollment and claims data were obtained from the Washington State Department of Social and Health Services Research and Data Analysis Division’s Integrated Client Database. The enrollment files included demographic information (child’s date of birth, race, ethnicity, sex) and the specific months during 2012 in which the child was enrolled in Medicaid. The claims data included information on dental care received by the child identified with the American Dental Association’s Current Dental Terminology (CDT) codes. A unique identifier was used to link the enrollment and claims files. The study was approved by the Washington state institutional review board.
In this study, we focused on children ages 6 to 19 years enrolled for at least 1 month in the Washington Medicaid program between January 1, 2012, and December 31, 2012 (N = 570,364). This age range takes into consideration the ages at which orthodontic services are typically provided to children.
Study variables
The main predictor was the child’s race, as reported by his or her primary caregiver. Children were classified as white or nonwhite (black, Asian, American Indian, Alaskan Native, Hawaiian, Pacific Islander, other, or missing).
The outcome variable was orthodontic service use (no or yes). This was defined through CDT code D8660, which indicated a claim submitted by a provider for orthodontic records between January 1, 2012, and September 30, 2012. This 9-month window served as the baseline period, and the latter date of this range was selected to allow children up to 3 months to start treatment after obtaining records. The CDT codes of D8010 through D8080 represented the initiation of orthodontic treatment. Children with a code of D8660 followed by D8010 through D8080 were classified as having used orthodontic services, and the remaining children were classified as not having used orthodontic services.
There were 4 additional study variables: sex (female, male); age (6-11 or 12-19 years) calculated as of December 31, 2012; Hispanic ethnicity (caregiver reported as Hispanic or non-Hispanic); and preventive dental care use in 2012 (no, yes). Children with any of the following CDT codes were classified as having used preventive dental care in 2012: D1110 through D1120 (dental prophylaxis), D1206 or D1208 (topical fluoride treatment), D1330 (oral hygiene instructions), or D1351 (sealant application). Each variable was conceptualized as a potential effect modifier of race and was not part of the main-effects model.
Statistical analysis
Descriptive statistics were calculated for the study variables, and logistic regression models were used to estimate the odds ratio (OR) and the corresponding 95% confidence interval (95% CI) (α = 0.05). To identify effect modifiers, we included interaction terms in separate regression models between race and these variables: age, ethnicity, and preventive dental care use. Data were analyzed with software (version 13 for Windows; StataCorp, College Station, Tex).
Results
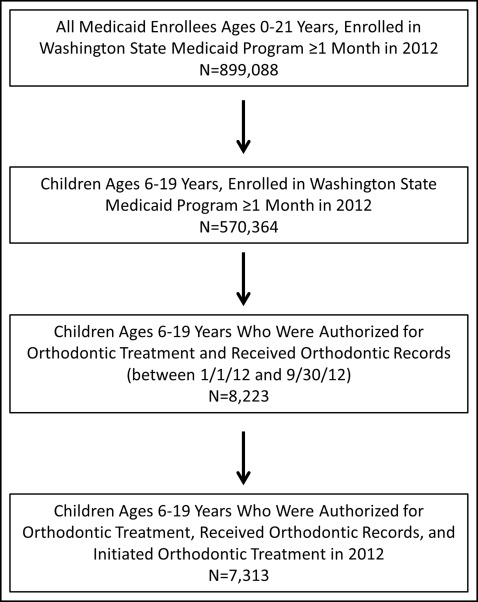
A total of 899,088 enrollees ages 0 through 21 years were enrolled in the Washington Medicaid program for 1 month or longer in 2012 ( Fig ). After we excluded children younger than 6 years and older than 19 years, 570,364 children were part of the study population, with a mean age of 12.7 years (SD, 4.1 years). Of the children in the study, 46.4% were 6 to 11 years old, and the remaining 53.6% were 12 to 19 years old ( Table I ). About 50% of the children were female, 48% were white, 24% were Hispanic, and 53% used preventive dental care in 2012.
| Demographic characteristic | Total sample (N = 570,364), n (%) |
|---|---|
| Sex | |
| Female | 284,815 (49.9) |
| Male | 285,541 (50.1) |
| Age (y) | |
| 6-11 | 264,756 (46.4) |
| 12-19 | 305,608 (53.6) |
| Race | |
| White | 272,038 (47.7) |
| Black | 33,526 (5.9) |
| Asian | 17,862 (3.1) |
| American Indian | 16,553 (2.9) |
| Alaskan Native | 262 (0.1) |
| Hawaiian | 1,500 (0.3) |
| Pacific Islander | 11,638 (2.0) |
| Other | 144,049 (25.2) |
| Missing | 72,936 (12.8) |
| Ethnicity | |
| Hispanic | 137,447 (24.1) |
| Non-Hispanic | 340,167 (59.6) |
| Missing | 92,750 (16.3) |
| Preventive dental care use in 2012 | |
| Yes | 302,171 (53.0) |
| No | 268,193 (47.0) |
Of the 570,364 children in the study, 1.4% (n = 8223) were authorized for orthodontic treatment and received records, and 1.3% (n = 7313) started orthodontic treatment in 2012. Among those who used orthodontic care, 38.9% were white and 52.4% were nonwhite ( Table II ). Of the 910 children who obtained records but did not start orthodontic treatment, 40.2% were white and 46.0% were nonwhite.
| Demographic characteristic | Children who obtained records and initiated orthodontic treatment (n = 7313) Mean (SD) or n (%) | Children who obtained records but did not initiate orthodontic treatment (n = 910) Mean (SD) or n (%) | Children who obtained records, with or without orthodontic treatment initiation (n = 8223) Mean (SD) or n (%) |
|---|---|---|---|
| Age (y) | 13.6 (2.6) | 13.3 (3.0) | 13.6 (2.7) |
| <12 | 1985 (27.1%) | 319 (35.0%) | 2304 (28.0%) |
| ≥12 | 5328 (72.9%) | 591 (65.0%) | 5919 (72.0%) |
| Race | |||
| White | 2844 (38.9%) | 366 (40.2%) | 3210 (39.0%) |
| Black | 365 (5.0%) | 56 (6.2%) | 421 (5.1%) |
| Asian | 213 (2.9%) | 30 (3.3%) | 243 (3.0%) |
| American Indian | 153 (2.1%) | 25 (2.8%) | 178 (2.2%) |
| Alaskan Native | 6 (0.1%) | 0 (0%) | 6 (0.1%) |
| Hawaiian | 7 (0.1%) | 1 (0.1%) | 8 (0.1%) |
| Pacific Islander | 81 (1.1%) | 19 (2.1%) | 100 (1.2%) |
| Other | 3009 (41.1%) | 288 (31.6%) | 3297 (40.1%) |
| Missing | 635 (8.7%) | 125 (13.7%) | 760 (9.2%) |
| Ethnicity | |||
| Hispanic | 2791 (38.2%) | 287 (31.5%) | 3078 (37.4%) |
| Non-Hispanic | 3640 (49.8%) | 503 (55.3%) | 4143 (50.4%) |
| Missing | 882 (12.0%) | 120 (13.2%) | 1002 (12.2%) |
| Preventive dental care use in 2012 | |||
| Yes | 6301 (86.2%) | 775 (85.2%) | 7076 (86.0%) |
| No | 1012 (13.8%) | 135 (14.8%) | 1147 (14.0%) |
Stay updated, free dental videos. Join our Telegram channel
VIDEdental - Online dental courses


