Introduction
The purpose of this study was to compare the bone thickness of the palatal areas in early and late mixed and early permanent dentitions according to dental age.
Methods
Cone-beam computed tomography scans of 118 subjects were selected and divided into 38 early mixed (8.03 ± 0.93 years), 40 late mixed (11.51 ± 0.92 years), and 40 permanent (20.92 ± 1.17 years) dentition subjects. The measurements of palatal bone thickness were made at 49 sites by using InVivoDental5.0 software (Anatomage, San Jose, Calif). Repeated measures analysis of variance was used to analyze intragroup and intergroup differences as well as sex dimorphism.
Results
There was significantly lower bone thickness in the early mixed dentition group than in the 2 other groups ( P <0.001). Bone thickness was higher in the anterior region than in the middle and posterior regions ( P <0.001). Also, significant differences were found among the midline, medial, and lateral areas of the palate.
Conclusions
Palatal bone thicknesses were significantly lower in the early mixed dentition group than in both the late mixed and permanent dentition groups. These findings might be helpful for clinicians to enhance the successful use of temporary anchorage devices in the palate.
New treatment paradigms have reduced the importance of patient compliance as a significant factor in the treatment of adolescents. Temporary skeletal anchorage devices are frequently placed buccally and palatally to achieve several types of tooth movements. However, buccal placement of temporary skeletal anchorage devices in the mixed dentition is difficult because of narrow interradicular spaces and erupting permanent teeth.
Several authors have placed temporary skeletal anchorage devices in the palate to produce various desired movements. The nontooth-bearing area of the palate is often selected for placement of temporary skeletal anchorage devices because of sufficient bone quality and less possibility of root damage to the adjacent teeth. In addition, this anchorage is highly successful without hindering tooth movement during treatment.
Nevertheless, in adolescents, the incomplete obliteration of the midpalatal suture might increase placement risks. Recently, Kook et al reported the placement of a palatal plate for molar distalization in patients with late mixed and permanent dentitions. This plate was designed to be placed in the paramedian palatal area to prevent interference with the growth of the midpalatal suture.
The palate was reported to be a reliable and stable placement site for temporary skeletal anchorage devices because it offers both sufficient quality and quantity of bone. In particular, palatal bone thickness was considered to be a key factor for the success of temporary skeletal anchorage devices. King et al evaluated the palatal bone volume for placement of implants in adolescents using computed tomography. However, their sample’s mean age was 14 years. Gracco et al also compared bone thickness in adults to that of adolescents using cone-beam computed tomography and reported insignificant differences. Nevertheless, previous studies did not include subjects in the early mixed dentition.
Therefore, the purpose of this study was to compare the bone thickness of various palatal areas among subjects with early and late mixed dentition and permanent dentition by using cone-beam computed tomography to guide clinicians in selecting the most appropriate sites for temporary skeletal anchorage devices in the palate, especially in adolescents.
Material and methods
The sample consisted of cone-beam computed tomography scans of 118 randomly selected patients who had visited the dental department of Seoul St. Mary’s Hospital, The Catholic University of Korea. The settings were 120 kVp; 47.74 mA; field of view, 17 × 23 cm; exposure time, 40 seconds; we used an i-CAT scanner (Imaging Sciences International, Hatfield, Pa) with a spatial resolution of 10 line pairs per centimeter and an isotropic 0.4-mm voxel size. Group 1 included 38 subjects with early mixed dentition (13 girls, 25 boys; mean age, 8.03 ± 0.93 years), group 2 contained 40 subjects with late mixed dentition (21 girls, 19 boys; mean age,11.51 ± 0.92 years), and group 3 included 40 subjects with permanent dentition (20 women, 20 men; mean age, 20.92 ± 1.17 years). The grouping of the early and late mixed dentitions was based on the stage of dental development as reported by Björk et al. The exclusion criteria included patients with general diseases that might affect bone quality and quantity, pathologic lesions, or craniofacial deformities in the maxillary and palatal areas. The institutional review board of The Catholic University of Korea reviewed and approved the study. Informed consents were obtained from all patients or their parents or guardians.
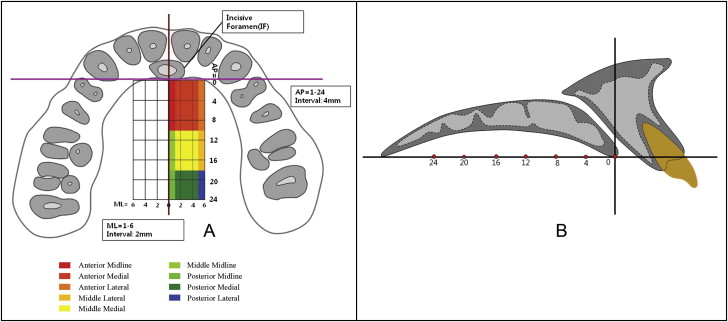
InVivoDental5.0 (Anatomage, San Jose, Calif), a volumetric imaging software, was used to measure bone thickness (window width, 5000 HU; window level, 1500 HU). The palatal bone thickness was measured at 0, 2, 4, and 6 mm lateral to the midpalatal suture on the coronal plane and from 0 to 24 mm at 4-mm intervals posterior to the level of the posterior margin of the incisive foramen on the sagittal plane. The measurements were made at the intersection points of the reference lines over a set of equally sized grids formed by 49 sites covering 288 mm 2 .
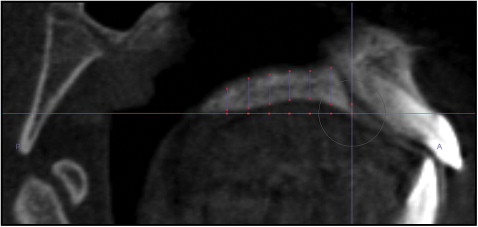
In the sagittal view of InVivoDental5.0, the slice thickness was set to 0.5 mm, and then the image was rotated so that the posterior rim of the incisive foramen and the posterior nasal spine were on the same horizontal plane. Then, the thickness of the palatal bone was measured perpendicular to the horizontal plane at each designated point ( Figs 1 and 2 ).
To test intraexaminer reliability, 5 randomly selected scans from each group were measured 2 weeks later by the same person (T.V.).
Statistical analysis
The data were analyzed by using SPSS (version 16.0.2.1; SPSS, Chicago, Ill). An intraclass correlation coefficient test was performed to assess intraexaminer reliability. Because there were no significant statistical differences between the left and right side measurements, only data from the right side were used for further analysis.
The measured bone thickness values were averaged for the subjects, maintaining their groupings with these 3 designated mediolateral areas: the midline area at the midpalatal suture, the medial area at the reference lines 2 and 4 mm lateral to the midpalatal suture, and the lateral area at the line 6 mm lateral to the midpalatal suture.
Likewise, there were 3 anteroposterior areas: the anterior area at lines 0, 4, and 8 mm; the middle area at lines 12 and 16 mm; and the posterior area at 20 and 24 mm posterior to the incisive foramen. Repeated measures analysis of variance was used to test for differences in bone thickness. Between-subjects factors were sex and the 3 groups. Within-subjects variables were the 3 mediolateral areas and the 3 anteroposterior areas. Statistical significance was determined at P <0.05.
Results
The results of the intraclass correlation coefficient test showed high reliability between the 2 assessments (>0.8).
The Table shows bone thicknesses at the various palatal areas in the 3 groups. There was significantly lower bone thickness in the early mixed dentition group than in the 2 other groups ( P <0.001). However, no significant differences were found between the late mixed and permanent dentition groups. The sex comparison showed no sexual dimorphism ( P = 0.83).
| Early mixed dentition (EMD) (n = 38) | Late mixed dentition (LMD) (n = 40) | Permanent dentition (PD) (n = 40) | P value ‡ | Pairwise comparison | |||||||||||||||||||
|---|---|---|---|---|---|---|---|---|---|---|---|---|---|---|---|---|---|---|---|---|---|---|---|
| Midline | Medial | Lateral | P value ∗ | Midline | Medial | Lateral | P value ∗ | Midline | Medial | Lateral | P value † | ||||||||||||
| Mean | SE | Mean | SE | Mean | SE | Mean | SE | Mean | SE | Mean | SE | Mean | SE | Mean | SE | Mean | SE | ||||||
| Anterior | 4.44 | 0.15 | 7.02 | 0.41 | 7.42 | 0.35 | <0.001 | 4.87 | 0.14 | 8.87 | 0.37 | 9.52 | 0.32 | <0.001 | 4.66 | 0.14 | 8.83 | 0.37 | 9.24 | 0.32 | <0.001 | 0.007 | EMD vs LMD: 0.006 |
| Middle | 5.40 | 0.25 | 4.08 | 0.23 | 3.21 | 0.24 | 5.93 | 0.22 | 4.48 | 0.21 | 3.44 | 0.22 | 5.50 | 0.22 | 4.36 | 0.21 | 3.76 | 0.22 | EMD vs PD: 0.06 | ||||
| Posterior | 5.62 | 0.28 | 3.76 | 0.24 | 2.27 | 0.19 | 6.50 | 0.26 | 4.47 | 0.22 | 2.65 | 0.17 | 5.91 | 0.25 | 4.00 | 0.21 | 2.45 | 0.17 | LMD vs PD: 1 | ||||
| P value ∗ | <0.001 | <0.001 | <0.001 | ||||||||||||||||||||
∗ Significance of the effect of the anteroposterior position in the early and late mixed and permanent dentition groups.
† significance of the effect of the mediolateral position in the early and late mixed and permanent dentition groups.
Stay updated, free dental videos. Join our Telegram channel
VIDEdental - Online dental courses


