Introduction
The aim of the study was to compare the reliability and accuracy of 3 commercially available digital imaging and communications in medicine (DICOM) viewers for measuring upper airway volumes.
Methods
Thirty cone-beam computed tomography scans were randomly selected, and the upper airway volumes were calculated for both oropharynx and nasal passage. Dolphin3D (version 11, Dolphin Imaging & Management Solutions, Chatsworth, Calif), InVivoDental (version 4.0.70, Anatomage, San Jose, Calif), and OnDemand3D (version 1.0.1.8407, CyberMed, Seoul, Korea) were compared with a previously tested manual segmentation program called OrthoSegment (OS) (developed at the Department of Orthodontics at Case Western Reserve University, Cleveland, Ohio). The measurements were repeated after 2 weeks, and the intraclass correlation coefficient was used for the reliability tests. All commercially available programs were compared with the OS program by using regression analysis. The Pearson correlation was used to evaluate the correlation between the OS and the automatic segmentation programs.
Results
The reliability was high for all programs. The highest correlation found was between the OS and Dolphin3D for the oropharynx, and between the OS and InVivoDental for nasal passage volume. A high correlation was found for all programs, but the results also showed statistically significant differences compared with the OS program. The programs also had inconsistencies among themselves.
Conclusions
The 3 commercially available DICOM viewers are highly reliable in their airway volume calculations and showed high correlation of results but poor accuracy, suggesting systematic errors.
The upper airway has long been an area of interest in orthodontics, with topics such as the relationships between facial type and airway, airway shape and volume with growth and development, and the clinician’s potential to modify the airway. However, most studies evaluating the airway have been conducted with 2-dimensional (2D) cephalograms, providing limited data such as linear and angular measurements, for a complex 3-dimensional (3D) structure.
With the introduction of cone-beam computed tomography (CBCT), the 3D diagnosis of the patient became more accessible in dentistry. CBCT has become a well-accepted oral and maxillofacial diagnostic imaging technique in a short time, and this was mainly due to lower radiation exposure and shorter scan acquisition times necessary to obtain an acceptable image compared with conventional computed tomography scans. CBCT technology allows the segmentation and visualization of hollow structures such as the airway in 3 dimensions. Thus, with 3D imaging, we are moving from lengths and angles toward volumes and surface areas. To visualize a CBCT scan, digital imaging and communications in medicine (DICOM) viewer software is necessary. DICOM is the accepted file format for a medical image, and a DICOM viewer allows viewing, measuring, segmenting, and complete analysis of a CBCT scan.
To segment and structure the airway means to delineate and remove all other surrounding structures for a clearer analysis and visualization. The segmentation of the airway can be done either manually or automatically. Manual segmentation requires the operator to delineate the airway slice by slice and then render all data into a 3D volume for analysis. Automatic segmentation can be done by differentiating structures with different density values. This means that, because the airway is radiolucent, the density values for the airway are lower than the values for the surrounding soft tissues, allowing easy and automatic differentiation. The density values are called Hounsfield units (HU). Automatic segmentation of the airway is significantly faster and more practical than manual segmentation, but the reliability and the accuracy of the method with commercially available programs have never been tested.
The aim of this study was to compare the reliability and accuracy of 3 commercially available DICOM viewers for measuring upper airway volume. Upper airway volume was divided into oropharynx (OP) and nasal passage (NP) for this study.
Material and methods
Our experimental protocol was approved by the Case Western Reserve University institutional review board, and all records used in this study were obtained from the patient data base of the Department of Orthodontics. All CBCT images were acquired with a Hitachi CB Mercuray Scanner (Hitachi Medical Systems America, Twinsburg, Ohio) as a routine part of the initial diagnostic records for orthodontic patients. All images were preexisting and taken by using 2mA, 120kVp, and 12-in field of view (F mode) setting. Each patient’s image data consisted of 512 slices, with a slice thickness of 0.377mm, a resolution of 1024 × 1024 pixels, and 12 bits per pixel (4096 gray scale). Scans in which the defined airway was not clear or fully contained in theimage and images containing artifacts were excluded. Each patient signed a consent form allowing the use of orthodontic records for research purposes.
The study sample consisted of 30 randomly selected patients. All DICOM files were loaded to a computer with a Xeon (Intel, Santa Clara, Calif) processor, running Windows XP Professional (Microsoft, Redmond, Wash) operating system. For the commercially available DICOM viewers, the programs tested were Dolphin3D (version 11, Dolphin Imaging & Management Solutions, Chatsworth, Calif), InVivoDental (version 4.0.70, Anatomage, San Jose, Calif), and OnDemand3D (version 1.0.1.8407, CyberMed, Seoul, Korea). Dolphin3D (D3D), InVivoDental (IVD), OnDemand3D (OD3D), and a custom-written program with Visual C++ (Microsoft) for the Department of Orthodontics, School of Dental Medicine, at Case Western Reserve University called OrthoSegment (OS) were used to render the NP and OP airway volumes separately.
Amirlak et al used the OS program to test the reliability and accuracy of CBCT images. They used a water displacement technique for comparing the CBCT volumes with actual volumes and found that the manually segmented volumes of the OS program were highly accurate. Based on their results, we used the values from the OS program as the gold standard to which the other results were compared.
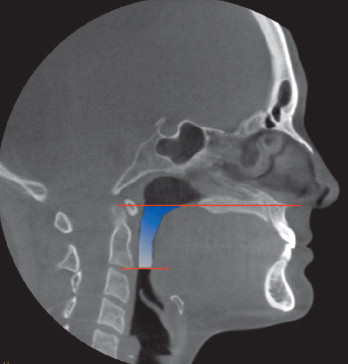
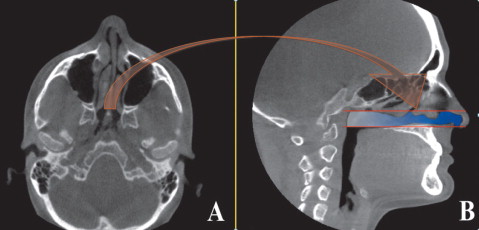
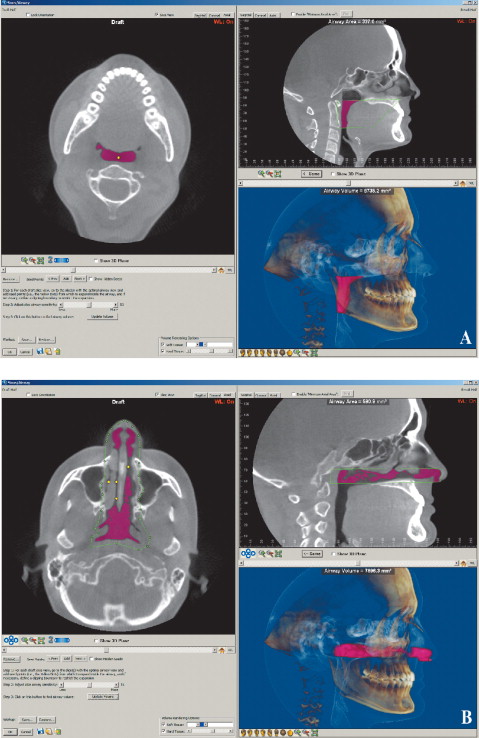
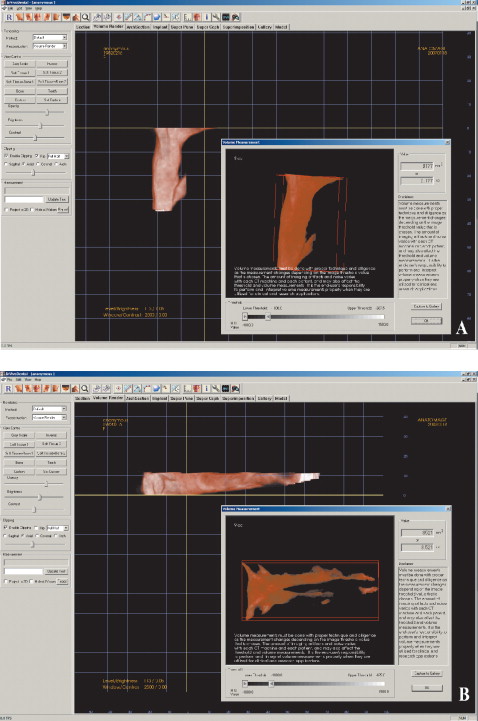
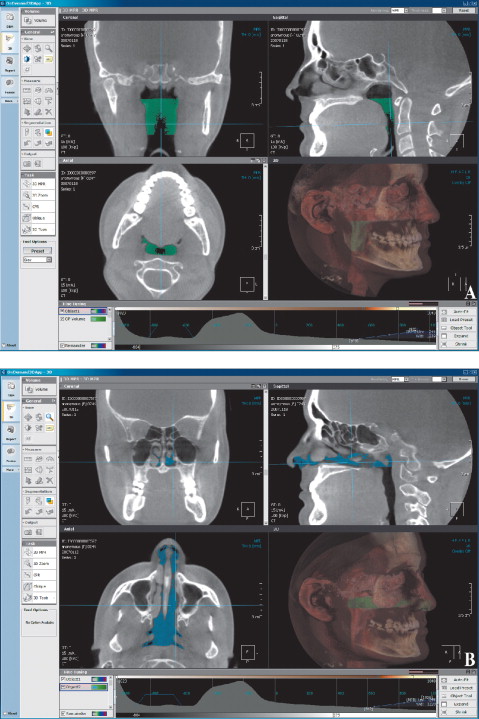
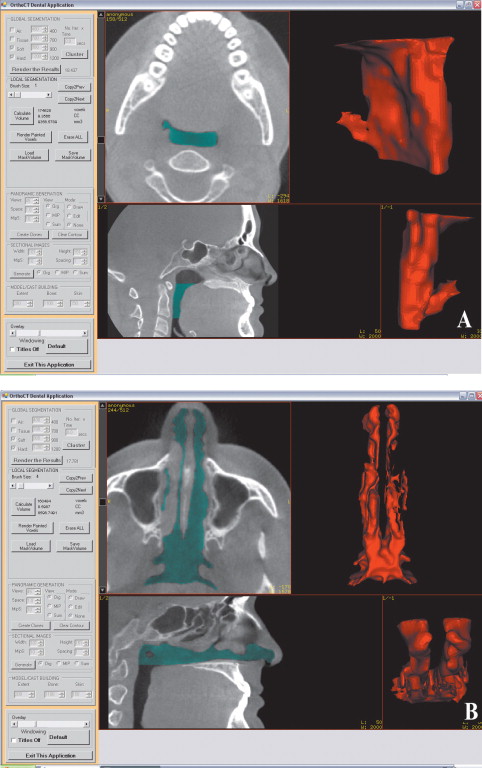
For the OP volume, the superior and inferior limits were slightly modified from the limits used by Ogawaetal. OP volume was defined as the volume of the pharynx between the palatal plane (ANS-PNS) extending to the posterior wall of the pharynx and the plane parallel to the palatal plane that passes from the most anteroinferior point of the second cervical vertebrae ( Fig 1 ). The inferior limit of the NP airway was defined as the superior limit of the OP airway, and the superior limit was defined as the last slice before the nasal septum fused with the posterior wall of the pharynx. So, the superior border of the NP was defined on the axial slice first and then it was reflected to the sagittal plane ( Fig 2 ). The described airway volumes were rendered with the D3D, IVD, and OD3D programs, according to their manufacturers’ recommendations ( Figs 3–5 ). In the OS program, first, the limits of the airway were defined on the midsagittal slice on the sagittal view, and then the airway was painted slice by slice on the axial images. After we painted all slices between the defined limits, we rechecked the image for any inconsistencies from the coronal and sagittal aspects. Finally, the painted images were rendered, and a 3D volume was obtained ( Fig 6 ).
All data were collected and volume renderings performed by 1 operator (H.E.). The renderingsweremade separately for the NP and OP volumes. For reliability purposes, the images were remeasured 2weeks after the first measurements. A total of 480 volume renderings were made, and all data were imported and organized by using Excel (Microsoft). Separate spreadsheets were used for the first and second measurements in order to be blinded from the previous results. SPSS software (version 17.0, SPSS, Chicago, Ill) was used for statistical analysis.
In order to check the reliability of the first and second measurements, intraclass correlation coefficient (ICC) values were used. Differences between the programs were tested by using linear regression with the OS value as the constant, considering a significance of P <0.05. To evaluate the correlation between the manual and automatic segmentation programs, the Pearson correlation coefficient was used.
Results
The descriptive characteristics and intraclass correlation coefficients of the study population are given in Table I . The reliability was high for all programs ( Table I ). The mean OP airway volumes were consistently larger than the NP airway volumes. The means of the first and second measurements were highest for the D3D program for both OP and NP airways (7444.37 ± 3250.08 and 6617.50 ± 2696.69 mm 3 , respectively). The means of the first and second measurements for the OP and NP airway volumes were lowest for the OD3D program (4603.06 ± 1741.03 and 3959.49 ± 1878.57 mm 3 , respectively). The lowest mean difference between the first and second measurements for OP airway volume was found with the IVD program (8.77mm 3 ), and the highest was for the OD3D program(97.2 mm 3 ). The lowest mean difference between the first and second measurements for the NP airway volume was found with the OD3D (70.26 mm 3 ), and the highest was found with the D3D program (515.78 mm 3 ). NP airway volume differences were generally larger compared with the OP airway volume differences.
| OrthoSegment | Dolphin3D | InVivoDental | OnDemand3D | |||||
|---|---|---|---|---|---|---|---|---|
| Mean | SD | Mean | SD | Mean | SD | Mean | SD | |
| OP airway (n = 30) | ||||||||
| Measurement 1 (mm 3 ) | 6801.85 | 2914.02 | 7411.23 | 3313.30 | 6249.07 | 2634.88 | 4651.66 | 1738.51 |
| Measurement 2 (mm 3 ) | 6730.76 | 3055.17 | 7477.50 | 3197.68 | 6240.30 | 2648.00 | 4554.46 | 1751.90 |
| Mean (mm 3 ) (both measurements) | 6766.31 | 2980.83 | 7444.37 | 3250.08 | 6244.69 | 2631.50 | 4603.06 | 1741.03 |
| Mean difference (mm 3 ) (both measurements) | 71.09 | 66.28 | 8.77 | 97.2 | ||||
| ICC | 0.99 | 0.99 | 0.99 | 0.99 | ||||
| NP airway (n = 30) | ||||||||
| Measurement 1 (mm 3 ) | 5919.84 | 2714.45 | 6359.61 | 2852.17 | 4959.20 | 2300.21 | 3994.62 | 1905.19 |
| Measurement 2 (mm 3 ) | 5569.06 | 2619.94 | 6875.39 | 2606.33 | 4888.17 | 2282.28 | 3924.36 | 1888.00 |
| Mean (mm 3 ) (both measurements) | 5744.45 | 2654.50 | 6617.50 | 2696.69 | 4923.69 | 2272.86 | 3959.49 | 1878.57 |
| Mean difference (mm 3 ) (both measurements) | 350.78 | 515.78 | 71.03 | 70.26 | ||||
| ICC | 0.98 | 0.88 | 0.97 | 0.89 | ||||
Stay updated, free dental videos. Join our Telegram channel
VIDEdental - Online dental courses


