Introduction
The orthodontic load system, especially ideal moment-to-force ratios, is the commonly used design parameter of segmental T-loops for canine retraction. However, the load system, including moment-to-force ratios, can be affected by the changes in canine angulations and interbracket distances. We hypothesized that clinical changes in canine position and angulation during canine retraction will significantly affect the load system delivered to the tooth.
Methods
The load systems of 2 T-loop groups, one for translation and the other for controlled tipping, from 9 bilateral canine retraction patients were made to the targeted values obtained from finite element analyses and validated. Each loop was tested on the corresponding maxillary dental cast obtained in the clinic. The casts were made before and after each treatment interval so that both initial and residual load systems could be obtained. The pretreatment and posttreatment interbracket distances were recorded for calculating interbracket distance changes.
Results
As the interbracket distances decreased, the average retraction-force drop per interbracket distance reduction was 36 cN/mm, a 30% drop per 1 mm of interbracket distance decrease. The average antitipping-moment drops per interbracket distance reductions were 0.02 N-mm per millimeter for controlled tipping and 1.4 N-mm per millimeter for translation, about 0.6% and 17% drops per 1 mm of interbracket decrease, respectively. Consequently, the average moment-to-force ratio increases per 1 mm of interbracket distance reduction were 1.24 mm per millimeter for controlled tipping and 6.34 mm per millimeter for translation. There was a significant residual load, which could continue to move the tooth if the patient missed the next-scheduled appointment.
Conclusions
Clinical changes in canine position and angulation during canine retraction significantly affect the load system. The initial planned moment-to-force ratio needs to be lower to reach the expected average ideal value. Patients should be required to follow the office visit schedule closely to prevent negative effects because of significant moment-to-force ratios increases with time.
Segmental T-loops are used in maxillary canine retraction. The resulting orthodontic load (force and moment) system on the canine is affected by multiple factors, including changes in interbracket distance and tooth angulations. However, the changes in the clinical load system that occur simultaneously with canine movement have not been quantified. Different load systems, especially small differences in moment-to-force ratios (M/F), result in different tooth movement patterns: tipping or translation. It is important to quantify the load changes for predicting the treatment effects and preventing potential side effects. We hypothesized that clinical changes in canine position and angulation during canine retraction will significantly affect the load system delivered to the tooth.
An orthodontic load system is 3 dimensional (3D) and consists of 3 force and 3 moment components. It is difficult to measure the entire 3D orthodontic load system clinically. Therefore, it has been investigated primarily in laboratory settings by using archwires placed on dental casts ; numeric estimations, such as the Loop simulation software (dHAL Software, Kifissia, Greece) ; or the finite element method. Viecilli simulated the effect of changes of the canine position and angulation on the M/F. The study was 2-dimensional and based on ideal rotation. Despite the clinically applicable information acquired, these studies were mostly conducted on ideal dentures, and the changes of the load systems of individual patients during tooth movement have not been considered.
To better understand how the load system affects tooth movement clinically, the load components and their changes during clinical treatment need to be quantified. The objectives of this study were to monitor the clinical load systems on the canines undergoing retraction and to quantify the effects of the movement pattern on the load components.
Material and methods
Customized segmental T-loops were designed and fabricated to retract the canines with tipping or translation. Measurements of force and moment components, and the M/F, were made by using models obtained from the patient at different times, with a custom-made orthodontic force tester. Interbracket distances and the initial and residual load components before and after canine retraction were quantified to investigate changes of the load system during canine retraction.
After approval by the institutional review board of Indiana University, 9 patients consented for this study. The inclusion criteria were (1) need for extraction of both maxillary first premolars and (2) a possible indication for maxillary canine retraction during treatment. The average age of these patients was about 21 years (range, 14-47 years). The maxillary first premolars were extracted, and the maxillary dental arch including the second molars was bracketed, leveled, and aligned with sequential archwires. Before canine retraction, a 0.019 × 0.025-in stainless steel archwire was fully engaged in brackets with 0.022 × 0.028-in slots. The maxillary second premolar, first molar, and second molar were coligated with a 0.010-in stainless steel wire, connected with a transpalatal arch to establish a posterior unit.
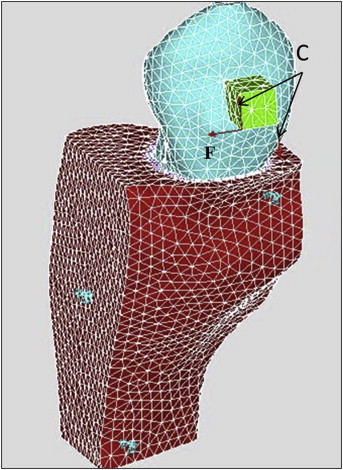
For each patient, the right and left canines were randomly assigned to receive controlled tipping or translation orthodontic tooth movements. To accomplish controlled tipping or translation, 2 segmental T-loops, made of 0.017 × 0.025-in TMA wire (Ormco, Glendora, Calif), were designed and fabricated to deliver different M/F to retract the canines. The T-loops on both sides were designed to deliver 124 cN of retraction force. The desired M/F for controlled tipping and translation were calculated by using finite element models of the patients, constructed based on cone-beam computed tomography. The maxillary image was taken before the canine retraction using an i-CAT device (Imaging Sciences International, Hatfield, Pa) at the resolution of 0.25-mm voxel size with a scanning time of 27 seconds. For each patient, the raw image data of the cone-beam computed tomography scan were processed using MIMICS software (Materialise, Leuven, Belgium) to create a reconstructed digital model of the teeth, periodontal ligament, and maxillary bone complex. A finite element model was created from the digital model and then imported into ANSYS software (Canonsburg, Pa) to compute the tooth displacement from an orthodontic load. The load consisted of the retraction force and a couple (moment), which were applied at the bracket ( Fig 1 ). The resulting tooth displacement pattern was calculated. The moment was then incrementally increased. The moment and force pairs that create translation and controlled tipping were identified. The details of the modeling were reported previously. M x /F y was used to control the distal tipping. The average desired amounts of M x /F y of the 9 patients were 7.7 mm for controlled tipping and 10.4 mm for translation.
The interbracket distance was defined as the distance from the mesial aspect of the auxiliary tube of the first molar bracket to the distal aspect of the canine bracket. This was expected to decrease during canine retraction; with it, there would be more decrease in force than moment, resulting in an increase of the M/F. For this reason, measures for initial M/F adjustment needed to be conducted. The M/F increase in the retraction plane per 1 mm of interbracket distance reduction was estimated using the Loop simulation software. An approximately 50% increase in the M/F was estimated per 1 mm of interbracket distance reduction from this analysis. In this study, each treatment period was defined as when a canine was retracted more than 1 mm, measured during each office visit. The interbracket distance changes were expected to vary significantly because of variations in treatment time periods caused by scheduling-related issues. Thus, the total increase of M/F could only be estimated; it was set at 70%. To be consistent, the calculated M/F for translation was decreased by approximately 35% (half of the estimated total M/F increase) to ensure that the average M/F during the treatment period was close to the ideal value. The M/F for tipping was further discounted to enhance the tipping effects. In addition, to prevent mesial out rotation caused by the retraction force, the desired antirotation moment for translating the tooth was also calculated with the same finite element model. M z /F y was used to control the tooth rotation. To ensure that the average M z /F y was close to the desired value, the implemented initial M z /F y was reduced by approximately 35% on both canines to compensate for the effects of interbracket distance reduction. However, the target M z /F y was difficult to achieve because it was primarily realized by adjusting the first-order gable angles. Large gable angles were required in many patients; they caused the T-loop to interfere with the cheek or gum. To prevent interference, only smaller gable angles could be used; they caused M z to be lower than the target value. The main focus of this study was on translation and tipping. Control of M z was considered secondary and thus was allowed to be compromised in some subjects. Other load components were kept minimal when the T-loops were produced.
According to the desired load system, the T-loops were bent to express the desired force and moment components. These components were calibrated experimentally on the corresponding dental casts. The casts were prepared using the following protocol. Over the period of canine retraction, the patients were seen every 5 to 6 weeks. A decision was made on whether a treatment interval was completed. A treatment interval was defined when 1 canine moved more than 1 mm. Thus, multiple intervals might occur for each patient because all patients in this study had more than 3 mm of space between the canine and the second premolar. However, the number of intervals varied among the patients because of the differences in tooth movement rates and durations between office visits. When an interval was completed, an impression was made, the T-loop was retrieved, and a new T-loop was designed and applied. Then the next treatment interval began. The casts were made before and after each interval. At the beginning of each treatment interval, each T-loop was adjusted on the corresponding duplicate acrylic model attached to a custom-made orthodontic force tester to ensure delivering accurate loads. An impression of the maxillary dental arch was made by injecting light and medium polyvinylsiloxane material (Examix NDS; GC, Tokyo, Japan) over the brackets, followed by an alginate impression. Duplicate canine and first molar brackets with tubes (Burstone; Ormco) were placed in the polyvinylsiloxane, and autopolymerizing acrylics (Repair Material; Dentsply, York, Pa) were packed into the impression and allowed to cure. The acrylic model was attached to the orthodontic force tester with 2 screws. The target teeth (canines) were attached to the load cells with epoxy adhesive (Loctite E-120HP Hysol; Henkel, Rocky Hill, Conn) and then were completely separated from the acrylic model, thus maintaining their original positions and orientations ( Fig 2 ).
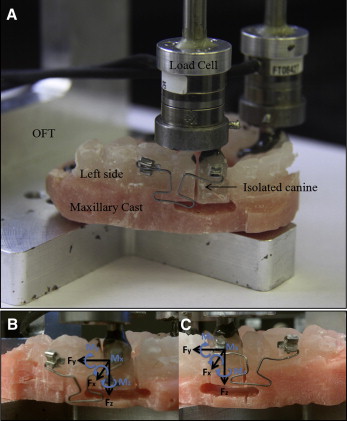
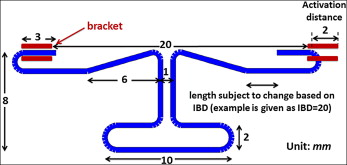
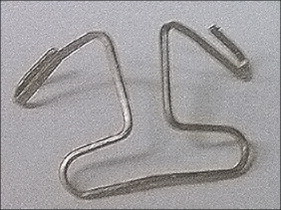
After we measured the initial interbracket distances between the canine and molar tubes of the acrylic model, we made a T-loop with the geometry shown in Figure 3 . The size, shape, leg length, and dimensions of the T-loops were determined by considering their effects on the load system, as well as preventing interferences with the cheek and gum. The first-order and second-order gable bends were added symmetrically to the T-loops to bring the load components to the targets ( Fig 4 ). The loop bending and adjustment process was iterated until the desired force and moments were accurately expressed. The horizontal leg was bent on each end of the T-loop to allow easy insertion into the tube. The method also ensured that the interbracket distance was identical when transferred the orthodontic force tester validated T-loop to the patient ( Fig 5 ). The validation was performed on the orthodontic force tester. T-loops were installed on the duplicate acrylic model attached to the orthodontic force tester for testing force and moment components. The orthodontic force tester was designed to measure the orthodontic load system at the canine bracket ( Fig 2 , A ). Two load cells (Multiaxis force/torque Nano17; ATI Industrial Automation, Apex, NC) were used to measure the 6 force and moment components applied at the canine brackets. The force range of each load cell was 0 to 20 N, with a 0.025-N resolution, and the moment range was 0 to 100 N-mm with a 0.003 N-mm resolution. A local coordinate system was established on each left canine with the retraction direction aligned with the load cell’s positive y-axis, the buccal direction with the positive x-axis, and the gingival direction with the positive z-axis ( Fig 2 , B ). The local coordinate system on the right canine was different from that of the left canine ( Fig 2 , A and B ). In this study, the clinically expressed load systems were of interest, and the side was not a controlled parameter because tipping or translation was randomly assigned to each side. Thus, the clinically used coordinate system on the left side was used to describe the results.
For each treatment interval, an acrylic model was fabricated after each treatment period, and a new T-loop was bent for each canine and adjusted using the orthodontic force tester. The posttreatment interbracket distances were also recorded. The T-loops used in the previous treatment were retrieved and installed on the posttreatment acrylic model to measure the residual load system with the orthodontic force tester. The T-loops retrieved were examined visually for signs of permanent deformation or other damage from removal. Damaged T-loops were excluded from this study. Consequently, both initial and residual load systems were recorded.
Statistical analysis
Linear regressions were performed on the retraction force, F y , drop, antitipping moment, M x , drop, and M x /F y increase with respect to interbracket distance changes. The initial and residual load systems were compared using paired t tests. The force and moment drops between the controlled tipping and translation groups were compared using a t test. Significance was tested at the 95% confidence level.
To assess the errors from wire installation and instrument, a cast and a T-loop were used for a repeatability test. The same T-loop was installed on the same cast 10 times. The resulting load system corresponding to each installation was measured. The means and standard deviations were calculated.
Results
The installation and instrument errors of the 6 load components are shown in Table I . The maximum standard deviations for the key load components, F y , M x , and M z , were only 1%, 1%, and 3%, respectively, meaning that the measurements were consistent.
| Test | F x (N) | F y (N) | F z (N) | T x (N-mm) | T y (N-mm) | T z (N-mm) |
|---|---|---|---|---|---|---|
| 1 | −0.28 | 1.16 | 0.21 | −6.95 | −3.32 | −5.10 |
| 2 | −0.29 | 1.18 | 0.23 | −6.93 | −3.29 | −4.88 |
| 3 | −0.29 | 1.19 | 0.25 | −6.81 | −3.22 | −4.77 |
| 4 | −0.30 | 1.17 | 0.26 | −6.70 | −3.54 | −4.63 |
| 5 | −0.29 | 1.17 | 0.25 | −6.80 | −3.49 | −4.67 |
| 6 | −0.30 | 1.14 | 0.23 | −6.92 | −3.56 | −4.64 |
| 7 | −0.28 | 1.17 | 0.23 | −6.86 | −3.23 | −4.90 |
| 8 | −0.28 | 1.17 | 0.25 | −6.70 | −3.47 | −4.70 |
| 9 | −0.29 | 1.15 | 0.25 | −6.78 | −3.47 | −4.71 |
| 10 | −0.28 | 1.17 | 0.26 | −6.66 | −3.41 | −4.74 |
| Mean | −0.29 | 1.17 | 0.24 | −6.81 | −3.40 | −4.77 |
| SD | 0.01 | 0.01 | 0.02 | 0.10 | 0.12 | 0.15 |
Only 9 T-loops on the controlled tipping side and 11 on the translation side passed the visual inspections. The initial interbracket distances in this study ranged from 16.4 to 24.4 mm because of interpersonal difference or variations in incremental tooth displacement. The interbracket distance decrease in each treatment interval ranged from 0.3 to 1.9 mm (average, 1.23 mm). Despite the 1-mm canine movement criterion for the treatment interval, there were intervals with greater canine movements, causing larger interbracket distance decreases. The larger decrease was primarily due to prolonged treatment intervals caused by missed appointments. The initial and residual load systems were measured ( Table II ). The load systems on both sides were expressed using the same convention. The positive y-axis corresponded to the retraction (distal) direction, the positive x-axis represented the buccal direction, and the positive z-axis corresponded to the gingival direction. The positive M x tips the crown distally, the positive M y tips the crown lingually, and the positive M z rotates the crown distal in. Thus, negative M x is the antitipping moment. The initial retraction force, F y , was 124.4 ± 3.3 cN. On the retraction plane, the initial antitipping moments, M x , were −780 ± 0.8 cN-mm for translation and −340 ± 1.1 cN-mm for controlled tipping. Consequently, the initial M x /F y amounts were −6.3 ± 0.8 mm for translation and −2.8 ± 0.9 mm for controlled tipping after we implemented the M/F discounts described previously. The M z /F y was not reported because M z was compromised to prevent interference with the cheek and gum.


