Introduction
Initial cleft severity in patients with complete unilateral cleft lip and palate (UCLP) varies. This is reflected in the sizes of the cleft and the palate. The purpose of this retrospective study was to establish whether there is a relationship between cleft severity at birth and growth of the maxilla.
Methods
Maxillary dental casts of 29 infants with nonsyndromic complete UCLP were used to measure the sizes of the cleft and the palate. The later growth of the maxilla was determined by using cephalometric radiographs taken at age 9. Statistical analyses were performed with multiple linear regression.
Results
The results showed a relationship between cleft area and maxillary protrusion (SNA, P <0.05). Also, there was a relationship between palate area and maxillary width ( P <0.05).
Conclusions
These data suggest that in patients with complete UCLP there is a significant relationship between initial cleft severity and maxillary growth. Patients with a small cleft area have a more protruded maxilla than do those with a large cleft area. Patients with a large palate area have a wider maxilla than those with a small palate area.
Midface retrusion has always been a concern in patients with operated unilateral cleft lip and palate (UCLP). Two factors have been proposed for the growth deficiency : (1) the intrinsic factor, such as a developmental deficiency leading to the formation of a cleft and the growth potential of the midfacial skeleton; and (2) the iatrogenic factor, introduced via treatments, mainly from surgical repair. Several studies by clinical observations of unoperated subjects with UCLP and infants with UCLP before primary surgery all strongly suggest that surgical repair of the lip and palate is responsible for most of the midfacial growth attenuation noted.
Although some studies have addressed the influences of surgical procedures, no consensus regarding the best technique or timing has been reached. However, comparison of various cleft subtypes showed different degrees of midface deficiency; the deficiency is greater in complete UCLP than incomplete UCLP. This suggests that cleft severity might have an impact on the growth of the maxilla. Cleft severity is usually evaluated from its appearance at birth. However, initial cleft severity can reflect differing contributions of palate and cleft sizes. Evidence suggests that favorable maxillary growth is associated with a large palate. Although 1 group reported that patients with a small cleft have better maxillary growth compared with those with a large cleft, most of the literature suggests that presurgical infant orthopedics to reduce the cleft size has no bearing on later growth of the maxilla. As a result, in this study, the combined sizes of the palate and cleft were assessed to answer whether initial cleft severity has a significant effect on the later growth of the maxilla.
Material and methods
The patients were selected from the growth archive of Chang Gung Craniofacial Center in Taipei, Taiwan. Selection criteria were as follows: Taiwanese patients with nonsyndromic complete UCLP born between 1988 and 1997, treated at the Chang Gung Craniofacial Center; no Simonart’s band; uniform treatment (ie, passive infant palate before lip repair, modified rotation-advancement lip repair at 3 to 6 months of age, and 1-stage, 2-flap palatoplasty about 1 year of age); infant maxillary dental cast; all surgeries by 1 experienced surgeon (P.K.T.C.); no distraction osteogenesis or orthognathic surgery before cephalometric assessment; and cephalometric assessment about 9 years of age. A total of 29 patients met the selection criteria and were included in this retrospective study.
The infant maxillary dental casts were obtained from alginate impressions for fabrication of passive infant plates. The maxillary dental casts were used to define the cleft severity. The dental cast variables were classified into 2 categories: cleft size and palate size.
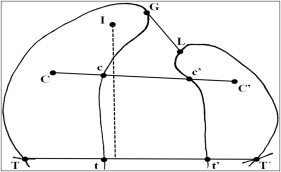
The maxillary dental casts were used to directly measure the following with digital calipers by 1 investigator (Y.T.C.) ( Fig 1 ): anterior cleft width, middle cleft width, posterior cleft width, and palate length.
One month later, the landmark localizations and measurements were repeated under the same conditions by the same investigator. The average values for each patient were calculated from the duplicate measurements.
There was no need to duplicate the maxillary dental casts because the scanning procedure was noninvasive. The maxillary dental casts were scanned in the plane coronal to the palate surface by using a spiral computed tomography (CT) scanner in our Department of Radiology. The 29 dental casts were scanned simultaneously. Thin 1-mm slices were obtained. The imaging data were then transferred to a computer workstation in our Craniofacial Imaging Laboratory. The raw data were reformatted with each voxel (a unit of 3-dimensional [3D] data) being 0.6 × 0.6 × 0.6 mm 3 . The 16-bit digital data were changed into 8-bit for convenient data management. The reformatted CT data were used to reconstruct 3D images for measurement. The CT image data processing, 3D display, manipulation, landmark identification, object definition, and measurements were done by1 investigator (Y.T.C.) using the Analyze program (Biomedical Imaging Resource, Mayo Foundation, Rochester, Minn). Accuracy of the computer system in our Craniofacial Imaging Laboratory was validated in a previous phantom study.
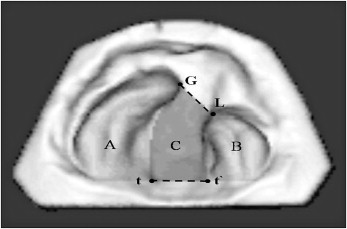
Delineation of the palatal and cleft boundary was facilitated by magnifying and rotating the 3D image, assisted by simultaneous inspection of the dental casts. The palate was divided into greater and lesser segments. The boundary of the palate was the deepest at the vestibular sulcus and the medial edge of each segment. The posterior boundary of the palate was defined as a line connecting the bilateral tuberosities. The boundary of the cleft was the medial edge of each segment. The anterior boundary of the cleft was defined as a line connecting the anterior ends of the bilateral alveolar crests. The posterior boundary of the cleft was defined as a line connecting the bilateral tuberosities. Once the palate and cleft were defined, the cleft and palate areas were measured ( Fig 2 ).
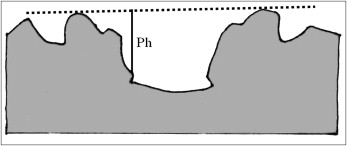
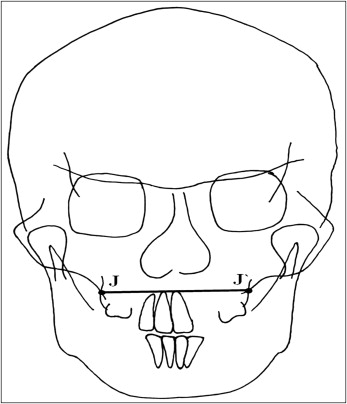
The tasks of landmark identification, object definition, and area measurements were performed twice at least 1 week apart by the same investigator. The average value of the 2 measurements was calculated. In addition, palate height, a linear distance, was measured ( Fig 3 ).
Cephalometric radiographs were obtained about 9 years of age for each patient. Each cephalometric radiograph was taken on the same cephalostat according to standardized cephalometric guidelines with natural head position and with teeth in centric occlusion. The magnification ratio at the midsagittal plane was 11%.
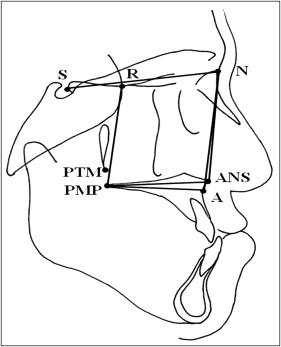
The radiographs were traced by 1 investigator (Y.T.C.) and verified by a senior orthodontist (Y.F.L.) blinded to the patient’s cast measurements. The cephalometric maxillary variables were classified into 4 categories: length, height, width, and protrusion ( Figs 4 and 5 ).
The error of the method was calculated by duplicate tracings, marking of landmarks, and measurement of 10 randomly selected cephalometric radiographs at least 1 month later by the same investigator. The error of the method, s(i), was calculated by using Dahlberg’s formula,
s(i)=Σd2/2n−−−−−−−√
s(i) = Σ d 2 / 2 n
where d is the difference between 2 duplicate measurements and n is the number of pairs of measurements (n = 10). The means of s(i) were 0.5 mm (SD, 0.1 mm; range, 0.4-0.6 mm) for linear variables and 0.8° (SD, 0.07°, range, 0.8°-0.9°) for angular variables.
Statistical analysis
Descriptive statistics were expressed as means and standard deviations for metric variables and as frequencies and percentages for nominal variables. The inferential analyses aimed to evaluate the independent effect of cleft severity on the maxillary growth variables. Therefore, multiple linear regression analyses with SPSS software (version 12.0, SPSS, Chicago, Ill) were performed. First, the clinical and dental-cast variables were submitted for bivariate analyses. The clinical variables included sex, surgeon’s experience, patient year of birth (between 1988 and 1994 vs between 1995 and 1997), age at cast, secondary alveolar bone grafting (yes vs no), and age at cephalometric assessment. When a significant effect was found ( P <0.1), the variables were then incorporated in the final model.
The results are presented as regression coefficients with standard errors. Each regression coefficient for a cleft severity variable was the change in the mean (millimeters or degrees) of the dependent variable per unit of increase in the cleft severity variable (millimeters or square centimeters). P values were 2 sided and considered to be significant if less than 0.05.
Stay updated, free dental videos. Join our Telegram channel
VIDEdental - Online dental courses


