Introduction
This study evaluates the changes in the force system of the beta-titanium T-loop spring (TLS) caused by stress relaxation.
Methods
Ninety TLSs with dimensions of 6 × 10 mm, made of 0.017 × 0.025-in beta-titanium alloy and preactivated by concentrated bends, were randomly distributed into 9 groups according to the time point of evaluation. Group 1 was tested immediately after spring preactivation and stress relief by trial activation. The other 8 groups were tested after 24, 48, and 72 hours, and 1, 2, 4, 8, and 12 weeks. By using a moment transducer coupled to a digital extensometer indicator adapted to a universal testing machine, the amounts of horizontal forces and moments and the moment-to-force ratios were recorded at every 0.5 mm of deactivation from 5 mm of the initial activation in an interbracket distance of 23 mm.
Results
The horizontal forces and moments were higher ( P <0.001) for group 1 compared with the other 8 groups, which were not different among themselves. All groups produced similar moment-to-force ratios ( P = 0.600), with no influence of time.
Conclusions
The TLSs preactivated by concentrated bends had progressive load decreases over time, and this effect is critical in the first 24 hours.
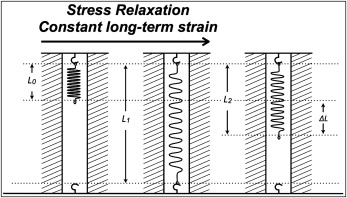
Plastic deformation occurs if the stress exceeds the yield point. What is often overlooked is that plastic deformation can also depend on time. Stress-related plastic deformation is referred to as slip , and time-related deformation is called creep . From a microscopic perspective, creep in highly stressed metals is the result of progressive movement of dislocations in the crystalline structure of the material. This microscopic phenomenon can be observed experimentally as an increase in strain associated with constant stress (creep) or a decrease in stress associated with constant strain (stress relaxation) ( Fig 1 ). Creep depends on stress intensity and temperature, because high stresses and temperatures favor the movement of dislocations. In most engineering applications, creep in metals becomes a concern only at temperatures at least 30% of the melting point of the material, because structural components are typically not subjected to high stresses during shaping for a specific application.
In orthodontics, straight wires are generally used to construct an appliance. Occasionally, bends or loops are placed in orthodontic archwires to facilitate particular tooth movements. These bends concentrate stress and can cause spacing and unstable dislocations in the crystalline structure at the high-stress points. Orthodontists have tried to overcome this problem with heat treatments in orthodontic appliances made of stainless steel to promote rearrangement of the crystalline structure by relieving residual stresses. Another strategy often used is to take advantage of the Bauschinger effect. This consists of overbending the wire and performing several trial activations until the wire assumes the desired shape for the application of the force system. This is important for alloys that are not sensitive to heat treatment, such as beta-titanium (β-Ti).
The β-Ti alloy has a moderate spring-back, somewhere between stainless steel and nickel-titanium alloy, and, when used in loops, it might require some stress relief before it can be effectively used. The β-Ti T-loop spring (TLS), has been used since the 1980s for space closure, mainly in patients having premolar extractions. Templates and other methods of preactivation have been developed to deliver specific forces and enough moment-to-force (MF) ratios, allowing different types of tooth movements. β-Ti TLS stress relief can be done by simulating its activation before placement in the patient’s mouth, thereby producing forces in the wire that are suitable for tooth movement.
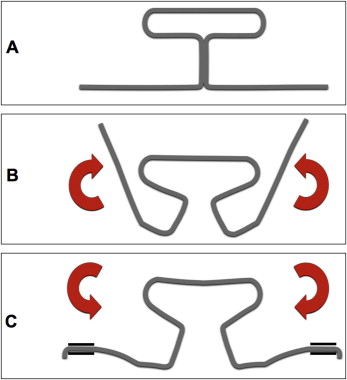
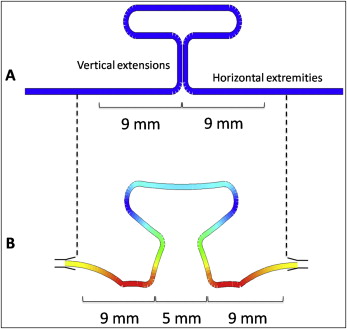
After this, the β-Ti TLS (or any other loop) is loaded in the opposite direction to its preactivation ( Fig 2 ). This subjects the alloy to a constant deformation, which could cause progressive force reduction. This time-dependent effect has been thoroughly studied in the alloys used in orthodontics ; however, it has been superficially evaluated for β-Ti, and there are no studies in the literature on this effect with more elaborate geometries, such as in loops.
Change in the original shape of a loop might prove that contemporary preactivations are not ideal, requiring some adjustments. Thus, the aim of this study was to evaluate the load decay on the force system of TLSs preactivated by concentrated bends over time.
Material and methods
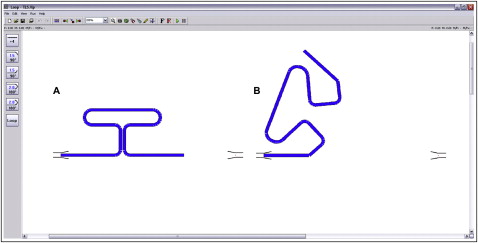
Ninety TLSs were hand-bent by an author (S.G.F.R.C.) using Marcotte pliers (Hu-Friedy, Chicago, Ill) of 0.017 × 0.025-in β-Ti wires (TMA; Ormco, Glendora, Calif), and a custom template ( Fig 3 , A ). The TLSs had dimensions of 6 mm in height by 10 mm in length and were preactivated with concentrated bends ( Fig 3 , B ).
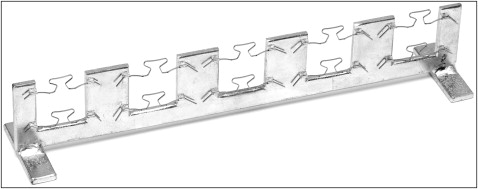
The TLSs were randomly divided into 9 groups according to the time of evaluation. Group 1 was tested immediately after spring preactivation and stress relief by trial activation. The other 8 groups had the same procedure but were tested after they were maintained at a 5-mm activation for different times in an interbracket distance of 23 mm. A custom device was specifically made for this purpose ( Fig 4 ). Groups 2 through 9 were kept activated for 24, 48, and 72 hours, and 1, 2, 4, 8, and 12 weeks, respectively.
A universal testing machine (EMIC, São José dos Pinhais, Brazil), equipped with a load cell of 0.1 kN, was coupled to a moment transducer and a digital extensometer indicator (Transdutec, São Paulo, Brazil) for the tests. The speed used for the test was 5 mm per minute, and the digital extensometer’s excitation and sensitivity were 5 V and 0.5 mV/V, respectively.
For the tests, the TLSs were positioned symmetrically with an interbracket distance of 23 mm. To ensure the correct activation and the centralization of the TLSs, 9 mm were measured from the center of the loop toward each extremity of the horizontal extensions, where the stops were made ( Fig 5 ).
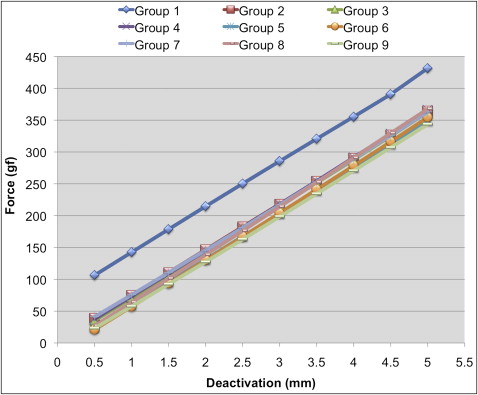
After an activation of 5 mm, the amounts of horizontal force and moment developed were recorded for every 0.5 mm of deactivation, and the MF ratios were calculated. Furthermore, the amount of horizontal overlap of the vertical extensions of the TLSs in “neutral position” (deformation assumed by a spring when its extremities are placed parallel to the positions that they will be engaged on the patient’s brackets, not producing any force, only moments) was calculated by linear interpolation. The load-deflection (LD) ratio (slope of the deactivation graph) was also obtained based on the chart ( Fig 6 ).
Statistical analysis
SPSS statistical analysis software (version 16.0; SPSS, Chicago, Ill) was used in this study. The Kolmogorov-Smirnov test indicated normal distributions, and the Levene test showed that all variables had similar variances, except the MF ratios.
The multivariate profile analysis with the procedure for analysis of repeated measures was used to detect differences in forces, moments, and MF ratios among the groups. This analysis compared the total profile, or deactivation pattern, of a whole group in relation to time and deactivation. To identify the differences among the groups, the post-hoc Tukey test was used with the averages generated by each time (total profile average).
Analysis of variance was used, at a level of 5%, to detect differences among the groups in the LD ratio and the amount of overlapping of the vertical extensions of the TLSs in “neutral position.” The post-hoc Tukey test, at a level of 5%, was used to identify the groups’ differences.
Results
There was a significant decrease of force from time among the groups when the total profiles of the TLSs were compared ( P <0.001). The horizontal forces were higher for group 1 compared with the other 8 groups ( Table I , Fig 6 ), which were not different among themselves. Group 1 showed a total profile average force of 267.6 gf compared with 200.7, 197.8, 200.5, 186.1, 186.2, 200.2, 196.1, and 181.7 gf, from groups 2 through 9, respectively ( Table II ). There was no significant interaction of time on the rate of force decrease of the loops ( P = 0.106) among the groups ( Table I ).
| Variation | Force | Moment | MF |
|---|---|---|---|
| P value | P value | P value | |
| Time | <0.001 | <0.001 | 0.600 |
| Deactivation | <0.001 | <0.001 | 0.010 |
| Deactivation × time | 0.106 | <0.001 | 0.464 |
| Force | Moment | MF | ||||
|---|---|---|---|---|---|---|
| Mean | SD | Mean | SD | Mean | SD | |
| Group 1 | 267.6 A | 105.2 | 1932.6 A | 259.2 | 8.3 | 3.2 |
| Group 2 | 200.7 B | 111.5 | 1537.9 B | 249.9 | 11.2 | 18.2 |
| Group 3 | 197.8 B | 107.8 | 1471.3 B | 239.3 | 26.7 | 166.7 |
| Group 4 | 200.5 B | 111.1 | 1616.5 B | 250.0 | 12.2 | 34.5 |
| Group 5 | 186.1 B | 104.8 | 1563.1 B | 206.7 | 14.2 | 13.7 |
| Group 6 | 186.2 B | 110.4 | 1636.4 B | 236.3 | 10.2 | 33.4 |
| Group 7 | 200.2 B | 108.4 | 1511.6 B | 269.5 | 14.7 | 47.1 |
| Group 8 | 196.1 B | 112.5 | 1582.7 B | 234.5 | 18.3 | 32.3 |
| Group 9 | 181.7 B | 109.5 | 1553.9 B | 349.9 | 18.2 | 45.1 |
The amount of overlap of the vertical extensions of the TLSs (“neutral position” in Table III ) was greater in group 1 (−0.99 mm) than in the other groups ( P <0.001). Time did not have an effect on the LD ratio of the TLSs, which were the same in all groups ( P = 0.159) ( Table III ), ranging from 70.8 to 75.5 gf per .5 mm.
| Time | Neutral position ∗ (mm) | LD † (gf/0.5 mm) ‡ | ||
|---|---|---|---|---|
| Mean | SD | Mean | SD | |
| Group 1 | −0.99 A | 0.31 | 71.7 | 3.2 |
| Group 2 | −0.03 B | 0.55 | 71.9 | 2.3 |
| Group 3 | 0.01 B | 0.36 | 72.4 | 2.6 |
| Group 4 | −0.01 B | 0.45 | 72.6 | 4.5 |
| Group 5 | 0.16 B | 0.02 | 72.0 | 2.7 |
| Group 6 | 0.22 B | 0.37 | 73.7 | 3.9 |
| Group 7 | −0.08 B | 0.57 | 71.1 | 4.0 |
| Group 8 | 0.15 B | 0.32 | 75.5 | 3.6 |
| Group 9 | 0.20 B | 0.46 | 70.8 | 4.7 |
Stay updated, free dental videos. Join our Telegram channel
VIDEdental - Online dental courses


