Introduction
Many variables affecting smile esthetics and attractiveness have been evaluated. However, the influence of the interaction of several variables is not as well known. Furthermore, patients and dental professionals might view smile esthetics differently. Therefore, the purpose of this research was to evaluate the influence of the smile arc in conjunction with the amount of maxillary gingival display on the perception of smile attractiveness by orthodontists, dentists, and laypersons.
Methods
A frontal intraoral photograph of ideally aligned teeth was modified using image-processing software. Photos showing 7 smile arcs, from flat to vaulted, were obtained, and these were combined with photos showing 4 different amounts of maxillary gingival display. The attractiveness of the 28 images of different smiles was evaluated by 3 groups of raters (orthodontists, dentists, and laypersons), each consisting of 70 persons.
Results
Both smile arc ( P <0.05) and gingival display amount ( P <0.001) had statistically significant influences on the perception of smile attractiveness. Smile attractiveness scores with reference to gingival display amount showed a statistically significant ( P <0.001) difference between the rater groups. A significant ( P <0.05) interaction between smile arc and gingival display amount was observed.
Conclusions
Examining other components influencing the perception of smile attractiveness might help clinicians develop more satisfying treatment plans for their patients.
The common notions about facial esthetics are usually based on subjective opinions rather than proven scientific data. Qualification and quantification of beauty are not easy. Nevertheless, despite its complexity, an estimation of the perception of beauty is a requisite in orthodontics because diagnosis and treatment planning should be based on scientific evidence from studies involving the measurement of beauty.
Patients’ concerns about their facial, or more particularly smile, esthetics are generally influenced by their social environment rather than by their dentists or orthodontists. It has been observed that culture, social status, and education level are factors that considerably affect the evaluation of esthetics. Therefore, the clinical result obtained after orthodontic treatment might be judged differently by patients and orthodontists. This difference in the perception of smile esthetics makes it complicated to specify any satisfaction criteria for orthodontic treatment.
Variables affecting smile esthetics and attractiveness such as smile arc, maxillary gingival display, buccal corridor, maxillary gingival height discrepancy, incisal edge discrepancy, canine and posterior crown torque, maxillary central incisor crown width to height ratio, maxillary lateral to central incisor ratio, maxillary midline to face, maxillary to mandibular midlines, overbite, and occlusal plane cant have been evaluated separately in previous studies. However, the influence of the interactions among these variables has not been examined. Therefore, the principal aim of this study was to quantitatively evaluate the influence of the smile arc in conjunction with the amount of maxillary gingival display on the perception of smile attractiveness by orthodontists, dentists, and laypersons.
Material and methods
A power analysis was performed to calculate the sample size required for the study. It showed that a total sample of 168 subjects (56 per group) was needed to detect statistically significant differences among the rater groups with power of 80% at the 0.05 significance level. The sample-size estimation was performed using NCSS and PASS software (version 2000; Number Cruncher Statistical Systems, Kaysville, Utah).
A frontal intraoral photograph of ideally aligned teeth and a frontal extraoral photograph displaying esthetically smiling lips were obtained from 2 women. The frontal intraoral photograph of ideally aligned teeth was modified with symmetrical adjustments of the curvature created by the incisal edges of the maxillary teeth using image processing software (version 7.0; Adobe Photoshop, San Jose, Calif). For this purpose, all teeth were isolated from the rest of the photograph using the layer function of the software, so that they could be moved separately. Thus, 7 different frontal intraoral photographs of ideally aligned teeth with 7 altered smile arcs ranging from flat to vaulted were obtained. These 7 smile arcs were numbered from 1 through 7, and they were constituted to fit sequentially increasing parabolic arcs.
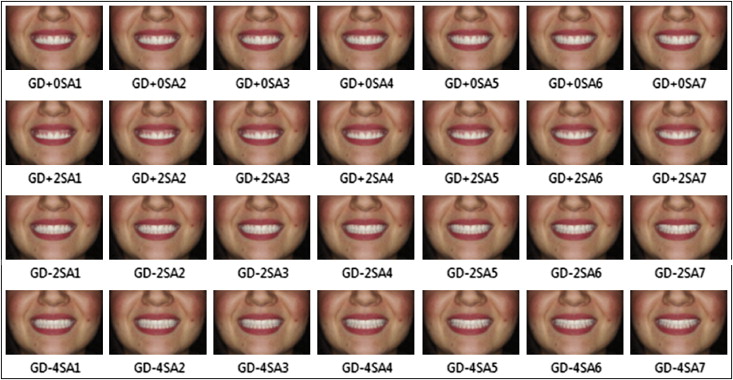
Then each intraoral photograph of aligned teeth was combined with the frontal extraoral photograph showing esthetically smiling lips by superimposition. While we were superimposing these photographs, we used the lips as a frame to surround the teeth, and the vertical position of the intraoral photograph was arranged in 4 ways so that 4 different amounts of maxillary gingival display were obtained. Thus, −4, −2, 0, and +2 mm amounts of gingival display were obtained by moving the teeth within the lip frame in 2-mm increments. For measuring 2-mm increments, the intraoral photographs of the aligned teeth were calibrated by calculating the ratio of the physical incisogingival length of the right central incisor in millimeters to its length in the photographs in pixels. Negative values were allocated when the upper lip covered the maxillary central incisors and positive values were allocated when the upper lip did not cover the maxillary central incisors for the classification of gingival display. Hence, with 7 smile arcs combined with 4 gingival display amounts, 28 images with different smiles were obtained ( Fig 1 ).
These 28 color images of 60 × 85 mm standard size were randomly positioned and printed on a questionnaire. A visual analog scale that consisted of an 80-mm bar was placed at the bottom of each image for subjective esthetic evaluation. The questionnaires with the 28 images were distributed to 3 rater groups, each comprising 70 raters. The first group included orthodontists, the second group contained dentists, and the third group was laypersons. All 210 raters were white. The orthodontists included in the study were at least 2 years postresidency, and the dentists were at least 2 years postgraduate.
The raters were asked to score the attractiveness of each smile image separately using the visual analog scale graded from unattractive to attractive. They were instructed to place a vertical mark on the scale for scoring attractiveness. All scores given to the smile images by the raters were measured manually by the same examiner (R.U.) with a digital caliper. Thus, scores from 0 to 80 were obtained: 0, very unattractive; 80, very attractive.
Statistical analysis
The data analysis was performed with SPSS software for Windows (version 11.5; SPSS, Chicago, Ill). The data are shown as means ± standard deviations. A multiway repeated measure of analysis of variance (ANOVA) was used to compare alterations of smile esthetics. Whereas smile arc and gingival display amount were assumed to be the dependent variables, rater group and sex were assumed to be the independent variables, and age was included in the model as a covariate factor. The Greenhouse-Geisser test was used to determine the statistical significance of the interaction terms. Bonferroni adjusted pairwise comparisons were applied for determining the differences among both smile arcs and gingival display measurements. A P value less than 0.05 was considered statistically significant. For all possible multiple comparisons, the Bonferroni adjustment was applied to control type I error.
Twenty randomly selected raters from each group were asked to score the same 28 images again to determine the intrarater reliability in judging the smiles. Intraclass correlation coefficients (with 95% confidence intervals) calculated for each image ranged between 0.90 and 0.94 for the orthodontists, 0.88 and 0.93 for the dentists, and 0.84 and 0.89 for the laypersons. Hence, the judgments of all 3 groups were reliable within the raters. The interrater reliability was also tested by kappa statistics. The kappa values calculated for each image ranged between 0.78 and 0.88 for the orthodontists, 0.77 and 0.89 for the dentists, and 0.74 and 0.86 for the laypersons; these can be considered substantially reliable.
Results
Table I shows the demographic distribution of the rater groups. The data are shown as means ± standard deviations. There were no significant differences among the groups for age and sex distributions.
| Variables | Orthodontists | Dentists | Laypersons | P value |
|---|---|---|---|---|
| Age (y) | 32.7 ± 9.8 | 29.2 ± 10.8 | 31.1 ± 11.6 | NS |
| Sex (female/male) | 41/29 | 47/23 | 45/25 | NS |
Table II indicates the sources of variation for smile attractiveness scores among the variables: age, rater group, sex, smile arc, and gingival display amount. The interactions among these variables are also presented. Age, rater group, and sex did not have statistically significant effects on the perception of smile attractiveness. On the other hand, both smile arc ( P <0.05) and gingival display amount ( P <0.001) had a statistically significant influence on the perception of smile attractiveness, independent from age, rater group, and sex. In addition, the smile attractiveness scores with reference to gingival display amount showed statistically significant ( P <0.001) differences among the rater groups. Furthermore, there was a significant ( P <0.05) interaction between smile arc and gingival display amount. Therefore, the smile attractiveness scores with reference to gingival display amount are influenced by smile arc, and the smile attractiveness scores with reference to smile arc are influenced by gingival display amount.
| Source of variation | P value |
|---|---|
| Smile arc | ∗ |
| Smile arc•age | NS |
| Smile arc•rater group | NS |
| Smile arc•sex | NS |
| Smile arc•rater group•sex | NS |
| Gingival display | † |
| Gingival display•age | NS |
| Gingival display•rater group | † |
| Gingival display•sex | NS |
| Gingival display•rater group•sex | NS |
| Smile arc•gingival display | ∗ |
| Smile arc•gingival display•age | NS |
| Smile arc•gingival display•rater group | NS |
| Smile arc•gingival display•sex | NS |
| Smile arc•gingival display•rater group•sex | NS |
| Age | NS |
| Rater group | NS |
| Sex | NS |
| Rater group•sex | NS |
Table III gives the smile attractiveness scores of each rater group for the different parabolic smile arcs and the different gingival display amounts. The scores are presented as means ± standard deviations for all smile arc, gingival display amount, and rater groups. The highest scores were obtained for smile arc 3 with −2 mm of gingival display ( Fig 2 ) among laypersons and for smile arc 5 with 0 mm of gingival display ( Fig 3 ) among the orthodontists and the dentists, whereas the lowest scores were obtained for smile arc 1 with +2 mm of gingival display in all rater groups.
| Smile arc | Group | Gingival display −4 mm | Gingival display −2 mm | Gingival display 0 mm | Gingival display +2 mm |
|---|---|---|---|---|---|
| Orthodontists | 40.7 ± 20.2 Aa∗ | 50.5 ± 24.4 Aa∗ | 38.3 ± 25.4 Aa∗ | 14.5 ± 17.6 Ba∗ | |
| 1 | Dentists | 44.3 ± 17.3 Aa∗ | 53.9 ± 21.2 Ba∗ | 39.4 ± 23.6 Aa∗ | 18.1 ± 13.3 Ca∗ |
| Laypersons | 48.2 ± 28.0 Aab∗ | 55.4 ± 27.7 Aa∗ | 40.0 ± 24.8 Aa∗ | 22.8 ± 24.5 Ba∗ | |
| Orthodontists | 37.9 ± 21.5 Aac∗ | 45.5 ± 22.5 Aa∗ | 44.9 ± 24.6 Aab∗ | 20.6 ± 19.0 Ba∗ | |
| 2 | Dentists | 47.1 ± 19.5 Aab∗† | 53.7 ± 21.6 Aa∗ | 49.3 ± 21.5 Abc∗ | 23.5 ± 14.8 Ba∗ |
| Laypersons | 54.3 ± 28.7 Ab† | 58.2 ± 25.9 Aab∗ | 46.9 ± 25.8 Abc∗ | 25.1 ± 21.9 Bab∗ | |
| Orthodontists | 36.2 ± 20.0 Aac∗ | 56.4 ± 24.9 Bab∗ | 59.0 ± 26.1 Bd∗ | 15.2 ± 16.5 Ca∗ | |
| 3 | Dentists | 46.0 ± 18.5 Aa∗ | 62.2 ± 17.3 Bb∗ | 51.1 ± 21.5 Ac∗ | 19.0 ± 12.8 Ca∗ |
| Laypersons | 51.2 ± 30.2 Aab∗ | 68.1 ± 24.5 Bb∗ | 50.5 ± 22.4 Ac∗ | 24.0 ± 24.7 Cab∗ | |
| Orthodontists | 30.9 ± 19.7 Ac∗ | 56.7 ± 24.9 Bab∗ | 60.7 ± 23.5 Bde∗ | 28.1 ± 22.5 Ab∗ | |
| 4 | Dentists | 47.2 ± 18.9 Aa† | 58.0 ± 22.1 Bab∗ | 56.3 ± 21.4 ABcd∗ | 27.9 ± 16.4 Cb∗ |
| Laypersons | 50.8 ± 30.5 Aab† | 58.1 ± 26.3 Aab∗ | 51.3 ± 25.4 Ac∗ | 31.6 ± 25.7 Bb∗ | |
| Orthodontists | 38.2 ± 21.3 Aac∗ | 55.6 ± 22.4 Bab∗ | 68.1 ± 25.3 Be∗ | 25.3 ± 21.1 Aab∗ | |
| 5 | Dentists | 43.9 ± 22.8 Aa∗ | 58.3 ± 21.0 Bab∗ | 64.5 ± 24.0 Be∗ | 28.9 ± 16.2 Cb∗ |
| Laypersons | 42.1 ± 29.9 Aa∗ | 63.3 ± 30.0 Bb∗ | 55.9 ± 25.0 Bcd∗ | 31.5 ± 26.3 Ab∗ | |
| Orthodontists | 31.3 ± 21.2 Ac∗ | 51.2 ± 25.8 Ba∗ | 65.7 ± 21.5 Be∗ | 28.1 ± 21.9 Ab∗ | |
| 6 | Dentists | 41.1 ± 20.1 Aa∗† | 54.5 ± 21.1 Ba∗ | 62.2 ± 22.4 Bde∗ | 30.2 ± 18.2 Ab∗ |
| Laypersons | 50.3 ± 28.5 ABab† | 55.9 ± 31.0 Bab∗ | 52.3 ± 28.0 Bcd∗ | 32.7 ± 27.2 Ab∗ | |
| Orthodontists | 32.2 ± 23.2 Ac∗ | 53.2 ± 21.0 Ba∗ | 65.8 ± 21.5 Be∗ | 31.5 ± 22.6 Ab∗ | |
| 7 | Dentists | 38.1 ± 20.9 Aac∗ | 55.5 ± 21.5 Ba∗ | 64.2 ± 19.0 Be∗ | 29.0 ± 18.6 Ab∗ |
| Laypersons | 42.1 ± 26.8 ABa∗ | 57.3 ± 27.6 Cab∗ | 54.3 ± 27.8 ACcd∗ | 35.9 ± 25.3 Bb∗ |
Table IV indicates the overall smile attractiveness scores for the different parabolic smile arcs at the various amounts of gingival display. The results show that the perception of the most attractive parabolic smile arc changes as the gingival display changes. It is also acceptable, vice versa, that the perception of the most attractive gingival display amount changes as the parabolic smile arc changes. When the gingival display amount was −4 mm, the most attractive smile arc perceived was smile arc 2 ( Fig 4 ). When the gingival display amount was −2 mm, the most attractive smile arc perceived was smile arc 3 ( Fig 2 ). When the gingival display amount was 0 mm, the most attractive smile arc perceived was smile arc 5 ( Fig 3 ). When the gingival display amount was +2 mm, the most attractive smile arc perceived was smile arc 7 ( Fig 5 ). Hence, when the gingival display amount is insufficient, flat parabolic smile arcs are preferred. On the other hand, when the gingival display amount is excessive, vaulted parabolic smile arcs are preferred. The highest scores were obtained for smile arc 5 with 0 mm of gingival display ( Fig 3 ), whereas the lowest scores were obtained for smile arc 1 with +2 mm of gingival display ( Fig 6 ). Another obvious finding shown in Table IV is that consistently high scores were obtained at −2 mm of gingival display with all 7 smile arcs. Conversely, the lowest scores were obtained consistently at +2 mm of gingival display with all 7 smile arcs.


