Introduction
The finite element method is a promising tool to investigate the material properties and the structural response of the periodontal ligament (PDL). To obtain realistic and reproducible results during finite element simulations of the PDL, suitable bio-fidelic finite element meshes of the geometry are essential.
Methods
In this study, 4 independent coworkers generated altogether 17 volume meshes (3-dimensional) based on the same high-resolution computed-tomography image data set of a tooth obtained in vivo to compare the influence of the different model generation techniques on the predicted response to loading for low orthodontic forces.
Results
It was shown that the thickness of the PDL has a significant effect on initial tooth mobility but only a remarkably moderate effect on the observed stress distribution in the PDL. Both the tooth and the bone can be considered effectively rigid when exploring the response of the PDL under low loads. The effect of geometric nonlinearities could be neglected for the applied force system.
Conclusions
Most importantly, this study highlights the sensitivity of the finite element simulation results for accurate geometric reconstruction of the PDL.
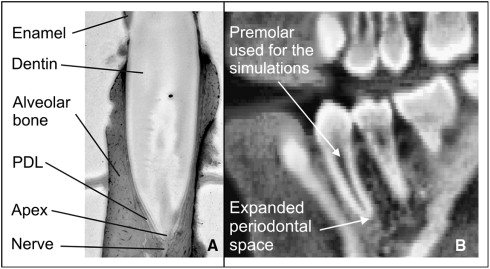
The biomechanical background of orthodontic tooth movement has been explored by many authors. The periodontal ligament (PDL) is part of the periodontium. This periodontium additionally comprises the alveolar bone, the dental cementum, and the gingiva, and it supports the teeth and maintains them in the maxillary and mandibular bones. The PDL is a thin connective tissue connecting the tooth root with the surrounding alveolar bone ( Fig 1 , A ). Because of its low stiffness ( Table I ), the PDL plays a key role in tooth mobility. It is widely acknowledged that orthodontic tooth movement principally depends on stress or strain in the PDL.
| Elastic modulus (MPa) | Poisson’s ratio | |
|---|---|---|
| PDL | 0.1 | 0.45 |
| Dentin | 18600 | 0.3 |
| Cortical bone | 1000 | 0.3 |
| Cancellous bone | 500 | 0.3 |
Characterization of the PDL by using standard mechanical testing is not trivial because of the complexity of isolating and preserving a sample of appropriate dimensions for testing. An alternative approach is to use experimental measurements of whole tooth movement combined with simulations on subject-specific image-based finite element models to infer the material properties. This is effectively using the finite element method to study the inverse problem: with at least 1 measured displacement of the tooth under prescribed loads, what are the material properties of the PDL in the finite element model that would replicate the experimentally observed response of the system? Of course, the effectiveness of this approach is contingent on obtaining suitably accurate finite element models of the tooth and the periodontium being experimentally tested. Further difficulties could occur because of the nonhomogeneity of the tissues.
In animal or human in-vitro studies, it is possible to generate accurate finite element models of a tooth and periodontium because methods such as microcomputed tomography or serial sectioning of the samples can be used. This is more difficult in human in-vivo studies. In addition to approximating the PDL by well-known geometric shapes or average literature values as parabolas, finite element models were generated starting from radiologic data subjected to the limitations of the respective imaging accuracy. Most authors generated the PDL with a constant thickness. Either hexahedral or tetrahedral element meshes were used by all authors.
The process of going from image to mesh involves a number of processing steps, each with its own potential for introducing further geometric errors. Aspects such as the influence of volume-preserving smoothing on the segmented PDL image, which will be shown to have a significant impact on the accuracy of simulation results in this article, have not previously been investigated.
This study was principally aimed at comparing 4 strategies for image-based model generation of the PDL on the finite element simulation results and, thereby, to assess the sensitivity of simulation results to modeling assumptions during segmentation and meshing. Furthermore, validation of the applied boundary conditions (bone as stiff material for low orthodontic forces) will be provided. To this end, 4 independent strategies were used to generate finite element models based on identical image data of a tooth. To our knowledge, there is no comparable study in the literature investigating the effect of different geometric modeling approaches chosen by different researchers on simulation results.
Material and methods
Finite element mesh generation of a premolar from a patient was performed according to 4 independent strategies by 4 independent researchers (C.D., P.Y., A.H., C.K.). Altogether, 17 finite element meshes of this premolar were generated.
Two strategies (1 and 3) were based on approximating early on the geometry of the PDL (by using prescribed thicknesses), whereas strategies 2 and 4 were entirely image based.
All finite element models generated in this study refer to a mandibular first premolar from clinically indicated CT data (acquired with a MxTwin CT device, Picker, Cleveland, Ohio; z-distance, 0.6 mm; pixel size, 0.352 × 0.352 mm 2 ) of a 14-year-old boy ( Fig 1 , B ). The data were processed with AMIRA software (version 4.0, Mercury Computer Systems, Berlin, Germany). At the apex of the tooth, an increased periodontal space was observed, probably a sign of a not-yet completely formed premolar.
For strategy 1, the first coworker (C.D.) used the method described by Clement et al, Dorow and Sander, and Dorow. Segmentation, model generation, and preprocessing for finite element analysis for the first model were performed by using the visualization toolbox AMIRA and finite element software (ANSYS, Canonsburg, Pa). Mapped meshes of 8-noded hexahedral elements with 3 elements across the thickness of the PDL were generated to create 3 models with different prescribed constant thicknesses (measured perpendicular to the tooth axis): 0.1 mm (model 1a), 0.2 mm (model 1b), and 0.3 mm (model 1c), respectively. The element numbers given in Table II are almost the same for the 3 models.
| Model | Nodes for the PDL (n) | Elements for the PDL (n) | Element type and mesh generator | References | Comments | |
|---|---|---|---|---|---|---|
| 1 | a | 27268 | 20292 | Hexahedral, Ansys (APDL-Macros) | PDL thickness, 0.1 mm | |
| b | 27268 | 20292 | PDL thickness, 0.2 mm | |||
| c | 28100 | 20916 | PDL thickness, 0.3 mm | |||
| 2 | 70066 | 262161 | Hybrid (tetrahedrons, hexahedrons), ScanIP/FE | Shape of the PDL, increased thickness near the apex, reconstruction based on the segmentation | ||
| 3 | a | 53172 | 68212 | Wedges, hexahedrons, ABAQUS/CAE (Computer Aided Engineering) | PDL thickness, 0.05 mm | |
| b | 53172 | 68212 | PDL thickness, 0.1 mm | |||
| c | 88620 | 136424 | PDL thickness, 0.2 mm | |||
| d | 124067 | 204634 | PDL thickness, 0.3 mm | |||
| 4 | a | 1872 | 5415 | Tetrahedral, AMIRA | Shape of the PDL, thin near the alveolar crest, increased thickness near the apex, reconstruction based on the segmentation | |
| b | 10917 | 42565 | ||||
| c | 23020 | 109139 | ||||
| d | 7257 | 21570 | ||||
| e | 19816 | 90618 | ||||
| f | 23562 | 106754 | ||||
| g | 23853 | 108179 | ||||
| h | 23217 | 69451 | ||||
| i | 52807 | 233377 | ||||
For the segmentation strategies 2, 3, and 4, to start with, mandibular bone and teeth were segmented (as separate tissues) from the CT data by using standard semiautomatic segmentation techniques as thresholds and region growing provided by the visualization toolbox AMIRA. To allow for detailed modeling, the CT data and the segmented binary images were cropped to the respective region of interest and, thereafter, upsampled to nearly isotropic voxel size by a factor of 5 in the x and y directions, and a factor of 10 in the z direction. By volumetric dilatation of the (upsampled) segmentation of the tooth of about 7 pixels, a gap between the tooth and the bone for modeling the PDL was generated. Because the PDL thickness is about the same order of magnitude as the axial image resolution of the original CT data, the gray values of the original and the upsampled data reflect to some extent the shape of the PDL. The 3-dimensional region growing limited to the previously segmented gap with interactively chosen seed points in this gap allowed for this kind of modeling of the PDL. Notably, the observed increased periodontal space at the apex could be captured by this procedure.
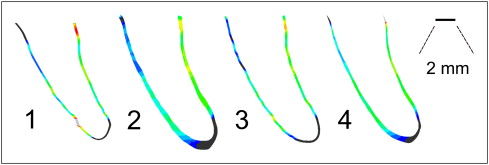
In strategy 2, the meshing software ScanIP/FE (Simpleware, Exeter, United Kingdom) were applied for model generation based on the segmentation already described. The image-based meshing techniques and issues and the approach used in ScanIP/FE have been described. The thickness of the resulting PDL model varied between 0.25 mm near the alveolar crest and 0.85 mm at the apex. Figure 2 reflects this shape. As previously mentioned, the expanded periodontal space might indicate that the growth of the premolar was not completed. The tooth and the alveolus were modeled with shell elements, and a hybrid (hexahedral and tetrahedral elements) mesh was used to model the PDL ( Table II ). Among all meshes that we studied in this article, the mesh built by strategy 2 showed the best element quality in the sense of highest regularity. The surface-generation, antialiasing, and smoothing algorithms in ScanIP/FE also uniquely preserve the topology and volume. This technique prevents shrinking as observed in strategy 4, for example.
In strategy 3, by extruding the shell elements representing the tooth surface of the second model, 4 further PDL models consisting of hexahedron and wedge elements were generated (ABAQUS, ABAQUS Inc., Providence, Rhode Island). Since the extrusion was performed perpendicularly to the tooth surface, the PDL thicknesses of 0.05 mm (model 3a), 0.1 mm (model 3b), 0.2 mm (model 3c), and 0.3 mm (model 3d) were ensured to be constant all over the PDL.
Meshing strategy 4 also refers to the segmentation previously given. First, a triangular surface representing the geometry was created. Stepwise surface smoothing, simplification, and interactive improvement allowed for a model suitable for tetrahedral finite element mesh generation. Near the alveolar crest, the size of the resulting PDL model was small: about 0.07 mm. Toward the apex, the size increased to about 0.7 mm, reflecting the enlarged periodontal space observed in the original CT data ( Fig 1 , B ). The overall reduced size compared with model 2 was probably due to side effects of smoothing and simplification of the triangular surface. Tetrahedral element meshes were generated by using the built-in AMIRA mesh generator. Nine meshes starting from the same triangular geometry and with the same types of elements (models 4a-4i) were generated by varying element numbers and mesh quality ( Table II ).
For comparison of the output of the 4 strategies, central cross sections of the models are shown in Figure 2 .
For further preprocessing, numeric simulation, and postprocessing, all meshes were imported to the ABAQUS/CAE (Computer Aided Engineering) environment. For the comparability of the simulation results, identical material properties and boundary conditions were used for all calculations.
A linear elastic constitutive equation was chosen for the PDL, tooth, and alveolus. See Table I for the respective isotropic material properties. This approximation is justified because, in this study, only low orthodontic forces were applied, resulting in small strains.
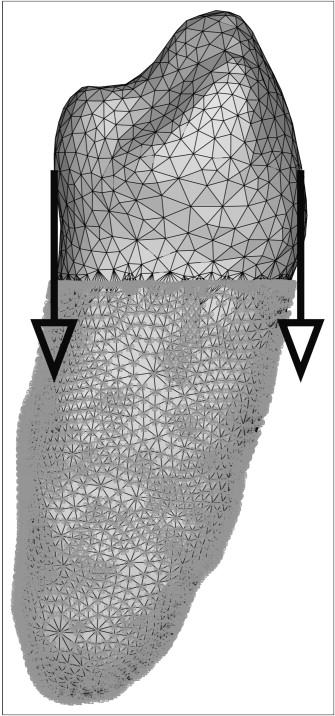
Because intrusion is a typical orthodontic load case, an intrusive load of 0.5 N was identically applied to the tooth crown of each model, split into 2 intrusive forces of 0.25 N at the lingual and the labial sides ( Fig 3 ). Notably, the applied forces were small.