Fig. 9.1
Ultrasonography of the major salivary glands. (a) demonstrates the appearance of a normal right parotid gland (anterior to the right, posterior to the left of the image). The tissue in the upper part of the image is the skin and dermal layers. The dashed line represents the superficial edge of the parotid gland. The shorter dashed line indicates the boundary of the parotid and the masseter muscle. Sound waves do not penetrate the mandible, and the white line inferior to the masseter is the buccal (lateral) corticated border of the right ascending ramus. The parotid tissue extends into the deep lobe posterior to the ascending ramus, but its full extent is not visualized. (b) demonstrates a right parotid gland at a similar position within the gland. Note the more heterogeneous appearance to the echotexture of the gland, with intermittent hypoechoic (darker) areas, particularly within the superficial layers in this case. This is termed a mild honeycomb appearance. (c) demonstrates a right parotid gland with more severe changes associated with Sjogren’s syndrome. The distinct foci (marked by white arrowheads) are darker (hypoechoic) and larger
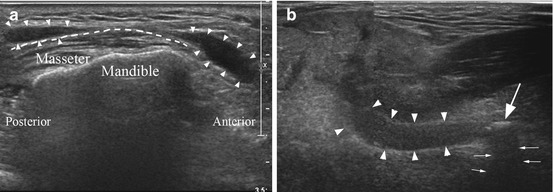
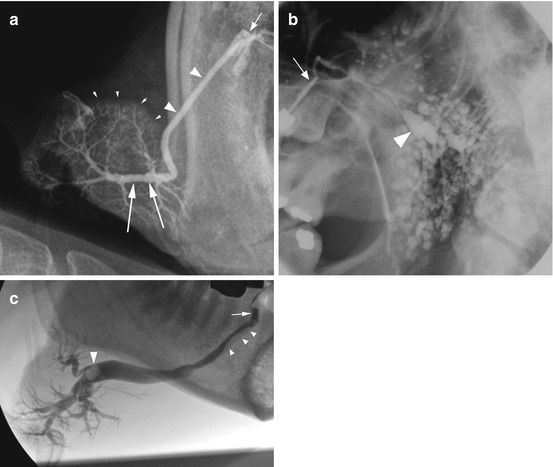
Fig. 9.2
Ultrasonography of obstructive salivary gland disease. (a) shows a right submandibular gland (outlined with dashes) with two merged ultrasound images demonstrating the gland and also the dilated duct (outlined with arrowheads). Note the dilated duct extending proximally back to the hilum from a calculus located in the mid-third of the main duct (large arrow). The stone is calcified and has produced a post-acoustic shadow extending away from the ultrasound source (marked by the small white arrows). (b) demonstrates a right parotid gland duct with strictures present in the mid-third of the main duct, as it passes over the masseter muscle. The dilated duct is outlined with arrowheads
The submandibular glands usually have a slightly heterogeneous appearance in comparison to the parotid glands, a feature thought to relate to the different structure and cellular composition of the two glands.
The current American and European consensus guidelines on the diagnosis of Sjogren’s syndrome do not include ultrasound as an accepted imaging modality in the diagnosis, whereas sialography and scintigraphy are accepted [3]. However, ultrasonography has proved particularly useful in the assessment and monitoring of Sjogren’s syndrome [4–8]. The ultrasound features noted in early Sjogren’s syndrome are mild heterogeneous changes to the echotexture, particularly affecting the parotid glands. As the disease progresses the parenchyma demonstrates more marked heterogeneity, leading to a clear honeycomb appearance (Fig. 9.1), with hypoechoic foci spread throughout the gland. With further progression of the disease, a markedly heterogeneous pattern is seen. The ultrasound changes are usually present bilaterally, but may be much more prominent in a single pair of major salivary glands than the other, for example, the submandibular glands may demonstrate a reasonably normal echotexture, while the parotid glands demonstrate a honeycomb appearance.
Of particular importance to the imaging of dry mouth is the sensitivity and specificity (75–90 % and 84–98 %) of ultrasound examination which has been shown to produce very similar levels to those of MRI (94–96 % and 97–100 %), and both ultrasound and MRI may perform better than both sialography and scintigraphy [7, 8]. Interestingly different groups have used differing scoring systems in their studies on the efficacy of ultrasound in diagnosing Sjogren’s syndrome. A future study to compare these individual scoring systems and devise a more sensitive and specific system may assist in driving a move from sialography and scintigraphy as the imaging modalities accepted for the diagnosis of Sjogren’s syndrome to the acceptance of ultrasonography, particularly given its relative ease of use, relative costs involved, and with no radiation required.
While ultrasonography is not yet accepted as an imaging modality in the formal diagnosis of Sjogren’s syndrome, it is a very valuable tool in monitoring the status of the salivary glands in Sjogren’s syndrome without involving a radiation dose. This role in monitoring disease progression becomes significant in managing the small but important group of Sjogren’s patients who develop mucosa-associated lymphoid tissue (MALT) lymphoma. The diagnosis of MALT lymphoma is difficult; on ultrasound the features of concern are the development of larger hypoechoic areas (Fig. 9.1), and an important advantage of ultrasound examination is the ability to assess the vascularity in and around these hypoechoic areas which can be suggestive of lymphomatous change.
While ultrasonography is developing as a tool for assessing Sjogren’s syndrome, it is important to bear in mind that the changes described in the ultrasound features including the echotexture and the echogenicity seen in Sjogren’s syndrome are not specific to Sjogren’s syndrome. The interpretation of the ultrasound findings must always be considered in the wider clinical picture. This is not only true for ultrasonography but relevant to the other imaging modalities as well. Similar ultrasound appearances to those seen in Sjogren’s syndrome can also be seen in other diseases such as chronic sialadenitis, sarcoidosis, and HIV-associated salivary gland disease. The role of imaging is therefore an adjuvant to support a clinical diagnosis where the findings must be interpreted within the clinical picture.
Sialography
Conventional sialography is a technique used to image the ductal system of the major salivary glands. An iodine-based water-soluble contrast medium is used. The duct orifice is located and gently dilated with lacrimal dilators, and a sialography catheter is inserted into the duct orifice. The parotid duct orifice can usually be readily located in the buccal mucosa and, in the absence of a stricture at the duct orifice, is often readily cannulated. The submandibular duct orifice by comparison is routinely much smaller; as an indication of the size difference, we routinely use a 20-G cannula for the parotid duct, but require a 27-G cannula for the submandibular duct. The need to cannulate the duct can preclude conventional sialography as a mode of imaging if it is not possible due to a particularly small duct orifice or if there is a lack of specialist experience in a clinical centre.
Once cannulated the contrast can be administered by hand pressure, hydrostatic pressure, or a continuous infusion pressure-monitored pump [9, 10]. Approximately 1 ml of contrast is required, but the volume is tailored to the patient’s response. If an obstruction is present, the patient may experience discomfort or pain. With time the pressure in the gland/duct usually reduces allowing further infusion of contrast to permit adequate coating of the ducts; this is important to produce a good image of the ductal system which is seen as a ‘river delta’ or ‘branches of a tree’ in the case of a healthy gland. In the presence of ductal dilatation, a significantly larger volume of contrast may be required, but this must be balanced with the desire to avoid overfilling and resultant extravasation of contrast through the gland acini with a resultant radiographic appearance referred to as parenchymal ‘blushing’ (Fig. 9.2a).
Imaging of the ductal system may involve static images performed following administration of the contrast, using plain radiographs which include lateral views, oblique lateral views (Fig. 9.2b), and anterior-posterior radiographs or alternatively with cross-sectional imaging either as a CT scan or a cone beam CT scan [11, 12]. Cross-sectional imaging studies can provide more information on the course and morphology of the duct than plain radiographic sialography which should suggest it may be the imaging modality of choice for sialography. Personal experience suggests that the added complication of performing sialography in the confines of a cone beam CT scanner may override the benefit of the technique, but published data suggests it is a feasible and useful method [11, 12].
An alternative to a static sialogram is a dynamic study which can be performed with the infusion of contrast occurring under fluoroscopy imaging (Fig. 9.2c) and also allows the possibility of digital subtraction fluoroscopy. Digital subtraction involves initial capture of a mask image that is digitally subtracted from all subsequent images in that imaging sequence run. Digital subtraction imaging provides high definition of an obstruction but requires a patient to remain completely still during infusion of the contrast which is not always possible.
Dynamic imaging with or without digital subtraction involves rapid repeated bursts of radiation which is captured as a sequence and can be played back on a monitor. It offers a significant advantage over static imaging, particularly in cases with salivary gland obstruction. Dynamic imaging allows the observation of flow up to, around, and beyond an obstruction thus not only localizing the position of the obstruction as seen with static imaging but in addition providing information on expansion of the surrounding duct and, if a salivary stone is present, demonstrating the extent of mobility of the stone (Fig. 9.3).
Stay updated, free dental videos. Join our Telegram channel
VIDEdental - Online dental courses


