Introduction
The data used to test the validity of a prediction method should be different from the data used to generate the prediction model. In this study, we explored whether an independent data set is mandatory for testing the validity of a new prediction method and how validity can be tested without independent new data.
Methods
Several validation methods were compared in an example using the data from a mixed dentition analysis with a regression model. The validation errors of real mixed dentition analysis data and simulation data were analyzed for increasingly large data sets.
Results
The validation results of both the real and the simulation studies demonstrated that the leave-1-out cross-validation method had the smallest errors. The largest errors occurred in the traditional simple validation method. The differences between the validation methods diminished as the sample size increased.
Conclusions
The leave-1-out cross-validation method seems to be an optimal validation method for improving the prediction accuracy in a data set with limited sample sizes.
One major purpose of statistical analysis is to use past events to predict future events. In orthodontics, predicted outcomes of treatment are fundamentally needed for orthodontists to properly diagnose and plan treatment for their patients. Because of the huge interindividual variations among humans, the accuracy of these predictions is a wide-open question. A prediction model may produce promising results when developed from its original data, but often it cannot reproduce the same promising results when applied to new subjects. Therefore, a validation report is required to better scrutinize a prediction method before its clinical application.
The ability to make accurate predictions is the major goal of a prediction study. In general, 2 steps are necessary: a model-building procedure and a validation step. After the prediction model has been developed from the original data, assessing the model’s prediction error using an independent data set is defined as validation, and that data set is called the validation set.
There are several related terms that need to be defined. Learning data (or learning data set ) refers to the data from which a prediction model is derived or built. The learning data set is also called the training or study data set . The validation data are a set or sets of data used to estimate the future accuracy of the prediction formula derived from the learning data. The validation data set can also be called the test , real , or prediction data set .
The model-building procedure is performed using the learning data set. This is the process by which various prediction equations or models are developed. After the model fitting, the learning error, which assesses the goodness-of-fit of the prediction model, is calculated. This is the method by which the best prediction model is selected based on its goodness of fit and resulting calculated learning error. These procedures are all calculated using the original data set.
After selecting the final prediction model, the validation step assesses how well the chosen prediction method performs for new subjects. Therefore, the true test of the prediction formula is how well the method predicts the outcomes for a different data set. To restate, after we build a prediction model with the learning data, we assess the prediction performance, or the validity of the prediction model, according to how well the prediction model fits with the validation set and the calculated validation error ( Fig 1 ).
Using the validation data set to assess prediction accuracy is a crucial step in the development of a new prediction equation. The validation step measures not only the accuracy but also the generalizability of the new prediction model. Therefore, it is always recommended to test the validity of a prediction model with a validation data set, rather than just reporting the goodness-of-fit measure or the learning error in the learning data. Unfortunately, validation reports are often missing from orthodontic studies. Omitting a validation report is a common error in prediction studies.
We chose a mixed dentition analysis (MDA) as an example for our study. This model predicts the sum of the mandibular canines and premolars using the sum of the erupted mandibular incisors. Regression analysis has been the most often used method for MDA ; however, most MDA studies that we evaluated have not included a validation report but have only reported the learning errors. The few articles that did include validation results used the simple validation method ( Table I ).
| Research group | Year | Population | Learning data | Validation data |
|---|---|---|---|---|
| Sonahita et al | 2012 | Indian | Female 100; male 100 | None |
| Portelli et al | 2012 | Italian | Female 156; male 144 | None |
| Cattaneo et al | 2010 | Italian | Female 128; male 100 | None |
| Uysal et al | 2009 | Turkish | Female 128; male 100 | None |
| Arslan et al | 2009 | Turkish | Female 210; male 202 | Female 25; male 25 |
| Seo et al | 2009 | Korean | Female 119; male 188 | Female 330; male 174 |
| Al-Bitar et al | 2008 | Jordanian | Female 193; male 174 | None |
| Altherr et al | 2007 | American | Female 60; male 60 | Female 20; male 20 |
| Bernabe and Flores-Mir | 2004 | Peruvian | 150 | Female 50; male 50 |
| Diagne et al | 2003 | Senegalese | Female 20; male 25 | None |
| Nourallah et al | 2002 | Syrian | Female 280; male 320 | 50 |
| Jaroontham and Godfrey | 2000 | Thai | Female 215; male 215 | None |
| Yuen et al | 1998 | Hong Kong Chinese | Female 46; male 51 | None |
| Bishara and Jakobsen | 1998 | European American | Female 22; male 33 | None |
| Lee-Chan et al | 1998 | East Asian American | 201 | None |
| Schirmer and Wiltshire | 1997 | African American | 100 | None |
| Al-Khadra | 1993 | Saudi Arabian | 34 | None |
| Tanaka and Johnston | 1974 | European American | 506 | None |
The simple validation method is a traditional method that entails partitioning the number of subjects available for a study into a learning set and a validation set. This method is intuitive because each subject is used only once, either to develop the prediction equation in the learning set or to validate the prediction error in the validation set. However, what if, as in many research projects, there are a limited number of subjects, insufficient to split the data set into 2 subgroups while still maintaining the power of the study? Might a more accurate prediction be possible if all subjects had been used to formulate the prediction equation? In this case, is a new data set mandatory to validate the prediction method? In the absence of an independent new data set, is validation impossible?
The aim of this study was to provide answers to the aforementioned questions. We compared the validation methods by analyzing real MDA data and then simulating theoretical random data. The inclusion of a simulation study allowed us to vary the analysis setting systematically. The simulation study was based on the MDA format, which is common in orthodontics. We also considered how to validate a prediction model and which validation method performs the best.
Material and methods
For the real MDA data, we used a previously published tooth-size data set. The data consisted of the tooth-size measurements for 811 subjects. More detailed information is available in the article about that analysis.
A multiple regression equation was built using the learning data set. To mimic the subject sizes of the previous MDA studies—ie, n = 50, 100, 150, 200, 400, and 800, —a random sampling method was used to create 6 scenarios.
We repeated the random sampling procedure 1000 times. The input variables were the tooth sizes of the mandibular incisors and the sexes of the patients. The output variable was set as the expected sum of the tooth sizes of the mandibular canines and premolars; this is the common MDA formulation.
The simulation setting was inspired by the real MDA data set. To mimic the tooth sizes, a random normal distribution was used. A random binomial distribution was used to represent sex. The coefficients for the multiple regression were captured by mimicking the real MDA analysis. We performed 1000 runs of simulations with increasing sample sizes: 50, 100, 150, 200, 400, 800, and 1600.
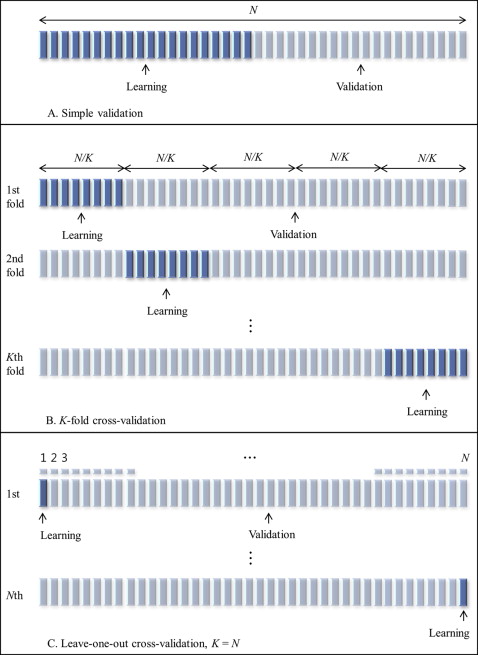
We compared 4 validation methods: simple validation; 5-fold cross-validation (5-fold CV); 10-fold cross-validation (10-fold CV); and the leave-1-out cross-validation (LOOCV). Each validation technique involved dividing the data into a learning set and a validation set. A brief description of each validation method is provided in Figure 1 .
The simple validation method has been popular since the early 1930s. This technique is also known as the simple split, learning-test split, or holdout method. In our test, we used half of the data as the learning set from which the prediction equation was derived, and the other half as the validation set to test the model’s validity.
Various splitting strategies lead to several related cross-validation techniques. One of them that we applied in this study is the K -fold method. In the K -fold cross-validation method, the original data set is randomly partitioned into K subsamples. Of the K subsamples, 1 subsample is then retained as the validation data set, and the remaining K − 1 subsamples are used as the learning data set. The cross-validation process is then repeated K times (the folds), with each K subsample used only once as the validation data. The validation results from each fold can then be averaged (or otherwise combined) to produce 1 estimation. The advantages of this method over completely separate subsets or over repeated random subsampling are that all observations are used for both learning and validation, and each observation is used for validation exactly once.
The K can be equal to any value. In this study, we set K at 5 (5-fold CV) and 10 (10-fold CV) because the optimal K is between 5 and 10. If K = n—that is, when K is equal to the number of subjects—this is known as the LOOCV method; it is the most extreme version of the K -fold cross-validation method ( Fig 1 ).
The R programming language was used in this article. In the validation data sets, the absolute values of the prediction errors were calculated for each validation method. A complete compilation of the results, the R codes used for the simulations, and the real data analyses are provided as Supplementary data .
Results
The validation results for both the real MDA data and the simulation studies demonstrated that the LOOCV method gave the smallest errors, followed by the 10-fold CV and 5-fold CV methods. The largest errors occurred with the simple validation method ( Table II ).
| Validation method | n = 50 | n = 100 | n = 150 | n = 200 | n = 400 | n = 800 |
|---|---|---|---|---|---|---|
| Real data | ||||||
| Simple validation | 0.719 (0.120) | 0.695 (0.079) | 0.688 (0.061) | 0.684 (0.054) | 0.677 (0.034) | 0.672 (0.020) |
| 5-fold CV | 0.697 (0.083) | 0.686 (0.057) | 0.682 (0.042) | 0.679 (0.036) | 0.672 (0.021) | 0.671 (0.006) |
| 10-fold CV | 0.692 (0.080) | 0.684 (0.056) | 0.680 (0.041) | 0.678 (0.036) | 0.672 (0.020) | 0.671 (0.006) |
| LOOCV | 0.691 ∗ (0.079) ∗ | 0.683 ∗ (0.056) ∗ | 0.679 ∗ (0.041) ∗ | 0.677 ∗ (0.036) ∗ | 0.671 ∗ (0.020) ∗ | 0.670 ∗ (0.006) ∗ |
| Simulation data | ||||||
| Simple validation | 0.854 (0.138) | 0.823 (0.092) | 0.817 (0.074) | 0.809 (0.062) | 0.804 (0.042) | 0.801 (0.031) |
| 5-fold CV | 0.830 (0.094) | 0.810 (0.064) | 0.809 (0.051) | 0.806 (0.044) | 0.801 (0.029) | 0.800 ∗ (0.022) ∗ |
| 10-fold CV | 0.826 (0.094) | 0.809 (0.064) | 0.808 (0.051) | 0.806 (0.044) | 0.800 ∗ (0.029) ∗ | 0.800 ∗ (0.022) ∗ |
| LOOCV | 0.823 ∗ (0.092) ∗ | 0.808 ∗ (0.063) ∗ | 0.807 ∗ (0.050) ∗ | 0.805 ∗ (0.044) ∗ | 0.800 ∗ (0.029) ∗ | 0.800 ∗ (0.022) ∗ |
In the analyses with the real data, the validation errors produced by the simple validation method were statistically significantly different from those produced by the cross-validation methods. For n = 800, only the LOOCV had a statistically significant difference from the simple validation method ( Table III ).
| Validation method | Real data | Simulation data | ||||
|---|---|---|---|---|---|---|
| Simple validation | 5-fold CV | 10-fold CV | Simple validation | 5-fold CV | 10-fold CV | |
| n = 50 | ||||||
| 5-fold CV | <0.001 ∗ | – | – | <0.001 ∗ | – | – |
| 10-fold CV | <0.001 ∗ | 0.096 | – | <0.001 ∗ | 0.182 | – |
| LOOCV | <0.001 ∗ | 0.037 | 0.312 | <0.001 ∗ | 0.053 | 0.243 |
| n = 100 | ||||||
| 5-fold CV | 0.002 ∗ | – | – | <0.001 ∗ | – | – |
| 10-fold CV | <0.001 ∗ | 0.213 | – | <0.001 ∗ | 0.281 | – |
| LOOCV | <0.001 ∗ | 0.109 | 0.331 | <0.001 ∗ | 0.169 | 0.352 |
| n = 150 | ||||||
| 5-fold CV | 0.005 ∗ | – | – | 0.003 ∗ | – | – |
| 10-fold CV | <0.001 ∗ | 0.170 | – | <0.001 ∗ | 0.340 | – |
| LOOCV | <0.001 ∗ | 0.089 | 0.345 | <0.001 ∗ | 0.223 | 0.363 |
| n = 200 | ||||||
| 5-fold CV | 0.004 ∗ | – | – | 0.166 | – | – |
| 10-fold CV | <0.001 ∗ | 0.230 | – | 0.104 | 0.365 | – |
| LOOCV | <0.001 ∗ | 0.149 | 0.381 | 0.058 | 0.235 | 0.353 |
| n = 400 | ||||||
| 5-fold CV | <0.001 ∗ | – | – | 0.190 | – | – |
| 10-fold CV | <0.001 ∗ | 0.268 | – | 0.096 | 0.300 | – |
| LOOCV | <0.001 ∗ | 0.162 | 0.357 | 0.062 | 0.208 | 0.385 |
| n = 800 | ||||||
| 5-fold CV | 0.035 | – | – | 0.190 | – | – |
| 10-fold CV | 0.012 | 0.146 | – | 0.140 | 0.420 | – |
| LOOCV | 0.006 ∗ | 0.043 | 0.256 | 0.120 | 0.360 | 0.440 |
Stay updated, free dental videos. Join our Telegram channel
VIDEdental - Online dental courses


