Introduction
Our objectives were to investigate the eruptive patterns of the mandibular teeth and assess their associations with mandibular growth displacements.
Methods
Cephalograms for a mixed-longitudinal sample of 124 French-Canadian girls were evaluated between 10 and 15 years of age. Vertical mandibular displacement and mandibular eruption were evaluated by using cranial and mandibular superimpositions, respectively. Multilevel modeling procedures were used to estimate each subject’s growth change over time. Stepwise multiple regressions were used to determine the amount and relative magnitudes of variations in mandibular eruption explained by mandibular growth displacement, controlling for vertical maxillary tooth movements.
Results
Cubic polynomial models explained between 91% and 98% of the variations in eruption and vertical growth displacement. All curves showed acceleration of eruption until approximately 12 years of age, after which eruption decelerated. The eruption of the mandibular teeth demonstrated greater relative variability than did vertical mandibular growth displacements. Independent of the overall movements of the maxillary molars, inferior mandibular growth displacement explained approximately 54% of the variation in mandibular molar eruption between 10.5 and 14.5 years of age.
Conclusions
Inferior mandibular growth displacement and dental eruption followed similar patterns of change during adolescence. Based on their associations and the differences in variability identified, mandibular eruption appears to compensate for or adapt to growth displacements.
The vertical positions of the teeth are thought to be maintained in a state of equilibrium between the forces of eruption and those that oppose it. Because the mandible undergoes greater vertical changes than the maxilla, equilibrium is constantly disrupted during growth. Superimpositions of the patients presented by Björk and Skieller suggest that those undergoing the greatest eruption also have the greatest vertical growth. Subjects with short and long faces show smaller and larger dentoalveolar heights, respectively; this further substantiates a relationship between growth and eruption. Clinically, compensatory eruptions of the molars and incisors have been associated with inferior mandibular displacement produced by functional appliances. Supraeruption has also been produced experimentally with bite-opening appliances, suggesting a direct relationship between mandibular displacement and eruption. Although there is indirect and experimental evidence supporting the association, there are currently no large-scale longitudinal studies available that were designed specifically to evaluate the association of mandibular tooth eruption and vertical mandibular displacement. To fully understand this relationship, the potentially confounding effects of maxillary tooth movements must be controlled for.
Available reference data pertaining to the eruption of the mandibular teeth are also limited. Because of bony remodeling on the nasal floor and the lower mandibular border, dentoalveolar heights provide biased estimates of eruption. Using metal implants as stable reference markers, Iseri and Solow showed an adolescent peak velocity for maxillary molar eruption of girls around 12 years of age, but no such peak for incisor eruption; the eruption of the mandibular teeth was not evaluated. Based on a large sample of untreated subjects with cephalograms superimposed on stable reference structures, Watanabe et al showed adolescent peak velocities for the eruption of the mandibular molars and incisors, but they did not evaluate the maxillary teeth.
The purposes of this study were to better understand eruption in untreated adolescents and to evaluate the relationships between the eruption and vertical growth displacements of the mandibular teeth. Multilevel modeling procedures were used to quantify the subjects’ growth patterns and to minimize cephalometric errors.
Material and methods
Cephalograms from a mixed longitudinal sample of 124 girls were evaluated annually between 10 and 15 years of age. The cephalograms evaluated (total of 650) were collected by the Human Growth and Research Center, University of Montreal, Quebec, Canada. The sample was drawn from 3 randomly selected school districts representing the socioeconomic backgrounds of the larger population. In each district, the subjects were randomly chosen from 107 randomly selected schools. The sample included subjects with normal occlusion and malocclusion. It was restricted to girls with 4 French-Canadian grandparents. No subject had undergone orthodontic or surgical treatment.
The cephalograms were traced, and 6 landmarks were digitized by the same technician ( Fig 1 ). Landmark method errors ( √∑d2/2n
∑ d 2 / 2 n
) ranged from 0.34 to 0.69 mm horizontally and 0.27 to 0.37 mm vertically. All measurements were corrected for radiographic enlargement (0.8892%) and evaluated relative to a horizontal reference plane (HRP). The HRP was registered on sella and oriented 18° below each subject’s SN plane on the initial cephalogram; 18° is the average SN-OP angle for 15 year-olds. Cranial-base and mandibular superimpositions were performed by using naturally stable reference structures. Reliability values for the cranial-base and the mandibular superimpositions were 0.984 to 0.997 and 0.936 to 0.966, respectively. After the superimposition of each subject’s successive tracings, the fiduciary marks and the HRP were transferred to the subsequent tracings.
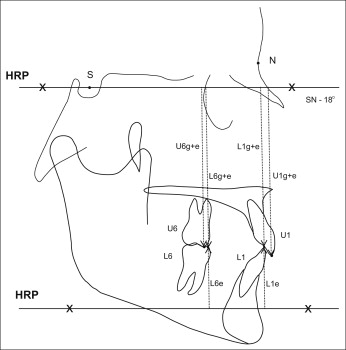
By using cranial-base superimpositions, overall vertical tooth movements were measured perpendicular to the HRP; overall movements represent the combined effects of vertical growth displacements plus dental eruption for the maxillary (U6g+e, U1g+e) and mandibular (L6g+e, L1g+e) teeth. Mandibular molar and incisor eruption (L6e, L1e) were also measured perpendicular to the HRP. Growth displacements of the mandibular incisors and molars (L1g, L6g) were calculated by subtracting each tooth’s eruption from the overall tooth movements (L1g+e−L1e, L6g+e−L6e). Overall maxillary tooth movements (U6g+e, U1g+e) were measured to control their potentially confounding effects when evaluating the relationships between mandibular eruption and growth displacements. Negative and positive values indicate changes in the inferior and superior directions, respectively.
Statistical analysis
All measurements were normally distributed. To reduce technical errors, the subjects’ tooth movements, eruption, and growth displacements were mathematically modeled over time by using the MLwiN and iterative generalized least squares. Starting with higher order (fifth) polynomials, successively lower-order models were fit until statistical significance was obtained for each measurement. Once the order of the model was established, the velocities were calculated from the first derivative of the polynomial.
The measurements were allowed to vary randomly at 2 levels: between subjects and between ages, nested within subjects. After the statistical significance of the models had been verified, the residuals of each polynomial term (constant, linear, quadratic, and cubic) were calculated for each subject. This allowed each subject’s curves to be calculated. For each of the 6 measurements, velocities were calculated every half year between 10.5 and 14.5 years of age. Descriptive statistics and stepwise multiple regressions were performed with SPSS software (version 15.0, SPSS, Chicago, Ill).
Results
All movements followed cubic polynomials, with the constant term representing the measurement at 12.5 years of age, the linear term representing velocity, the quadratic term representing acceleration, and the cubic term representing changes in acceleration. The polynomials explained between 91% and 98% of the variations in dental eruption and vertical growth displacement ( Table I ). Each curve showed velocities increasing (acceleration) through approximately 12 years of age; then velocities decreased (deceleration) regularly ( Fig 2 ).
| Constant | Linear | Quadratic | Cubic | Variation explained (%) | |||||
|---|---|---|---|---|---|---|---|---|---|
| Estimate | SE | Estimate | SE | Estimate | SE | Estimate | SE | ||
| L6e | 17.181 | 0.33 | 0.748 | 0.07 | −0.021 | 0.01 | −0.020 | 0.01 | 95.7 |
| L6g | −75.637 | 0.45 | −2.403 | 0.12 | 0.092 | 0.02 | 0.047 | 0.02 | 92.2 |
| U6g+e | −59.058 | 0.25 | −1.766 | 0.07 | 0.087 | 0.01 | 0.035 | 0.01 | 90.7 |
| L1e | 23.887 | 0.31 | 0.580 | 0.04 | −0.026 | 0.01 | −0.014 | 0.01 | 98.1 |
| L1g | −87.780 | 0.47 | −2.039 | 0.09 | 0.043 | 0.02 | 0.041 | 0.01 | 94.0 |
| U1g+e | −68.205 | 0.30 | −1.527 | 0.05 | 0.083 | 0.01 | 0.030 | 0.01 | 95.1 |
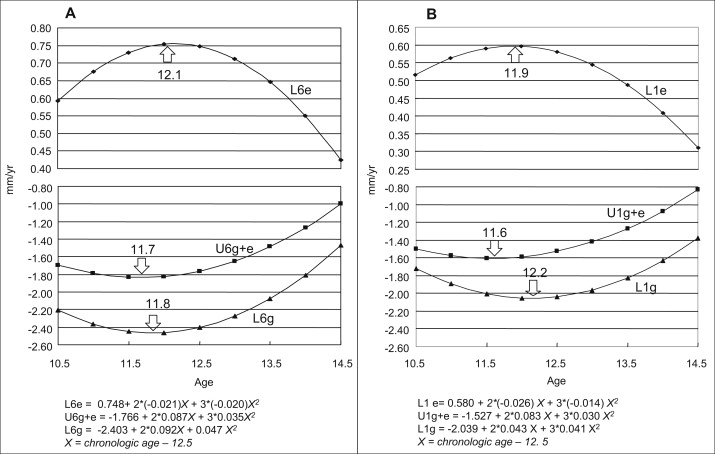
Mandibular molar eruption accelerated from 0.59 mm per year at 10.5 years of age to a peak of 0.76 mm per year at 12.1 years of age and then decelerated to 0.42 mm per year at 14.5 years of age ( Fig 2 , A ; Table II ). The rates of inferior displacement of the mandibular molars increased from 2.21 mm per year at 10.5 years to 2.46 mm per year at 11.8 years (peak velocity) and then decelerated to 1.47 mm per year at 14.5 years. The overall vertical movements of the maxillary molars increased from 1.69 mm per year to 1.84 mm per year at age 11.7 years and then decreased to 1.0 mm per year.
| Age (y) | L6e | L6g | U6g+e | ||||||
|---|---|---|---|---|---|---|---|---|---|
| Mean | SD | CV (%) | Mean | SD | CV (%) | Mean | SD | CV (%) | |
| 10.5 | 0.59 | 0.25 | 42.3 | −2.21 | 0.45 | 20.2 | −1.69 | 0.49 | 28.8 |
| 11.5 | 0.73 | 0.25 | 34.4 | −2.45 | 0.38 | 15.4 | −1.84 | 0.21 | 11.4 |
| 12.5 | 0.75 | 0.30 | 40.1 | −2.40 | 0.47 | 19.5 | −1.77 | 0.28 | 16.1 |
| 13.5 | 0.65 | 0.22 | 33.6 | −2.08 | 0.38 | 18.5 | −1.49 | 0.25 | 17.0 |
| 14.5 | 0.42 | 0.2 | 47.0 | −1.47 | 0.12 | 8.1 | −1.00 | 0.27 | 27.4 |
| L1e | L1g | U1g+e | |||||||
| 10.5 | 0.52 | 0.19 | 36.3 | −1.72 | 0.72 | 41.6 | −1.50 | 0.44 | 29.1 |
| 11.5 | 0.59 | 0.23 | 38.5 | −2.00 | 0.39 | 19.7 | −1.60 | 0.31 | 19.4 |
| 12.5 | 0.58 | 0.26 | 44.8 | −2.04 | 0.40 | 19.8 | −1.53 | 0.33 | 21.9 |
| 13.5 | 0.49 | 0.18 | 36.7 | −1.83 | 0.30 | 16.5 | −1.27 | 0.31 | 24.1 |
| 14.5 | 0.31 | 0.15 | 47.1 | −1.38 | 0.23 | 16.7 | −0.84 | 0.21 | 25.2 |
Stay updated, free dental videos. Join our Telegram channel
VIDEdental - Online dental courses


