Introduction
The aim of this study was to evaluate the effectiveness of the treatment of skeletal Class II malocclusions with an acrylic splint Herbst appliance anchored to miniscrews with 2 types of ligation.
Methods
Sixty patients (mean age, 11.6 years; SD, 1.9) with a bilateral Angle Class II Division 1 malocclusion were retrospectively selected and divided into 3 homogeneous and balanced groups on the basis of the Herbst anchorage used: without anchorage, miniscrews with elastic chains, and miniscrews with metallic ligatures. A cephalometric sagittal occlusion analysis merged with mandibular incisor proclination and skeletal divergence was carried out before and after treatment. To compare the absolute variations within and among the groups, we performed the 1-sample t test for repeated measures and 1-way analysis of variance, respectively.
Results
Overjet was reduced similarly in all groups ( P <0.05). The mandibular bone base length increased in the group with elastic chains only ( P = 0.001). The change in the distance between Point A and pogonion showed the most reduction in the group with elastic chains ( P <0.05). Incisive flaring was more pronounced in the group with no anchorage than in the group with elastic chains ( P <0.001) and the group with metallic ligatures ( P = 0.003).
Conclusions
Anchorage to miniscrews with elastic chains increases the orthopedic effect of the acrylic splint Herbst appliance. It has been confirmed that skeletal anchorage reduces incisor flaring.
Highlights
- •
We evaluated the effect of an acrylic splint Herbst appliance anchored with temporary anchorage devices (TADs).
- •
No anchorage, TADs with elastic chain, and TADs with metallic ligature were compared.
- •
Anchorage with TADs reduces incisor flaring in a clinically meaningful way.
- •
TADs ligated with elastic chain improve the orthopedic effect of the Herbst.
The Herbst appliance is largely used in orthodontics for the correction of Class II malocclusions, which are among the most common problems. It has been reported to be one of the most efficient among the different types of functional appliances, and it has become increasingly popular both because it does not require patient compliance and because the treatment time is short. Its effects are both dental and skeletal and include enhanced sagittal growth of the mandible and anterior displacement of the mandibular arch, together with reduced sagittal growth of the maxilla and posterior displacement of the maxillary arch and temporomandibular joint remodeling. In terms of disadvantages, it is well known that Herbst treatment causes proclination of the mandibular incisors because of anchorage loss in different amounts relative to the type of appliance used. Various modifications of the original Herbst, such as the insertion of Class III elastics, reduced cast splints, and total cast splints, have been proposed, but none has been able to completely eliminate the proclination of the mandibular incisors.
The introduction of skeletal anchorage into orthodontics not only has allowed for the simplification of many procedures conventionally used for the control of anchorage, but also has reduced the undesirable effects of many appliances. Some authors have demonstrated that such appliances can be used successfully for anchorage during orthodontic therapy. The possibility of combining Herbst appliances with skeletal anchorage has been previously described in the literature, and all of those studies reported reductions of mandibular incisor flaring. Yet no studies have compared different skeletal anchorage ligations. The aim of this study was to evaluate the effectiveness, in mandibular advancement and anchorage control, of a modified Herbst appliance anchored to miniscrews with 2 types of ligation.
Material and methods
The inclusion criteria for this study were patients who could benefit from Herbst treatment for a retrusive chin, who had a bilateral Angle Class II Division 1 malocclusion equal to or greater than half a cusp width, who were in the permanent or late mixed dentition, and whose parents had signed an informed consent. Exclusion criteria were poor oral hygiene and motivation, tooth agenesis or premature loss of permanent teeth, transverse or vertical discrepancies, and incomplete records. All patients were evaluated and treated by 1 operator (A.M.) and divided into 3 groups.
Group 1 (standard Herbst [SH]) consisted of 20 subjects treated with an acrylic splint Herbst and no miniscrews; it included 11 boys and 9 girls with a mean age of 11.3 years (SD, 1.7) ( Fig 1 , A ).
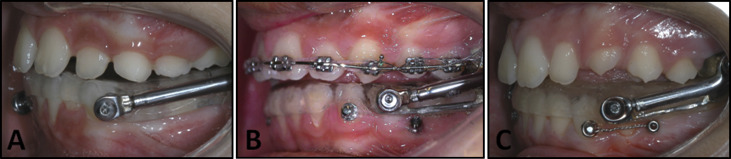
Group 2 (elastic chain [EC]) consisted of 20 subjects treated consecutively with an acrylic splint miniscrew Herbst anchored with temporary anchorage devices (TADs) and elastic chains; it included 10 boys and 10 girls with a mean age of 11.9 years (SD, 1.7). Miniscrews were placed between the mandibular first and second premolars or between the second premolars and the first molars in the attached gingiva and were ligated with elastic chains (Memory Chain; American Orthodontics, Sheboygan, Wis). During treatment, the elastic chains were replaced every 30 to 60 days ( Fig 1 , B ).
Group 3 (metallic ligature [ML]) consisted of 20 subjects treated consecutively with an acrylic splint miniscrew Herbst anchored with TADs and metallic ligatures; it included 11 boys and 9 girls with a mean age of 11.6 years (SD, 2.4). Miniscrews were placed between the mandibular first and second premolars or between the second premolars and the first molars in the attached gingiva and were ligated with metallic ligatures. During treatment, the ligatures were reactivated every 30 to 60 days ( Fig 1 , C ).
We chose subjects retrospectively by pairing the data to create groups homogeneous for age. Patients were selected also to balance the distribution of the sexes among the groups.
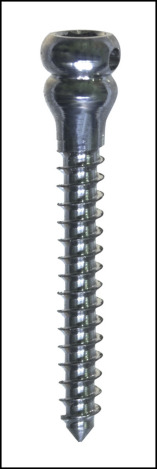
The miniscrews used (M.A.S.; Micerium, Avegno, Italy) were titanium, 11 mm long, and shaped like a truncated cone with diameters of 1.5 or 1.3 mm (according to the bone level) at the tip and 2.2 mm at the neck. The shanks of the screws measured 1 mm in diameter; the threaded part had a length of 9 to 11 mm, and the heads had a hexagonal slot that could house the head of the screwdriver or a contra-angle handpiece ( Fig 2 ).
Before insertion of the miniscrew, each patient rinsed his or her mouth with 0.1% chlorhexidine gluconate solution; predrilling was carried out, and the miniscrews were inserted with a manual screwdriver.
A metallic ligature or an elastic chain (100 g) linked the miniscrews to metallic buttons bonded to the mandibular canines on each side. Lateral cephalometrics were obtained from all patients before (T1) and at the end (T2) of the Herbst treatment before finishing with a fixed appliance, for evaluation of the outcome of the Herbst therapy only. The sagittal occlusion analysis of Pancherz (analysis of changes in the sagittal occlusion) was carried out for each patient at T1 and T2 for skeletal and dental changes. The operator (M.P.) was blinded to the groups’ classifications.
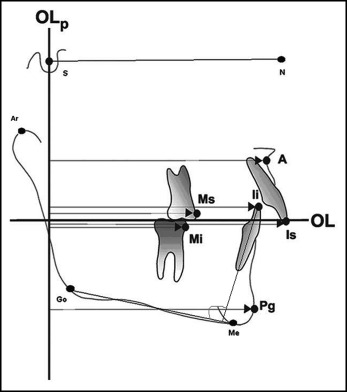
The occlusal line and the occlusal line perpendicular were transferred from the T1 to the T2 cephalometrics by superimposition of the radiographs on the stable bone structures of the anterior cranial base. Parameters not considered in the Pancherz sagittal occlusion analysis were also included, such as mandibular incisor proclination (Ii/GoMe) and skeletal divergence (SN/GoMe); the variables considered are shown in Table I and Fig 3 .
| Variable | Description |
|---|---|
| Vertical dimension | SN/GoMe, angle formed by the SN and GoMe lines (°) |
| Skeletal class | AN/NPg, angle formed by the AN and NPg lines (°) |
| Maxillary bone base | A/Olp, distance from Point A to the Olp line (mm) |
| Condylar position | Ar/Olp, distance from Ar to the Olp line (mm) |
| Mandibular bone base | Pg/Olp, distance from Pg to the Olp line (mm) |
| Skeletal discrepancy | A/Olp minus Pg/Olp, maxillary bone base minus mandibular bone base (mm) |
| Maxillary molar position | Ms/Olp, distance from Ms to the Olp line (mm) |
| Mandibular molar position | Mi/Olp, distance from Mi to the Olp line (mm) |
| Molar relationship | Ms/Olp − Mi/Olp; maxillary molar minus mandibular molar (mm) |
| Overjet | Is/Olp − Ii/Olp; maxillary incisor minus mandibular incisor (mm) |
| Maxillary incisor position | Is/Olp, distance from Is to the Olp line (mm) |
| Mandibular incisor position | Ii/Olp, distance from Ii to the Olp line (mm) |
| Mandibular incisor proclination | Ii/GoMe, angle formed by the mandibular incisor axis and the mandibular plane (GoMe) (°) |
The intraclass correlation coefficient (ICC) was estimated to assess the reliability of the measurements. The same operator (M.P.) repeated the measurements of 10 patients twice, with a 7-day interval between the recordings. The computed ICC was 99%, which reflected a high level of agreement.
Statistical analysis
Descriptive statistics (means and standard deviations) of all continuous variables were estimated, stratifying patients by appliance type (SH, EC, and ML). The normal distribution of the data was confirmed with a graphic visualization and the Shapiro-Wilk test.
The homogeneity at baseline of the 3 groups was tested by 1-way analysis of variance (ANOVA) followed by the multiple-comparison Bonferroni test.
In each group, the changes in cephalometric parameters, after vs before treatment (T2 − T1), were statistically analyzed with the 1-sample t test for repeated measures.
To compare the absolute variations in cephalometric values after treatment among the 3 groups, we performed 1-way ANOVA and the Bonferroni test. The power of the test was also calculated.
For evaluation of the change in the distance between pogonion and Point A, a new variable was generated: the difference between the maxillary bone base (A/Olp distance) and the mandibular bone base (Pg/Olp distance). This distance was called the skeletal discrepancy.
The α level was fixed at P = 0.05.
All data were analyzed with Stata software (version 12; StataCorp, College Station, Tex).
The sample size was estimated on the basis of data published by Manni et al and hypothesized a minimum difference in pogonion advancement of 2.0 mm among the groups (SD, 2.0; power = 0.8; α level = 0.05). Under these conditions, the output was 16 patients per group.
Results
Following the Herbst therapy, all subjects were successfully treated with comprehensive braces to a bilateral Class I relationship. The mean treatment times (from T1 to T2) were 7.4 months (SD, 0.8) in the SH group, 7.5 months (SD, 0.8) in the EC group, and 7.4 months (SD, 1.0) in the ML group. Mean treatment duration was consistent with the treatment time reported by Baltromejus et al. Fourteen miniscrews had to be replaced because of their mobility during treatment. We registered 2 screw failures in 3 patients (1 patient in the ML group and 2 patients in the EC group), and 1 screw failure in each of 4 patients in both the ML and EC groups, for totals of 8 failures in the EC group and 6 failures in the ML group.
Descriptive statistics and statistical analyses are summarized in Table II .
| SH group (n = 20) | EC group (n = 20) | ML group (n = 20) | Comparison of groups at T1 ∗ ( P ) | |
|---|---|---|---|---|
| Ratio of boys to girls | 11:9 | 10:10 | 11:9 | – |
| T1 age (y), mean (SD) | 11.3 (1.7) | 11.9 (1.7) | 11.6 (2.4) | 0.5856 |
| Vertical dimension (SN/GoMe) (°), mean (SD) | 32.2 (6.1) | 34.2 (6.7) | 32.8 (7.2) | 0.5908 |
| Skeletal class (AN/NPg) (°), mean (SD) | 5.7 (2.3) | 5.1 (2.9) | 4.4 (2.5) | 0.2922 |
| Maxillary bone base (A/Olp) (mm), mean (SD) | 77.1 (3.2) | 79.3 (4.4) | 78.6 (4.3) | 0.2024 |
| Condylar position (Ar/Olp) (mm), mean (SD) | 8.5 (3.8) | 9.2 (3.3) | 10.1 (2.9) | 0.3448 |
| Mandibular bone base (Pg/Olp) (mm), mean (SD) | 77.9 (5.1) | 81.7 (6.0) | 80.2 (4.7) | 0.0782 |
| Maxillary molar position (Ms/Olp) (mm), mean (SD) | 52.4 (4.2) | 54.9 (4.5) | 54.3 (5.9) | 0.2444 |
| Mandibular molar position (Mi/Olp) (mm), mean (SD) | 50.3 (4.8) | 53.8 (5.1) | 53.0 (6.6) | 0.1243 |
| Molar relationship (Ms/Olp-Mi/Olp) (mm), mean (SD) | 2.1 (2.0) | 1.1 (1.6) | 1.4 (2.0) | 0.2307 |
| Overjet (Is/Olp-Ii/Olp) (mm), mean (SD) | 7.3 (2.4) | 5.8 (1.8) | 7.6 (2.5) | 0.0281 † |
| Maxillary incisor position (Is/Olp) (mm), mean (SD) | 84.2 (4.2) | 85.8 (4.9) | 86.8 (5.3) | 0.2478 |
| Mandibular incisor position (Ii/Olp) (mm), mean (SD) | 76.9 (4.2) | 80.1 (4.9) | 79.2 (5.1) | 0.1011 |
| Mandibular incisor proclination (Ii/GoMe) (°), mean (SD) | 94.7 (5.3) | 99.0 (6.8) | 99.6 (5.3) | 0.0178 ‡ |
∗ One-way ANOVA; F 2,57 ; α level P <0.05.
† Bonferroni test: differences were significant between the EC and ML groups ( P = 0.040).
‡ Bonferroni test: differences were significant between the EC and SH groups ( P = 0.017) and between the ML and SH groups ( P = 0.046).
The 3 groups of patients were homogeneous at T1 for the ratios of boys to girls. No differences were estimated in vertical dimension, skeletal class, maxillary bone base, condylar position, molar position, and maxillary incisor position ( P >0.05). The only differences were found in overjet and mandibular incisor proclination. Overjet was larger in the SH group (mean, 7.3 mm; SD, 2.4) and the ML group (mean, 7.6 mm; SD, 2.5) compared with the EC group (mean, 5.8 mm; SD, 1.8). However, a significant difference was found between the ML and EC groups (ANOVA, F 2,57 = 3.80, P = 0.0281; Bonferroni test, P = 0.040). Mandibular incisor proclination showed a difference among the groups (ANOVA, F 2,57 = 4.32, P = 0.0178). The incisors were more proclined in the EC group (mean, 99.0 mm; SD, 6.8) and the ML group (mean, 99.6 mm; SD, 5.3) compared with the SH group (mean, 94.7 mm; SD, 5.3). It resulted in a marginally significant difference between the EC and SH groups (Bonferroni test, P = 0.065) and a significant difference between the ML and SH groups (Bonferroni test, P = 0.027), but not between the ML and EC groups.
For the changes after Herbst treatment, summary statistics and statistical analyses are reported in Tables III and IV .
- 1.
Vertical dimension (SN/GoMe angle). The mandibular plane did not change during Herbst treatment in any group.
- 2.
Skeletal class (AN/NPg angle). All groups showed a significant reduction in the AN/NPg angle: −2.4° (SD, 1.4; t test, P <0.001) in the EC group, 1.2° (SD, 1.7; t test, P = 0.005) in the ML group, and −2.0° (SD, 2.0; t test, P <0.001) in the SH group. These amounts were not statistically different in the comparison among the groups (ANOVA, F 2,57 = 2.2; P = 0.120).
- 3.
Maxillary bone base (A/Olp distance). All groups showed a limited reduction in the maxillary bone base distance. In the ML group (mean, −0.8 mm; SD, 1.8), it was marginally significant ( t test, P = 0.054). However, the difference among groups was not significant (ANOVA, F 2,57 = 0.01; P = 0.992).
- 4.
Condylar position (Ar/Olp distance). Condyle distance from the vertical line Olp increased slightly after treatment in all groups without reaching significance in the groups and in the comparisons among the groups.
- 5.
Mandibular bone base (Pg/Olp distance). All groups had an increase in mandibular bone base length. However, the positive change was significant in the EC group only, amounting to 2.8 mm (SD, 3.2; t test, P = 0.001), compared with 0.8 mm (SD, 3.3) in the ML group ( t test, P = 0.328) and 0.3 mm (SD, 2.5) in the SH group ( t test, P = 0.591). The comparison among the groups estimated a significant difference between the EC and SH groups (ANOVA, F 2,57 = 3.91; P = 0.026; Bonferroni test, P = 0.033).
- 6.
Skeletal discrepancy (A/Pg distance: A/Olp minus Pg/Olp). To estimate the change in the distance between Point A and pogonion—ie, the combined effect of the change in maxillary bone base and mandibular bone base—we generated the new variable skeletal discrepancy as the difference in the A/Olp and Pg/Olp distances.
The skeletal discrepancy was reduced in all groups. The reductions were significant in the EC group (mean, −3.6; SD, 2.3; t test, P <0.001) and the ML group (mean, −1.6; SD, 2.4; t test, P = 0.009), but not in the SH group (mean, −1.1; SD, 2.5; t test, P = 0.072). The comparison among groups was significant (ANOVA, F 2,57 = 6.04, P = 0.0042). The reduction in the EC group was greater than in the ML group (Bonferroni test, P = 0.035) and the SH group (Bonferroni test, P = 0.005). The variation of the ML group was not different from that of the SH group (Bonferroni test, P = 1.000).
- 7.
Maxillary molar (Ms/Olp distance) and mandibular molar (Mi/Olp distance) positions. The maxillary molars moved significantly back, and the mandibular molars moved significantly forward in all groups, with no differences among the groups (maxillary molar position, ANOVA, F 2,57 = 1.17, P = 0.317; mandibular molar position, ANOVA, F 2,57 = 0.2, P = 0.821).
The maxillary molar position was reduced by −1.7 mm (SD, 2.7; t test, P = 0.013) in the EC group, by −1.2 mm (SD, 2.5; t test, P = 0.046) in the ML group, and by −2.5 mm (SD, 2.8; t test, P = 0.001) in the SH group.
The mandibular molar position was increased by 3.5 mm (SD, 3.3; t test, P <0.001) in the EC group, by 2.8 mm (SD, 4.2; t test, P = 0.007) in the ML group, and by 3.0 mm (SD, 2.6; t test, P <0.001) in the SH group. As a consequence of these changes, the molar relationship distance (Ms/Olp-Mi/Olp) showed a reduction in all 3 groups.
- 8.
Overjet (Is/Olp-Ii/Olp distance). Overjet decreased similarly and significantly after treatment in all groups. However, although the changes in the groups were significant, the intergroup comparison was not (ANOVA, F 2,57 , 1.49; P = 0.234). It was reduced by −2.7 mm (SD, 1.7; t test, P <0.001) in the EC group, by −3.7 mm (SD, 2.3; t test, P <0.001) in the ML group, and by −3.8 mm (SD, 2.4; t test, P = 0.001) in the SH group.
- 9.
Maxillary incisor position (Is/Olp distance). Maxillary incisor position increased slightly but not significantly in the EC group (mean, 0.5; SD, 2.8; t test, P = 0.440) and decreased in the ML group (mean, −1.3; SD, 2.1; t test, P = 0.012). In the SH group, there was also a reduction but without statistical significance (mean, −0.8; SD, 3.3; t test, P = 0.288). The comparison among the group changes was not significant (ANOVA, F 2,57 = 2.24, P = 0.115).
- 10.
Mandibular incisor position (Ii/Olp distance) and proclination (Ii/GoMe angle). The mandibular incisor position is the distance between the Olp line and the Ii point and combines 2 distances, mandibular bone base length and mandibular incisor proclination. This distance increased in all 3 groups after treatment (EC group, mean, 3.2 mm, SD, 3.8; t test, P <0.001; ML group, mean, 2.4 mm, SD, 2.6; t test, P = 0.001; SH group, mean 3.0 mm, SD, 2.6; t test, P <0.001). The change was not different among the groups (ANOVA, F 2,57 , 0.45; P = 0.639).
When the mandibular incisor proclination was considered exclusively, only the ML and SH groups showed significant increases in incisor flaring (EC group, mean, 1.5°, SD, 5.6; t test, P = 0.248; ML group, mean, 3.5°, SD, 4.2; t test, P = 0.002; SH group, mean, 9.1°, SD, 5.0; t test, P <0.001). The change reached significance in the comparison among groups (ANOVA, F 2,57 = 12.37; P <0.001). The EC group (Bonferroni test, P <0.001) and the ML group (Bonferroni test, P = 0.003) had less incisive flaring than did the SH group. The difference between the EC and ML groups was not significant (Bonferroni test, P = 0.618).
| SH group (n = 20) | EC group (n = 20) | ML group (n = 20) | |
|---|---|---|---|
| Vertical dimension (SN/GoMe) (°), mean (SD) | 32.7 (6.8) | 33.5 (5.1) | 32.2 (6.6) |
| Skeletal class (AN/NPg) (°), mean (SD) | 3.8 (2.0) | 2.8 (2.9) | 3.2 (3.0) |
| Maxillary bone base (A/Olp) (mm), mean (SD) | 76.3 (3.7) | 78.6 (4.8) | 77.7 (4.3) |
| Condylar position (Ar/Olp) (mm), mean (SD) | 9.0 (3.3) | 9.8 (3.7) | 10.8 (3.1) |
| Mandibular bone base (Pg/Olp) (mm), mean (SD) | 78.2 (6.6) | 84.5 (6.7) | 81.0 (5.4) |
| Maxillary molar position (Ms/Olp) (mm), mean (SD) | 49.9 (4.8) | 53.2 (4.6) | 53.2 (5.6) |
| Mandibular molar position (Mi/Olp) (mm), mean (SD) | 53.3 (5.3) | 57.3 (5.8) | 55.8 (5.1) |
| Molar relationship (Ms/Olp-Mi/Olp) (mm), mean (SD) | −3.4 (2.5) | −4.1 (2.9) | −2.6 (2.4) |
| Overjet (Is/Olp-Ii/Olp) (mm), mean (SD) | 3.7 (1.6) | 3.1 (1.2) | 3.9 (1.7) |
| Maxillary incisor position (Is/Olp) (mm), mean (SD) | 83.4 (5.2) | 86.3 (4.9) | 85.5 (5.5) |
| Mandibular incisor position (Ii/Olp) (mm), mean (SD) | 79.9 (5.0) | 83.2 (4.9) | 81.6 (5.1) |
| Mandibular incisor proclination (Ii/GoMe) (°), mean (SD) | 103.8 (7.9) | 100.5 (7.4) | 103.2 (4.8) |
| SH group (n = 20) | EC group (n = 20) | ML group (n = 20) | Comparisons among groups ∗ | |||||||||
|---|---|---|---|---|---|---|---|---|---|---|---|---|
| Mean (SD) | 95% CI | P † | Mean (SD) | 95% CI | P † | Mean (SD) | 95% CI | P † | F | P | Power (%) | |
| Vertical dimension (SN/GoMe) (°) ‡ | +0.5 (2.6) | −0.8 to 1.7 | 0.4493 | −0.7 (2.3) | −1.8 to 0.4 | 0.185 | −0.7 (2.3) | −1.7 to 0.4 | 0.199 | 1.51 | 0.229 | 65 |
| Skeletal class (AN/NPg) (°) ‡ | −2.0 (2.0) | −2.9 to −1.0 | 0.0003 | −2.4 (1.4) | −3.0 to −1.7 | <0.001 | −1.2 (1.7) | −2.0 to −0.4 | 0.005 | 2.2 | 0.120 | 90 |
| Maxillary bone base (A/Olp) (mm) § | +0.8 (2.0) | −0.2 to 1.7 | 0.118 | +0.8 (2.5) | −0.4 to 1.9 | 0.194 | +0.8 (1.8) | 0.0 to +1.7 | 0.054 | 0.01 | 0.992 | 5 |
| Condilar position (Ar/Olp) (mm) ‡ | +0.5 (2.2) | −0.6 to 1.5 | 0.3793 | +0.6 (2.3) | −0.5 to 1.7 | 0.267 | +0.7 (2.3) | −0.4 to 1.8 | 0.180 | 0.06 | 0.941 | 69 |
| Mandibular bone base (Pg/Olp) (mm) ‖ | +0.3 (2.5) | −0.8 to 1.4 | 0.591 | +2.8 (3.2) | 1.3 to 4.3 | 0.001 | +0.8 (3.3) | −0.8 to 2.3 | 0.328 | 3.91 | 0.026 ¶ | 99 |
| Skeletal discrepancy (A/Pg distance: A/Olp-Pg/Olp) (mm) § | +1.1 (2.5) | −0.1 to 2.2 | 0.072 | +3.6 (2.3) | 2.5 to 4.6 | <0.001 | +1.6 (2.4) | 0.4 to 2.7 | 0.009 | 6.04 | 0.004 # | 100 |
| Maxillary molar position (Ms/Olp) (mm) ∗∗ | +2.5 (2.8) | 1.1 to 3.8 | 0.0011 | +1.7 (2.7) | 0.4 to 2.9 | 0.013 | +1.2 (2.5) | 0.0 to 2.3 | 0.046 | 1.17 | 0.317 | 64 |
| Mandibular molar position (Mi/Olp) (mm) †† | +3.0 (2.6) | 1.7 to 4.2 | 0.0001 | +3.5 (3.3) | 1.9 to 5.0 | <0.001 | +2.8 (4.2) | 0.8 to 4.8 | 0.007 | 0.2 | 0.821 | 14 |
| Molar relationship (Ms/Olp-Mi/Olp) (mm) ∗∗ | +5.4 (2.8) | 4.1 to 6.7 | <0.001 | +5.1 (3.1) | 3.6 to 6.6 | <0.001 | +4.0 (3.1) | 2.4 to 5.4 | <0.001 | 1.36 | 0.264 | 67 |
| Overjet (Is/Olp-Ii/Olp) (mm) ‡ ‡‡ | +3.8 (2.4) | 2.5 to 4.8 | 0.001 | +2.7 (1.7) | 1.9 to 3.4 | <0.001 | +3.7 (2.3) | 2.6 to 4.8 | <0.001 | 1.49 | 0.234 | 65 |
| Maxillary incisor position (Is/Olp) (mm) ‡‡ | +0.8 (3.3) | −0.7 to 2.3 | 0.2876 | −0.5 (2.8) | −1.8 to 0.8 | 0.440 | +1.3 (2.1) | 0.3 to 2.3 | 0.012 | 2.24 | 0.115 | 89 |
| Mandibular incisor position (Ii/Olp) (mm) §§ | +3.0 (2.6) | 1.7 to 4.2 | 0.0001 | +3.2 (2.8) | 1.9 to 4.4 | <0.001 | +2.4 (2.6) | 1.1 to 3.6 | 0.001 | 0.45 | 0.639 | 27 |
| Mandibular incisor proclination (Ii/GoMe) (°) ‡ | +9.1 (5.0) | 6.7 to 11.5 | <0.001 | +1.5 (5.6) | −1.1 to 4.1 | 0.248 | +3.5 (4.2) | 1.5 to 5.5 | 0.002 | 12.37 | <0.001 ‖‖ | 100 |
Stay updated, free dental videos. Join our Telegram channel
VIDEdental - Online dental courses


