Fig. 6.1
Schematic of the two-step thermal oxidation process
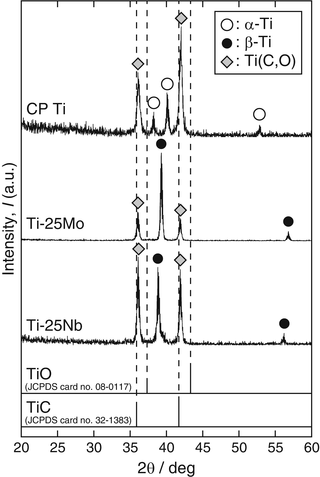
The α-2θ XRD patterns (α = 0.3°, Cu Kα) of the reaction layer on CP Ti, Ti-25mass%Mo (Ti-25Mo) alloy, and Ti-25mass%Nb (Ti-25Nb) alloy after the first-step treatment in Ar-1%CO at 1,073 K for 3.6 ks are shown in Fig. 6.2. Reflections that are located close to but at a slightly higher angle than those of TiC are observed. It is known that oxygen substitution in a carbon site decreases the lattice parameter of TiC [42]; in fact, the reflections of the reaction layer are located between those of TiC and TiO as shown in Fig. 6.2. In addition, chemical composition analysis by X-ray photoelectron spectroscopy (XPS) revealed the presence of oxygen in the reaction layer as well as carbon and Ti [11]. From these results, the phase of the reaction layer is considered to be Ti(C,O). In the case of using an N2-CO gas atmosphere in the first step, a Ti(C,N,O) reaction layer was formed [12]. Figure 6.3a, b depict potential diagrams of Ti-C-O and Ti-C-N-O systems respectively, at 1,100 K [11, 12]. The chemical composition of Ti(C,O) and Ti(C,N,O) phases was arbitrarily chosen as TiC0.5O0.5 because of the lack of reliable thermodynamic data for these phases. The relationship between carbon activity (a C) and oxygen partial pressure ( ) suggests that the TiC0.5O0.5 phase is thermodynamically stable at a CO partial pressure (P CO) of 0.01 atm, which corresponds to Ar-1%CO and N2-1%CO.
) suggests that the TiC0.5O0.5 phase is thermodynamically stable at a CO partial pressure (P CO) of 0.01 atm, which corresponds to Ar-1%CO and N2-1%CO.
Fig. 6.2
α-2θ XRD patterns of the reaction layers on CP Ti, Ti-25Mo alloy, and Ti-25Nb alloy after first-step treatment in Ar-1%CO at 1,073 K for 3.6 ks
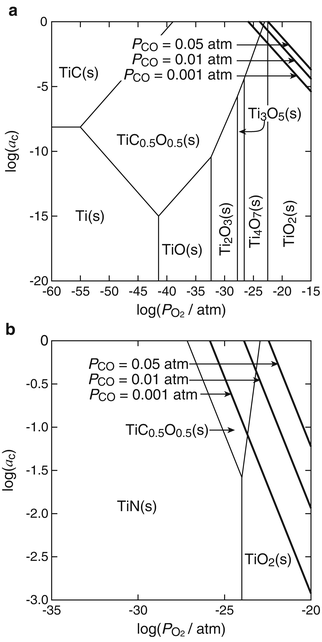
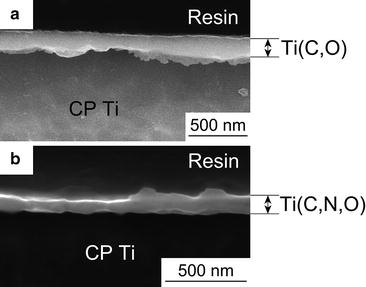
Figure 6.4 shows cross-sectional SEM images of the Ti(C,O) and Ti(C,N,O) layers, which were formed in Ar-1%CO and N2-1%CO, respectively. From the images, it was confirmed that the films were dense and uniform.
The phase fraction in TiO2 layers formed on CP Ti, Ti-25Mo alloy, and Ti-25Nb alloy at different second-step temperatures and holding times are summarized in Fig. 6.5a–c, respectively [13]. The first-step treatment was carried out in Ar-1%CO at 1,073 K for 3.6 ks, and the reaction layer was confirmed to be Ti(C,O) single phase after the first-step. The phase fractions of anatase and rutile in TiO2 layer were calculated using the equation given by Spurr and Myers [45]. The anatase-rich TiO2 layers were formed for second-step temperatures between 673 and 873 K. At a lower temperature of 573 K, single-phase anatase was produced, but the Ti(C,O) phase remained, indicating that the oxidation reaction from Ti(C,O) to TiO2 was not completed in the second step. On the other hand, thermodynamically stable rutile was a main phase in the TiO2 layers for the higher second-step temperatures of 973 and 1,073 K. At these higher temperatures, rutile single phase was detected on CP Ti, while anatase was detected as a minor phase on Ti-25Mo and Ti-25Nb alloys. Moreover, the anatase fraction in the TiO2 layer on Ti-25Mo and Ti-25Nb alloys was higher than on CP Ti at mid-level temperatures of 773 and 873 K. The formation window for anatase in two-step thermal oxidation of Ti alloys is wider than that of CP Ti.
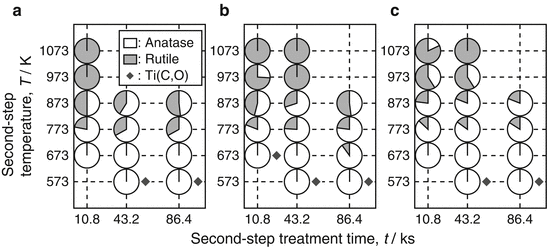
Fig. 6.5
Phase fraction of the reaction layer on (a) CP Ti, (b) Ti-25Mo alloy, and (c) Ti-25Nb alloy after the second-step treatment in air [13]. Grey and white parts in small circles show rutile and anatase fractions, respectively
Anatase irreversibly transforms to rutile at high temperatures, and the larger the valence number and ionic radius of dopants in TiO2, the more suppressed the anatase-to-rutile transformation: the transformation is enhanced by relaxation of the large oxygen sublattice through the increased presence of oxygen vacancies [46]. Figure 6.6 shows the comprehensive valence/radius plot of the anatase-to-rutile transformation, categorizing TiO2 dopants as inhibiting or promoting [46]. From this figure, Mo and Nb are likely inhibiting dopants. The incorporation of Mo and Nb into the TiO2 layer during two-step thermal oxidation process may have resulted in the presence of anatase on the Ti alloys at higher second-step temperatures and the higher anatase fraction at mid-level temperatures.
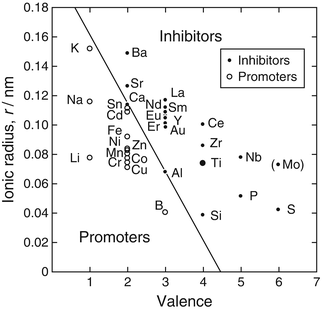
Fig. 6.6
Comprehensive valence/radius plot of anatase-to-rutile transformation, categorizing dopants as inhibiting or promoting [46]
The formation of the Ti(C,O) or Ti(C,N,O) single phase during the first step and optimization of the second-step temperature are required for preparing an anatase-rich TiO2 layer on Ti and Ti alloys. We varied CO partial pressures in the first-step treatment between Ar- or N2-0.1%CO and 20%CO. The rutile phase tended to form to a greater degree in the first-step treatment under higher partial pressures (up to 20 %) of CO gas, because of its high oxidizing potential.
Figure 6.7a, b show a cross-sectional TEM image and an electron diffraction pattern, respectively, of the anatase + rutile TiO2 layer formed on CP Ti after a second-step treatment at 673 K that was preceded by a first-step treatment at 1,073 K in N2-1%CO [12]. Nanoscale crystallites of anatase and rutile are observed. The thickness of the TiO2 layer formed in the second-step at 873 K was much greater than that formed in the 573–773 K range [12]. This result suggests that the formation of the rutile phase at higher second-step temperatures is also caused by direct oxidation of metallic Ti after completion of oxidation of the Ti(C,O) or Ti(C,N,O) layer.
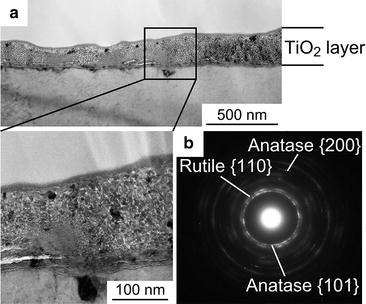
Fig. 6.7
(a) Cross-sectional TEM image and (b) electron diffraction pattern of the TiO2 layer formed on CP Ti after two-step thermal oxidation [12]
Bonding strength of the anatase-rich TiO2 layer to the CP Ti substrate was evaluated by a pulling test using an Al stud, and was greater than the strength of the epoxy glue (60–70 MPa) used for bonding between the TiO2 layer and the Al stud [14]. The high bonding strength is an advantage of the thermal oxidation process over wet processes such as anodic oxidation.
6.4 Evaluation of Photocatalytic Activity of TiO2 Layers Formed by Two-Step Thermal Oxidation
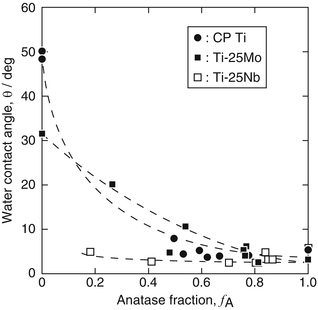
The photocatalytic activity of TiO2 layers prepared on CP Ti, Ti-25Mo alloy, and Ti-25Nb alloy was evaluated for water contact angle, decomposition of methylene blue (MB), and antibacterial effect under UV irradiation. Figure 6.8 shows the average water contact angle obtained for UV irradiation times of 3.6–7.2 ks with an irradiance of 1 mW ċ cm−2 as a function of anatase fraction (f A) in TiO2 layers [13]. The water contact angle decreased with increasing f A, and in particular, a water contact angle less than 5° was achieved on TiO2 layers for an f A higher than 0.6. It is confirmed that anatase is effective for expression of superhydrophilicity. Meanwhile, in the case of Ti-25Nb alloy, a low water contact angle was observed even on TiO2 layers with lower f A values such as 0.2 and 0.4. The effect of Nb doping on the photocatalytic activity of TiO2 was reported to be complex [47]. Further studies on the chemical state, concentration, and distribution of Nb in the TiO2 layer are required. The water contact angle increased again under dark condition after UV irradiation; however, the hydrophobization rate was reduced in TiO2 layers with high f A.
Stay updated, free dental videos. Join our Telegram channel
VIDEdental - Online dental courses


