Introduction
Genetic influences on the development of malocclusion include heritable effects on both masticatory muscles and jaw skeletal morphology. Beyond genetic variations, however, the characteristics of muscle and bone are also influenced by epigenetic mechanisms that produce differences in gene expression. We studied 2 enzymes known to change gene expressions through histone modifications, chromatin-modifying histone acetyltransferase KAT6B and deacetylase HDAC4 , to determine their associations with musculoskeletal variations in jaw deformation malocclusions.
Methods
Samples of masseter muscle were obtained from subjects undergoing orthognathic surgery from 6 malocclusion classes based on skeletal sagittal and vertical dysplasia. The muscles were characterized for fiber type properties by immunohistochemistry, and their total RNA was isolated for gene expression studies by microarray analysis and quantitative real-time polymerase chain reaction.
Results
Gene expressions for fast isoforms of myosins and contractile regulatory proteins and for KAT6B and HDAC4 were severalfold greater in masseter muscles from a patient with a deepbite compared with one with an open bite, and genes related to exercise and activity did not differ substantially. In the total population, expressions of HDAC4 ( P = 0.03) and KAT6B ( P = 0.004) were significantly greater in subjects with sagittal Class III than in Class II malocclusion, whereas HDAC4 tended to correlate negatively with slow myosin type I and positively with fast myosin gene, especially type IIX.
Conclusions
These data support other published reports of epigenetic regulation in the determination of skeletal muscle fiber phenotypes and bone growth. Further investigations are needed to elucidate how this regulatory model might apply to musculoskeletal development and malocclusion.
The etiology of dentofacial deformities and malocclusion is multifactorial and includes genetic, behavioral, and environmental components. The soft-tissue envelope, including the muscles of mastication, contributes to the development of jaw deformation by exerting variable loads during stretching and contractile activities. An example of how changes in masticatory muscle activity influence skeletal structures is the development of open-bite malocclusion in children with Duchenne muscular dystrophy. Open bite in these patients is often progressive because of decreasing muscle function as the condition exacerbates with age. Previous studies have also demonstrated an association between masticatory muscle fiber type, size, and numbers with the development of open-bite and deep-bite malocclusions.
Skeletal muscles are composed of mixtures of fiber types, and each type is associated with specific functional characteristics. What causes variations in fiber type properties that are so closely associated with differences in facial skeletal morphology during growth remains an interesting question in the clinical treatment of dentofacial deformities. The importance of genetic variations (gene polymorphisms) in the growth of muscle and bone is currently being explored and highlighted by genome-wide association studies. Epigenetic factors, the mechanisms that change gene expression, must also be explored to determine how genetic influences, beyond primary DNA structure, contribute to growth and facial phenotype. Epigenetic mechanisms can often include acetylation of lysine residues in histone chromatin proteins by acetyltransferase ( KAT ) and deacetylase ( HDAC ) enzymes. In eukaryotic cell nuclei, genomic DNA is folded around octamers of the core histone proteins H2A, H2B, H3, and H4 to form nucleosomes. Nucleosomes are further compacted into chromatin fibers. Histone modification through acetylation can regulate transcription by promoting conformational changes in regions of chromatin, making them more accessible to transcriptional complexes.
Our earlier findings demonstrated that increases in the size and proportion of fast-contracting type II fibers in masticatory muscle are a key environmental influence on the development of skeletal deepbite malocclusion. Among the several molecular mechanisms that might influence fiber type variations is a model of epigenetic regulation in which increased acetylation promotes an open conformation of chromatin domains containing the genes for fast-type myosin heavy chain (MHC) gene expression in a rat model. Conversely, increased deacetylation promotes a closed chromatin confirmation in chromatin areas to limit accessibility of transcriptional complexes to the slow-contracting (type I) MHC gene. Because of the large variations in fiber types identified in human masseter muscles, it is of interest to determine what role chromatin acetylation/deacetylation plays in fiber composition and MHC gene expression during the development of malocclusion. To address this question, we have begun to evaluate expression of the genes for K (lysine) acetyltransferase 6B ( KATB4 ) and histone deacetylase 4 ( HDAC4 ) and contractile proteins in masseter muscle samples from orthognathic surgery patients to assess whether there are associations with malocclusion.
Material and methods
Recruitment was from patients undergoing orthognathic surgery for treatment of malocclusion in the Hôpital Roger Salengro, Service de Chirurgie Maxillo-Faciale et Stomatologie, Centre Hospitalier Universitaire, in Lille, France. During the mandibular bilateral sagittal split osteotomy surgical procedure, a small sample of masseter muscle, usually discarded as clinical waste, was collected for study in accordance with the approvals of the French Committee for Personal Protection and the Temple University institutional review board. Either unilateral or bilateral masseter samples about 0.5 cm 3 were snap frozen and stored until shipped to Dr Sciote’s laboratory. Muscle tissue was consistently taken from a point on the superficial area of the deep portion of the masseter muscle about 1.5 cm from the lowest point of the mandible’s angle during bilateral sagittal split mandibular osteotomy procedures. Fibers in this area are oriented at almost right angles to the Frankfort horizontal plane and are activated for maintenance of jaw posture. This area’s ability to control jaw position in tonus is evidenced by exceptionally large muscle spindles, with the highest muscle spindle density. Consistency of sampling is evidenced when samples from both left and right masseter muscle were compared because there were no significant differences for either mean fiber type area or fiber type percentage of occupancy in the muscle sample between sides.
Malocclusion classification was based on the surgical treatment plan and the presurgical orthodontic diagnosis, which was confirmed in an independent review of the cephalograms at Temple University. The surgical team in Lille uses the analysis of Delaire et al for malocclusion classification during treatment planning for surgical procedures. In addition to being the most popular cephalometric analysis among orthodontists in France, this classification is particularly useful for surgical treatment planning since it clearly shows maxillofacial deformities that need correction to balance the facial skeleton. Diagnostic groupings were confirmed by the orthodontists in Philadelphia using the metric method first proposed by Bjork. Rather than geometric measurements traditionally used in cephalometry, the metric method confirms the presence of most of the 7 structural signs of growth rotation to characterize skeletal dysplasia in the vertical and sagittal dimensions. More recently, the metric method has been validated as perhaps a better classification approach when compared with cephalometric measurements for diagnosis of open-bite malocclusions. Overall, our subjects had jaw deformities that were morphogenetic and not caused by functional behaviors such as thumb-sucking or other oral habits. Representative cephalograms of our subjects have been presented previously in articles by Rowlerson et al (Fig 5) and Sciote et al (Fig 1). After confirmation of the diagnoses, the subjects were placed into 1 of 6 malocclusion classifications based on sagittal and vertical dysplasia: either skeletal sagittal Class II or Class III, or vertical open, normal, or deepbite ( Table I ). All clinical information and tissue samples were deidentified, and the masseter muscles were stored at −800°C before processing and analysis.
| Average age (y) | Vertical class | Total ( n ) | Sagittal class | ||
|---|---|---|---|---|---|
| Class II | Class III | ||||
| Female ( n = 22) | 20.2 | Normal bite | 7 | 4 | 3 |
| Open bite | 12 | 8 | 4 | ||
| Deepbite | 3 | 2 | 1 | ||
| Male ( n = 19) | 20.1 | Normal bite | 5 | 3 | 2 |
| Open bite | 6 | 3 | 3 | ||
| Deepbite | 8 | 4 | 4 | ||
The samples were placed on wet sterile gauze surrounded by ice and taken from the operating room for processing. Each specimen weighed 60 to 120 mg and was about 0.5 cm 2 in size. To prevent molecular degradation of mRNA, the tissues were snap frozen in isopentane cooled by liquid nitrogen (−196°C) within minutes of excision. Before freezing, each masseter sample was examined for fiber orientation and placed perpendicular on a cork board and mounted with Tissue-Tek OCT (optimum cutting temperature; Sakura Finetek, Torrance, Calif). The frozen muscle was sectioned at 10 μm on a cryostat, and the sections picked up on polylysine-coated slides for immunohistochemical staining of myosin isoforms and morphometric analysis. Serial muscle sections were immunostained with anti-MHC antibodies to classify skeletal fibers into 1 of 4 fiber types as detailed previously: type I (slow-contracting), type II (fast-contracting), type I/II hybrid (mixture of fast and slow isoforms), and type neonatal/atrial (containing atypical myosins for adult skeletal muscle). For fiber type classification, only tissue sections with good antibody reactions for all myosin isoforms and acceptable morphology were used.
After sectioning, the rest of the muscle samples were processed for gene expression analysis. Total RNA was isolated with TRIzol reagent (Invitrogen, Carlsbad, Calif), treated with DNAse I, and reisolated with RNAqueous (Invitrogen) as described previously. Two muscle samples, from an open-bite subject and a deepbite subject, were selected for microarray analysis based on their diagnoses as prototypical representatives of malocclusion types and fiber type compositions. cDNA libraries of the muscle transcriptome from these specimens were prepared by reverse transcription of RNA and amplification using a WTA2 TransPlex RNA kit (Sigma-Aldrich, St Louis Mo).
Microarray preparation and analysis were done at the Core Facility of the Fox Chase Cancer Center in Philadelphia, Pa. Aliquots (2 μg) of amplified cDNA were labeled twice with cyanine 3-CTP (cy-3) and cyanine 5-CTP (cy-5) (Genomic DNA Labeling Kit PLUS; Agilent, Santa Clara, Calif) to minimize dye bias. Amounts of 1 μg of labeled cDNA were hybridized on a Whole Human Genome Oligo 4 × 44 K microarray slide (Agilent) for 17 hours at 65°C and washed according to Agilent procedures. One slide contains 4 arrays imprinted with oligonucleotides representing over 41 K genes and transcripts. The hybridized slides were scanned at 5-μm resolution on an Agilent scanner, and images were extracted using Agilent feature extraction software. The data were subjected to background subtraction, log transformation, and normalization using the locally weighted scatterplot smoothing procedure implemented in the feature extraction software before ratios between experimental conditions were calculated. Data from 2 arrays were combined, and an average ratio for every gene was calculated and reported as the processed signal for each labeled sample and the log 2 values of ratios between samples. When thresholds greater than 100 for the processed signal and ±2.0-fold ratio values were set for the normalized data, approximately 7.7 K transcripts remained; this represented about 18% of the array total.
For gene expression studies, masseter samples from 38 subjects were assayed. mRNA for HDAC4 , KAT6B, and the endogenous control gene hypoxanthine phosphoribosyltransferase-1 ( HPRT1 ) were quantified in triplicate assays by TaqMan (Applied Biosystems, Foster City, Calif) real-time polymerase chain reaction (RT-PCR) using specific primer-probe sets and RNA-to-C T 1-step reagent (Applied Biosystems). Message for MHC genes was quantified using custom-designed primer sets. Nomenclature for the MHC genes is different from the protein isoforms, so that the names used here are type I MHC isoform, MYH7 gene; type IIA, MYH2; type IIX, MYH1; type neonatal, MYH8; and type atrial, MYH6. All primer sets spanned exon junctions to prevent erroneous amplification of any residual genomic DNA. An authentic preparation of human skeletal muscle RNA (Ambion; Austin, Tex) was used as a positive control and internal reference standard in the assays. Typically, 15 to 30 ng of masseter muscle RNA was used per assay sample. Amplification efficiencies for all were over 90%, and standard curves were approximately parallel. A 25-ng amount of skeletal muscle standard was used as a reference calibrator. Relative expression quantities of the target genes were calculated using the ΔΔCT method.
Statistical analysis
Malocclusion classification, either skeletal Class II or Class III and skeletal normal, open, or deepbite, were compared for differences in HDAC4 and KAT6B expression. Values for the sagittal groups were compared with a 2-tailed t test, and values for the vertical dimension groups were compared with 1-way analysis of variance. A second set of statistical comparisons with the Kendall tau-b test were done for RT-PCR experiments to determine correlations between HDAC4 , KAT6B , and MHC gene expressions. Data for all masseter muscle samples were first pooled to determine general relationships. Samples were then subdivided into the different malocclusion classes to investigate the strength of the epigenetic relationships between subgroups.
Results
Samples from 2 subjects were selected for microarray analysis because their masseter muscle fiber type properties best represented the morphologies of a skeletal open bite and a skeletal deepbite ( Table II ). The masseter muscle in the subject with a skeletal open bite had a small proportion of type II fibers, and the muscle in the skeletal deepbite subject had a large proportion of type II fibers (0.6% and 53% tissue occupancy in the samples, respectively). These values conform to the reported type II fiber distributions in masseter muscles from a large population of open-bite and deepbite subjects. Another equally important criterion for this pilot data was that there be sufficient tissue remaining after sectioning for an immunohistochemical analysis to obtain adequate mRNA for microarray experiments. Among the differences in gene expression between subjects, we first compared the contractile protein genes ( Table III ). Contractile protein categories were organized into 4 functional groups: MHC isoforms, myosin light chain isoforms, myosin binding proteins, and troponins. When the expression values for the deepbite subject were compared relative to the open-bite subject, fast isoforms were expressed at severalfold higher levels than slow types, which were unchanged or down-regulated.
| Vertical malocclusion | Fiber type | |||||||
|---|---|---|---|---|---|---|---|---|
| I | I/II hybrid | II | Neo/atrial | |||||
| Open | Deep | Open | Deep | Open | Deep | Open | Deep | |
| Fiber number | 136 | 22 | 95 | 7 | 10 | 40 | 29 | 10 |
| Mean fiber area (μm 2 ) | 2181 | 3592 | 828 | 1017 | 272 | 3184 | 654 | 1179 |
| Muscle occupancy (%) | 61 | 33 | 34 | 9 | 0.6 | 53 | 4 | 5 |
| Description | Symbol | Gene name | Type | Deep:open |
|---|---|---|---|---|
| Myosin heavy chain | MYH7 (I) | Heavy polypeptide 7, cardiac, beta | Slow | −1.37 |
| MYH2 (IIA) | Heavy polypeptide 2, skeletal muscle | Fast | 6.54 | |
| MYH1 (IIX) | Heavy polypeptide 1, skeletal muscle | Fast | 13.74 | |
| Myosin light chain | MYL2 | Light polypeptide 2, regulatory, cardiac | Slow | −2.07 |
| MYL1 | Light polypeptide 1, alkal, skeletal | Fast | 1.84 | |
| MYLPF | Fast skeletal light chain 2 | Fast | 8.63 | |
| Myosin binding | MYBPC1 | Binding protein C, slow type | Slow | 1.29 |
| MYBPC2 | Binding protein C, fast type | Fast | 13.64 | |
| Troponins | TNNC1 | Troponin C type 1 | Slow | 1.36 |
| TNNI1 | Troponin I type 1 (skeletal) | Slow | −1.06 | |
| TNNC2 | Troponin C type 2 | Fast | 2.3 | |
| TNNI2 | Troponin I type 2 (skeletal) | Fast | 5.39 | |
| TNNT3 | Troponin T type 3 (skeletal) | Fast | 9.29 |
Because fiber type composition has the potential to change with increased muscle activity, we examined whether expression differences for exercise-related genes in the masseter muscles from deepbite and open-bite subjects might accompany the pattern seen for the contractile protein genes. Genes with various functions, whose expressions are reported to change with activity levels, were surveyed from a review of the literature and identified on the microarray. Data from genes with processed fluorescence signals less than 100 were excluded from the analysis to prevent exaggerated expression ratio values. The remaining 24 genes from this survey are shown in Table IV , along with alternate names and values for their expression ratios between deepbite and open bite. Only 7 genes had expression ratios less than 2.0 or greater than 2.0. The gene for solute carrier family-2 type-4 ( SLC2A4 ), commonly known as GLUT-4 , that is an insulin and contraction-regulated facilitated glucose transporter had the lowest expression ratio. The gene for nicotinamide phosphoribosyltransferase ( NAMPT ) that catalyzes synthesis of nicotinamide mononucleotide had the highest expression ratio. Among the other 3 genes with low deep-to-open ratios, variant 7 of peroxisome proliferator-activated receptor alpha ( PPARA ) is a regulator of lipid metabolism, whereas forkhead box O3 ( FOXO3 ) and forkhead box O1 ( FOXO1 ) regulate transcription in response to oxidative stress. The last 2 genes with high expression ratios have mitochondrial functions that include proton transport for uncoupling protein 3 ( UCP3 ) and transcription termination for mitochondrial transcription termination factor ( MTERF ).
| Gene | Deep:open |
|---|---|
| SLC2A4 ( GLUT-4 ) | −2.79 |
| FOXO3 ( FOXO3A ) | −2.47 |
| PPARA , var 7 | −2.19 |
| FOXO1 ( FOXO1A ) | −2.01 |
| PPARGC1A ( PGC-1α ) | −1.91 |
| PPARA var 6 | −1.89 |
| ANKRD2 | −1.74 |
| TRIM63 ( MURF ) | −1.37 |
| FOXO4 ( MLLT7 ) | −1.22 |
| TFAM | −1.14 |
| FBXO32 ( Atrogin-1 ) | −1.13 |
| ESRRA | −1.09 |
| ESR1 | −1.09 |
| EPAS1 ( HIF2A ) | −1.07 |
| PSMA1 | 1.07 |
| UBR1 | 1.17 |
| UCP3 (short var) | 1.19 |
| TFB1M | 1.2 |
| TFB2M | 1.25 |
| SOX6 | 1.39 |
| NAMPT ( PBEF1 ), var 1 | 1.71 |
| UCP3 (long variant) | 2.03 |
| MTERF | 2.28 |
| NAMPT ( PBEF1 ), var 2 | 3.34 |
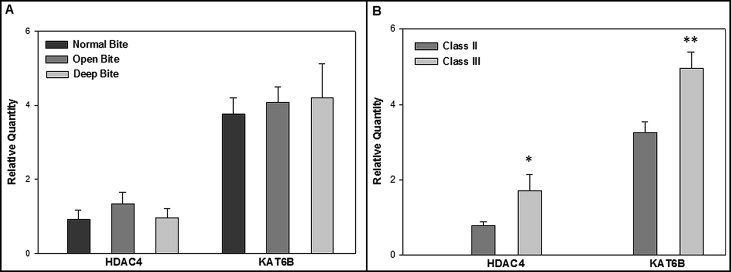
We ascertained differences in genes that affect chromatin acetylation/deacetylation. Among the 4 histone acetyltransferase and 11 deacetylase genes on the microarray, deep-to-open expression ratios were greatest for KAT6B (2.25) and HDAC4 (6.96). The other genes had ratio values that either were not ±2.0-fold or were detected at much lower signals than KAT6B and HDAC4 . Therefore, TaqMan RT-PCR assays were done to quantify HDAC4 and KAT6B expression in all masseter muscle samples. Average relative quantity (RQ) values for each gene among all subjects were compared between vertical normal, open, and deep ( Fig , A ), and sagittal Class II and Class III ( Fig , B ) malocclusion groups. RQ values were not significantly different between the vertical groups. However, Class III had significantly greater expression than Class II malocclusion for both HDAC4 ( P = 0.03) and KAT6B ( P = 0.004), as determined by a 2-tailed t test.
Histomorphologic analyses confirmed that the masseter muscle samples used here had the same characteristic fiber type properties as described in previous studies. The number and size of type I fibers were always greatest; on average, the number and size of type II fibers were the smallest and the most variable. RQ values of RNA for individual MHC genes, obtained after the histomorphologic analyses, were summed, and the total values were used to calculate the relative percentage of each gene expressed in extracts of the whole muscle. Correlation analyses between HDAC4 and KAT6B and the percentages of total expression for each MHC gene showed that HDAC4 was negatively correlated to MYH7 expression ( P <0.03) and positively correlated to MYH1 expression ( P <0.05) ( Table V ). There were no significant correlations between the myosin genes and KAT6B expression. Analyses were then done to determine whether gene expression values might correlate differently with malocclusion classification. As shown in Table VI , HDAC4 tended to be negatively correlated with MYH7 expression and positively correlated with MYH2 , MYH1, and MYH8 expressions across malocclusion groups. Specifically, HDAC4 had a significant negative correlation with MYH7 in Class II malocclusion and significant positive correlations with MYH1 in Class II malocclusion, and with both MYH1 and MYH8 in vertical normal bite malocclusion ( P <0.05). In Table VII , the highest correlations for KAT6B tended to be negative with MYH7 and MYH1 expression and positive with MYH8 expression. Two high correlations with MYH2 were negative with open bite and positive with deepbite. Correlation values with MYH6 expression were all low. Overall, the negative correlation with MYH1 in sagittal Class III was significant ( P <0.05), and the positive correlations with MYH2 in deepbite and MYH8 in open bite approached significance, with P values between 0.09 and 0.05.


