Fig. 19.1
Vertical section of calculated phase diagram of Co–28Cr–9W–1Si–xC (mass%, 0 ≤ x ≤ 0.3) system obtained using Thermo-Calc software [11]
19.2.2 Refinement of Solidification Microstructures by Carbon Addition [10]
The changes in solidification microstructures resulting from carbon addition in the Co–Cr–W-based alloys were investigated experimentally for a wide range of carbon concentrations [10]. Four kinds of Co–28Cr–9W–1Si–xC (mass%) alloys, where x = 0.005–0.33, were prepared in a high-frequency induction furnace in an argon atmosphere.
Figure 19.2 shows maps of the inverse pole figure (IPF) obtained by measuring the electron-backscatter diffraction (EBSD) of the as-cast Co–28Cr–9W–1Si–xC alloy specimens with different carbon content. The cellular dendritic microstructures were almost in the γ phase in all of the specimens, although the carbon addition stabilized the γ phase (the black area in Fig. 19.2 corresponds to the ε phase). Increasing the carbon concentration from 0.005 to 0.33 mass% decreased the grain size from ~100 μm to ~30 μm (Fig. 19.3).
Fig. 19.2
IPF maps of as-cast alloys with carbon concentrations of (a) 0.005, (b) 0.11, (c) 0.25, and (d) 0.33 mass% [10]
Fig. 19.3
Average grain sizes of as-cast alloys as a function of carbon content [10]
The mechanism of how carbon addition reduced the grain size of the cast microstructures was revealed by scanning electron microscopy (SEM) and electron probe microanalysis (EPMA). Figure 19.4 shows SEM backscattered-electron (SEM-BSE) images and the corresponding EPMA elemental maps of the as-cast alloy specimens. These figures clearly indicate solidification segregation of Cr, W, Si, and C, while Co was depleted in the interdendritic regions. The increase in bulk carbon concentration enhanced such inhomogeneous elemental distributions. Although the intermetallic compounds, in particular the σ phase, were identified in the low-carbon alloys [11], carbon-rich precipitates were clearly identified in the intergranular regions, especially when the carbon concentration was higher than 0.1 mass% (see the C maps in Fig. 19.4). The interdendritic precipitates in the high-carbon alloys corresponded to M23C6 in the high-carbon alloys [10, 11], which agrees well with the calculated phase diagram (Fig. 19.1). Figure 19.5 shows the relationship between the area fraction of the precipitates, which was analyzed using the BSE maps in Fig. 19.4, and the bulk carbon concentration in each alloy; the amount of the precipitates increased with increasing carbon concentration. These results indicate that the segregation and resulting precipitation of the carbide phase refined the solidification microstructures.
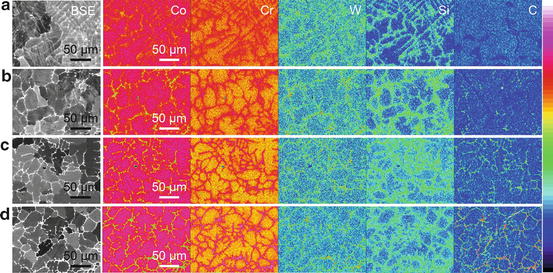
Fig. 19.4
SEM-BSE images and corresponding EPMA elemental maps of as-cast alloys with carbon concentrations of (a) 0.005, (b) 0.11, (c) 0.25, and (d) 0.33 mass% [10]
Fig. 19.5
Area fraction of precipitates of as-cast alloys as a function of carbon concentration [10]
19.2.3 Effect of Hot-Deformation Processing on Microstructures [12]
We then prepared hot-rolled Co–28Cr–9W–1Si–C alloys with carbon concentrations up to 0.33 mass% to investigate the effect of hot-deformation processing on the microstructural evolution. The cast ingots were subjected to a homogenizing heat treatment at 1,473 K for 21.6 ks (6 h) and then directly processed by multi-pass hot-caliber rolling (initial temperature: 1,473 K; φ: 15 mm → 9.6 mm), followed by water quenching.
The microstructures of the hot-rolled alloy specimens were investigated by EBSD analysis. The IPF maps in Fig. 19.6a–d reveal fully equiaxed γ grain structures with a considerable number of annealing twins. Table 19.1 shows that the average γ grain sizes decreased after hot rolling and further decreased as carbon was added. The phase maps in Fig. 19.6e–h suggest that these were duplex grain structures consisting of the γ and ε phases (the fraction of the ε phase is also shown in Table 19.1). We believe the plate-like ε phase formed during cooling after hot rolling (i.e., athermal martensitic transformation), and its fraction decreased with increasing carbon concentration, as confirmed in the as-cast alloys.
Fig. 19.6
(a–d) IPF maps and (e–h) phase maps of hot-rolled alloys with carbon concentrations of (a, e) 0.02, (b, f) 0.05, (c, g) 0.11, and (d, h) 0.33 mass% [12]
Table 19.1
Average γ grain sizes and fractions of ε martensite of hot-rolled Co–28Cr–9W–1Si–C alloys with different carbon concentrations [12]
|
Carbon content (mass%)
|
γ grain size (μm)
|
Fraction of ε martensite (%)
|
|---|---|---|
|
0.02
|
24.6
|
30.9
|
|
0.05
|
26.1
|
11.5
|
|
0.11
|
16.8
|
4.9
|
|
0.33
|
12.7
|
3.8
|
Figure 19.7 shows the SEM-BSE images of the hot-rolled alloys. Very fine precipitates (0.01–1 μm in diameter) were identified in all of the hot-rolled alloys; they were enriched with tungsten, as shown by their bright contrast in the SEM-BSE images. Figure 19.8a–d show transmission electron microscopy (TEM) bright-field images of the submicron-sized precipitates observed in the low-carbon (0.02 mass%) and high-carbon (0.33 mass%) alloys, respectively. The corresponding selected-area diffraction (SAD) pattern obtained for each precipitate, revealed to be the C14-Laves phase and M23C6, is shown in Fig. 19.8b, e, respectively. The TEM and energy-dispersive X-ray spectroscopy (TEM-EDS) analyses confirmed that both the Laves-phase and carbide particles were enriched with W and Si (Fig. 19.8c, f). In addition, the particles whose diameters were approximately 2–5 μm are shown in Fig. 19.7a and coarse gray particles can also be seen in Fig. 19.7d (0.33 mass%), as indicated by arrows in each figure. Our previous study indicated that the particles formed in the low-carbon alloy are the σ phase [13]. On the other hand, Fig. 19.9
Stay updated, free dental videos. Join our Telegram channel
VIDEdental - Online dental courses


