Introduction
The aim of this study was to compare the predictability of the cone-beam transverse (CBT), jugale (J-point), and transpalatal width measurement (TWM) analyses in identifying clinical crossbite.
Methods
From a pool of patients with cone-beam computed tomography scans who came for orthodontic treatment, a sample of 133 patients was identified, with 54 in posterior crossbite (28 boys, 26 girls) and 79 not in crossbite (77 boys, 110 girls). No patient had dental compensation in this sample. After correcting for lateral mandibular shift, 33 of the 54 posterior crossbite patients had a bilateral crossbite, and 21 had a unilateral crossbite with no shift. The CBT, J-point, and TWM analyses were done for each patient from a coronal cross-section through the middle of both the maxillary and mandibular first molar crowns. The landmarks and measurements used were described in detail in a previous study. Posteroanterior cephalograms were constructed to simulate the geometry of the conventional cephalometric radiographs. All 3 analyses were performed on the same data set to predict whether crossbite was present. We used 2 assessments of diagnostic predictability: sensitivity and specificity, and positive and negative predictive values. While the 2 methods answer different questions, the prevalence of crossbite in a population will affect the positive and negative predictive values, but the sensitivity and specificity will not change.
Results
Of the 133 patients studied, 54 had a clinical crossbite, and 79 had no crossbite. The J-point analysis accurately predicted that 38 patients would have a crossbite, and 45 would not. This resulted in a positive predictive value of 52.78%, a negative predictive value of 73.77%, sensitivity of 70.4%, and specificity of 57%. The TWM analysis accurately predicted that 53 patients would have a crossbite, but it falsely predicted that an additional 68 patients would have crossbite. This resulted in a positive predictive value of 43.8%, a negative predictive value of 91.67%, sensitivity of 98.1%, and specificity of 13.9%. The CBT analysis correctly predicted a crossbite in 47 patients and accurately predicted no crossbite in 73 patients. This resulted in a positive predictive value of 88.68%, a negative predictive value of 91.25%, sensitivity of 87.0%, and specificity of 92.4%.
Conclusions
This study showed that although the TWM analysis had slightly better negative predictive and sensitivity values, the CBT analysis was overall better at both predictive value and sensitivity/specificity because of the limitations in J-point landmarks and the extent of the TWM analysis. Furthermore, the CBT analysis can distinguish between skeletal and dental discrepancies. Further work will test the analysis on additional samples with differing prevalences of crossbite.
Highlights
- •
Cone-beam transverse (CBT) analysis and 2 transverse analyses were compared.
- •
Overall, CBT analysis is the most specific at diagnosing crossbite.
Posterior crossbite is a common malocclusion occurring in the deciduous and mixed dentitions. It occurs in 1% to 23% of the population in the United States. The etiology of crossbite is multifactorial, including congenital, developmental, traumatic, and iatrogenic factors. A common factor is a thumb-sucking habit, where the maxillary arch tends to become V-shaped with greater constrictions at the canine areas.
Posterior crossbite can be unilateral or bilateral and may develop at any time during the eruption of the deciduous or permanent dentition. If left untreated, the crossbite can have a long-term effect on the growth and development of the teeth, jaws, and soft tissues of the oral cavity. Most studies have supported the early diagnosis and treatment of a crossbite to establish an ideal environment for normal growth and development that helps to prevent further malocclusion and minimize the need for comprehensive orthodontic treatment.
A number of posteroanterior cephalometric and cast analyses have evaluated the breadth, symmetry, morphology, shape, and size of the craniofacial skeleton. The posteroanterior analysis of Ricketts and the maxillary transpalatal width measurement (TWM) developed by Howe et al are among the more widely used analyses in evaluating the transverse dimensions, but these traditional analyses have limitations. The jugale (J-point) analysis relies on accurate identification of the intersection between the contour of the maxillary tuberosity and the inferior border of the zygomatic buttress to determine the width of the maxilla to compare with the mandibular width. With this analysis, superimposition of many structures on the posteroanterior view can reduce the clarity of the landmarks and increase identification errors. In addition, when measuring the J-points, any rotation of the head about a vertical axis when the posteroanterior cephalogram is taken affects the horizontal relationships of 3-dimensional (3D) landmarks, making it hard to assess symmetry and measure horizontal distances. When using the TWM, the distance is measured from the cervical midlingual region between the permanent first molars. This measurement is significantly affected by molar inclination and does not truly represent the maxillary skeletal dimension.
Three-dimensional craniofacial imaging enables orthodontists to appreciate the complexities of 3D craniofacial structures. Using cone-beam computed tomography (CBCT), 3D images of asymmetry, condylar pathology, airway patency, skeletal discrepancies, and dental abnormalities can be visualized clearly and from multiple angles. Most of these images were not possible with standard 2-dimensional radiographs.
In a previous study, we developed a cone-beam transverse (CBT) analysis that evaluates the transverse jaw relationships and can aid in differentiating between skeletal and dental transverse problems. A detailed description of the analysis is given in the Appendix .
The aim of this study was to compare the predictability of the CBT, J-point, and TWM analyses in identifying clinical crossbite. Our previous study indicated that the lack of a dental crossbite does not necessarily mean that no transverse discrepancy exists. However, it is difficult to validate norms without a clearly defined standard, and our analysis identifies dental compensation for skeletal discrepancy. Therefore, we chose to test the ability of our analysis to predict clinical dental crossbites with that of the J-point and TWM analyses.
We used 2 assessments of predictability: sensitivity/specificity, and positive and negative predictive values. Each test has advantages and disadvantages, but each is easily calculated using the numbers of true and false positives and negatives after applying the different analyses.
Material and methods
In our previous study, we examined the records of 2279 orthodontic patients who had a CBCT scan from 2 private orthodontic offices that used an i-CAT Classic scanner (Imaging Sciences International, Hatfield, Pa). This study, examining retrospective records of patients presenting for treatment, was approved by the institutional review board at Harvard University, Cambridge, Mass.
All selected patients were in the mixed or permanent dentition with erupted maxillary and mandibular permanent first molars in bilateral Angle Class I molar relationships, with the mesiobuccal cusp within 1 mm of the buccal groove of the mandibular first molar. The entire crossbite sample had a lingual crossbite between the maxillary and mandibular permanent first molars on at least 1 side. We excluded patients with missing teeth (other than third molars), crowding of more than 4 mm, overbite or overjet of more than 4 mm, crowns or cuspal restorations, previous orthodontic treatment, and histories of craniofacial trauma, surgery, or temporomandibular joint symptoms.
Our preliminary sample included 241 patients, of whom 54 had posterior crossbite (28 boys, 26 girls) and 187 were without crossbite (77 boys, 110 girls). From these 187 patients, 79 (34 boys, 45 girls) also had no dental compensation as determined from our previous study. These 79 were designated as the control group. Patients who were previously identified as having no crossbites but had dental compensations (n = 108) were excluded from this study to more clearly identify patients with a clinical crossbite. All CBCT scans were taken in centric relation as determined by the treating orthodontist after correcting for mandibular shifts. Thirty-three of the 54 posterior crossbite patients had a bilateral crossbite, and 21 had a unilateral crossbite with no shift. Our final study group had 54 patients with crossbite and 79 control patients, for a total of 133 patients.
First, the CBCT scan for each patient was exported in a DICOM3 format and imported into cephalometric analysis software (version 10.5; Dolphin Imaging & Management Solutions, Chatsworth, Calif). The 3D reconstructed volume was oriented with the Frankfort horizontal plane parallel to the floor. Posteroanterior cephalograms were constructed using the perspective reconstruction algorithm of the analysis software with 10% magnification of the midsagittal plane, thus simulating the geometry of the conventional cephalometric radiograph.
It has been shown that the linear and angular measurements from the reconstructed posteroanterior cephalogram using the perspective reconstruction algorithm of the Dolphin software were not significantly different from that measured on the conventional posteroanterior cephalogram.
Next, the CBT analysis was done for each patient using a coronal cross-section through the middle of both the maxillary and mandibular first molar crowns. The landmarks and the measurements (linear and angular) were described in detail in our previous study and are included in the Appendix .
With the same reconstructed 2-dimensional view, the J-point analysis was calculated for each scan by subtracting the maxillary width from the mandibular width. The mandibular width was defined as the linear measurement between the right and left antegonial points, and the maxillary width was defined as the linear measurement between the right and left J-points.
Using the same section, we calculated the TWM analysis. The TWM is the palatal width measured at the cervical region of the maxillary permanent first molar from the midpoint of its lingual surface to a corresponding point on its antimere.
Statistical analysis
The intrarater and interrater reliability values for the CBT analysis were reported in our previous study. For the J-point and TWM measurements, 20 scans were randomly selected for measurement. Intrarater reliability was determined by performing the J-point analysis and the TWM by 1 examiner (S.A.) for each scan on 2 separate occasions, with each session at least 1 week later. A second examiner performed the same measurements on the 20 scans once. Interrater reliability was determined as a measure of agreement between the 2 examiners. The Cronbach alpha test was used to assess interexaminer and intraexaminer reliability values of the measures. The intraclass correlation 2-way mixed-model method was also used to assess interrater reliability.
Sensitivity and specificity for the 3 diagnostic methods were calculated as follows.
Sensitivity = TP/(TP+FN) × 100
Specificity = TN/(TN+FP) × 100where TP is true positive, FP is false positive, FN is false negative, and TN is true negative.
For the diagnosis of crossbite, a true positive means that the crossbite was predicted correctly by the analysis. However, a false positive means that a crossbite was predicted where none existed. A true negative means that no crossbite was predicted when none existed, and a false negative means that a patient with a crossbite was not identified by the analysis.
For each method, the receiver operating characteristic curves were generated using the sensitivity and specificity data.
The positive and negative predictive values were also calculated for each analysis as follows.
Positive predictive value = TP/(TP+FP) × 100
Negative predictive value = TN/(TN+FP) × 100
Results
The sample consisted of 133 patients: 79 patients had no crossbite (34 boys, 45 girls), and their molar inclinations had been shown to be within 1 standard deviation (SD) of the mean. Fifty-four of the 133 had a clinically identifiable posterior crossbite (28 boys, 26 girls), as shown in Table I . The mean age of the sample was 12.8 years.
| Sex | Group | |
|---|---|---|
| Control | Crossbite | |
| Female | 45 | 26 |
| Male | 34 | 28 |
| Total | 79 | 54 |
The Cronbach alpha test showed that the intraexaminer and interexaminer agreements for the angular and linear measurements were reliable (α >0.9), as reported in Part 1.
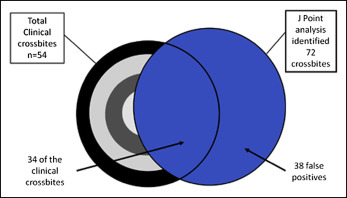
Based on the J-point analysis, 72 of the 133 patients were predicted to have a crossbite. Of these 72 predicted patients, only 38 actually had a clinical posterior crossbite ( Fig 1 ). Of the 79 patients with no clinically identifiable crossbite and no dental compensation, the J-point analysis predicted that 34 of them would have a crossbite. This resulted in a positive predictive value of 52.78%, a negative predictive value of 73.77%, sensitivity of 70.4%, and specificity of 57% ( Table II ).
| Crossbite | No crossbite | Measure | |
|---|---|---|---|
| Crossbite predicted | TP = 38 | FP = 34 | PPV = 52.78 |
| No crossbite predicted | FN = 16 | TN = 45 | NPV = 73.77 |
| Measure | Sensitivity = 70.4 | Specificity = 57.0 | Accuracy = 62.4% |
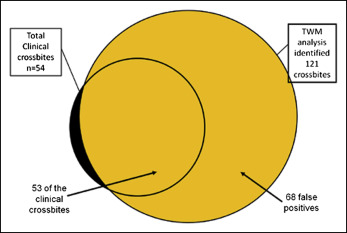
With the TWM, 121 of the 133 patients were predicted to have a crossbite. These patients included 53 of the 54 with a clinically identifiable posterior crossbite ( Fig 2 ). The TWM also predicted that 68 of the 79 patients with no clinical crossbite would have a crossbite. This resulted in a positive predictive value of 43.8%, a negative predictive value of 91.67%, sensitivity of 98.1%, and specificity of 13.9% ( Table III ).
| Crossbite | No crossbite | Measure | |
|---|---|---|---|
| Crossbite predicted | TP = 53 | FP = 68 | PPV = 43.8 |
| No crossbite predicted | FN = 1 | TN = 11 | NPV = 91.67 |
| Measure | Sensitivity = 98.1 | Specificity = 13.9 | Accuracy = 48.1% |
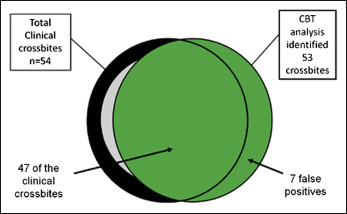
With the CBT analysis, 53 of the 133 patients were predicted to have a posterior crossbite ( Fig 3 ). The CBT analysis predicted that only 6 of the 79 patients with no crossbite would have a crossbite. Of these 53 patients, 47 had a clinically identifiable posterior crossbite. This resulted in a positive predictive value of 88.68%, a negative predictive value of 91.25%, sensitivity of 87.0%, and specificity of 92.4% ( Table IV ).
| Crossbite | No crossbite | Measure | |
|---|---|---|---|
| Crossbite predicted | TP = 47 | FP = 6 | PPV = 88.68 |
| No crossbite predicted | FN = 7 | TN = 73 | NPV = 91.25 |
| Measure | Sensitivity = 87.0 | Specificity = 92.4 | Accuracy = 90.2% |
The intraclass correlation 2-way mixed-model method was used to assess the interexaminer reliability. We found that the measurements of reliability ranged between 95% and 99% for the variables used in the analysis.
The odds ratios, receiver operating characteristic curve values, and Nagelkerke’s R 2 values are summarized in Table V and Figures 4-6 . The receiver operating characteristic curves clearly demonstrate that the CBT analysis is the most accurate of the 3 analyses. The Nagelkerke’s R 2 confirmed this result.
| Model | OR (95% CI) | ROC value | Nagelkerke’s R 2 | Sensitivity (95% CI) | Specificity (95% CI) |
|---|---|---|---|---|---|
| Model 1, predictor is J-point | 3.00 (1.43-6.33) | 0.6817 | 0.107 | 70.37 (56.21-81.63) | 56.96 (45.35-67.89) |
| Model 2, predictor is TWM | 8.57 (1.07-68.51) | 0.560 | 0.068 | 98.15 (88.82-99.9) | 13.92 (7.49-23.97) |
| Model 3, predictor is CBT | 82.26 (25.70-263.26) | 0.936 | 0.691 | 87.04 (74.48-94.2) | 92.4 (83.61-96.87) |
Stay updated, free dental videos. Join our Telegram channel
VIDEdental - Online dental courses


