Introduction
The aim of this study was to compare the dentoskeletal changes and alterations of mandibular condyle-disc-fossa relationships in subjects at the peak and the end of the pubertal growth period treated with the Forsus fatigue resistant device (3M Unitek, Monrovia, Calif).
Methods
The sample consisted of 29 subjects with Class II Division 1 malocclusions who were classified according to their hand-wrist radiographs. Fifteen patients were at or just before the peak phase of pubertal growth (peak pubertal group). Fourteen patients were near the end of the pubertal growth period (late pubertal group). The study was conducted by using lateral cephalometric radiographs and magnetic resonance images obtained at the beginning and at the end of the application of the Forsus fatigue resistant device. The treatment period was 9 months.
Results
The Wilcoxon signed rank test was used to evaluate differences within groups. The changes observed in both groups were compared by using the Mann-Whitney U test. There were statistically significant group differences in mandibular length and ramus length, with significant increases of these parameters in the peak pubertal group ( P <0.05). No significant differences were observed between the groups concerning dental parameters ( P >0.05), with the exception of mandibular molar vertical movements, which were significantly greater in the peak pubertal group ( P <0.05). Analysis of the magnetic resonance images showed no positional changes of the mandibular condyle in relation to the glenoid fossa in either group ( P >0.05). Although the articular disc was positioned more anteriorly in the peak pubertal group compared with its pretreatment position ( P <0.05), the position of the disc was still within the physiologic range. No significant intergroup difference was observed for disc-condyle relationship ( P >0.05).
Conclusions
The Forsus fatigue resistant device did not appear to cause significant increases in mandibular dimensions in subjects in late puberty. According to the magnetic resonance image findings, Forsus treatment is not a risk factor for the development of temporomandibular dysfunction in subjects with no signs and clinical symptoms of dysfunction.
Class II malocclusions are a major part of orthodontic irregularities. The research suggests that mandibular retrognathia is the underlying cause, rather than maxillary prognathism. In these patients, to stimulate mandibular growth by forward positioning of the mandible, removable or fixed functional orthopedic appliances are used.
It has been reported that the effectiveness of functional therapy depends on both the treatment timing (skeletal maturity at the start of functional therapy) and the type of functional appliance. According to several studies, mandibular growth can extend beyond puberty, and minimal residual growth can only be stimulated with fixed functional appliances.
Ruf and Pancherz, Konik et al, and Kinzinger and Diedrich stated that the treatment of late adolescents and young adults with rigid fixed functional appliances such as the Herbst or functional mandibular advancer resulted in correction of the Class II malocclusion with the skeletal and dental changes. However, the changes produced by semirigid fixed functional appliances might be different from those produced with rigid devices. In treatment with the Jasper jumper, which is a semirigid fixed functional appliance, Nalbantgil et al found no significant effects in mandibular growth and in the degree of mandibular protrusion in late adolescents, but Stucki and Ingervall reported that the skeletal mandibular effects were the same in subjects allocated to 2 groups based on whether they were younger or older than 15 years of age.
The Forsus fatigue resistant device (3M Unitek, Monrovia, Calif) is a fairly new semirigid fixed functional appliance that is claimed by the manufacturer to be resistant against fracture and to exert consistent forces. The literature comprises only a few studies on its effects. In treatment with the Forsus fatigue resistant device, the inquiry is still unanswered concerning whether the skeletal and dental changes in subjects who have not passed the peak stage of pubertal growth are different from those in subjects in later maturation stages.
Another issue during functional therapy is its effect on the temporomandibular joint (TMJ). The general consensus is that the acceleration and peak phases of the pubertal growth spurt have optimal conditions for TMJ adaptations to functional treatment. This notion is supported by studies using magnetic resonance imaging, computerized tomography scans, and horizontally corrected tomographies to evaluate the TMJ. These studies demonstrated that no adverse effects are encountered at the TMJs of adolescents and patients at various ages from puberty to adulthood who are treated with functional appliances such as Herbst, functional mandibular advancer, Twin-block, activator, bionator, and Fränkel. However, no report has been published regarding the effects of semirigid functional appliance therapy on the TMJ. When unexpected TMJ responses to functional treatment are also taken into account, it becomes apparent that new studies are needed.
The purpose of this study was to compare the dentoskeletal changes by means of lateral cephalograms in subjects who were treated with the Forsus fatigue resistant device at the peak and the end of the pubertal growth period. In addition, comparisons of the possible TMJ effects, including changes in condylar position and disc-condyle relationships, were made with magnetic resonance images of the TMJs.
Material and methods
Patients with the following characteristics were included in this study: (1) Angle Class II Division 1 malocclusion in the permanent dentition, (2) ANB angle greater than 4° with a retrognathic mandible, (3) well-aligned dental arches, (4) growth period just before or exactly at the peak stage or near the end of pubertal growth stage (evaluated by hand-wrist radiographs, according to the method of Hägg and Taranger ), (5) SNGoGn not exceeding 38°, (6) no clinical signs or symptoms of TMJ dysfunction. These patients were divided into 2 groups based on their skeletal maturity. Boxplots (a reliable statistical tool for variation information in data sets) were made for the initial cephalometric data. Accordingly, outlying patients were excluded from the study. The total number of subjects was 29; 15 were in the peak phase of pubertal growth (peak pubertal group), and 14 were at the end of the pubertal growth period (late pubertal group) according to their hand-wrist radiographs. The mean ages were 14.02 ± 1.03 years for the peak pubertal group (9 boys, 6 girls) and 15.11 ± 1.17 years for the late pubertal group (3 boys, 11 girls). Before the study, each subject received a full explanation of its purpose and design, and agreed to participate by signing an informed consent.
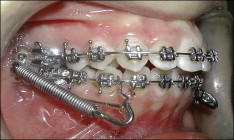
Preangulated and pretorqued edgewise appliances with an 0.018-in slot were used in all patients. After a rapid leveling phase, maxillary and mandibular 0.017 × 0.025-in stainless steel archwires were placed, and Forsus fatigue resistant devices were attached to the maxillary first molars (through the “L” ball pin) and to the mandibular auxillary arches ( Fig 1 ).
In this study, we used lateral cephalometric radiographs and magnetic resonance inages taken immediately (1-3 days) before placement and after removal of the Forsus fatigue resistant devices.
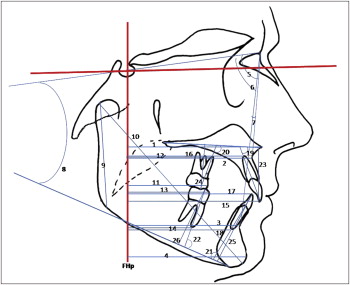
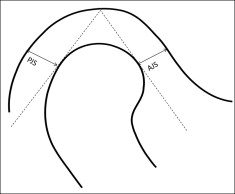
All cephalometric radiographs were taken on the same cephalostat. Angular and linear parameters were measured to the nearest 0.5 mm or 0.5° on the cephalometric radiographs shown in Figure 2 . A line drawn at sella and perpendicular to the Frankfort (FH) horizontal plane (constructed by drawing a second line having a −7° difference with the SN plane) (FHp) was used for the measurements. All measurements were made twice by the same orthodontist (H.S.), and mean values were used in the final evaluation.
Magnetic resonance images of the TMJs were obtained in both closed mouth and open mouth positions with a scanner (1.5 Tesla; Achieva, Philips, Eindhoven, The Netherlands) equipped with TMJ surface coils for simultaneous imaging of the right and left joints. Turbo spin echo T2-weighted coronal images (repetition time, 5000 ms; echo time, 100 ms; flip angle: 90°; slice thickness, 3 mm; interslice gap, 1 mm; matrix, 384 × 512; field of view (FoV), 230; regional FoV, 80; number of signals averaged, 3) as closed mouth, and parasagittal proton density spin echo images (repetition time, 1500 ms; echo time, 30 ms; flip angle, 90°; slice thickness, 3 mm; interslice gap, 0.3 mm; matrix, 256; FoV, 150; regional FoV, 100; number of signals averaged, 3) with the mouth closed and open were obtained. Magnetic resonance images were made separately in maximum intercuspation and maximal opening for the right and left TMJs. Imaging was done in the supine position. First, scout images on the axial, coronal, and sagittal planes were taken for orientation of the coronal and sagittal slices. After T2 weighted coronal images, parasagittal images were taken perpendicular to the condyle long axis. For reproducibility of the open mouth positions, standardized plastic wedges of equal length were used.
Magnetic resonance images were analyzed by (1) visual examination to assess the anatomic position of the disc in closed and open positions as well as to detect possible structural bone changes of the condylar and temporal surfaces; (2) measurement of the condylar position in the glenoid fossa on parasagittal images of the right and left TMJs in closed position; and (3) measurement of the disc-condyle relationship on parasagittal images of the right and left TMJs in closed and open mouth positions.
Visual examinations of the parasagittal magnetic resonance images were done on the lateral, central, and medial slices of each TMJ. Disc position was considered normal with the mouth closed when the posterior band of the disc was between the 11 o’clock and 1 o’clock positions and, in the open mouth, when the disc was between the condyle and the tuberculum articulare of the temporal bone.
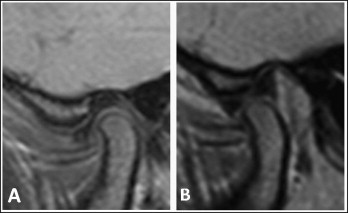
Figure 3 shows magnetic resonance images that were used for quantitative analysis of a typical subject. Quantitative analysis was performed on only the central slices of the images. In the quantitative evaluation of the articular disc, the disc position index, based on that of Bumann et al and Vargas Pereira and later modified by Pancherz et al, was used: (a × b)/100. Distance a was measured as the perpendicular distance from the midpoint of the disc to the line connecting the midpoint of the condyle and tuberculum articulare; distance b was measured as half the length of the articular disc ( Fig 4 ). The standard values, which correspond to a physiologic relationship between the disc and the condyle, ranged from +33 to −21.
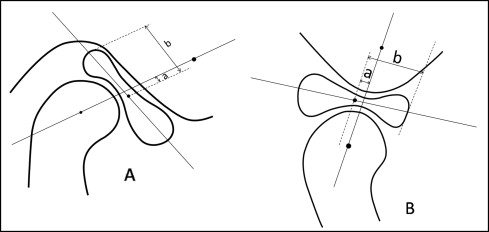
Condylar position was assessed quantitatively by the following joint space index described by Kamelchuk et al : [(PJS − AJS)/(PJS + AJS)] × 100, where PJS is the posterior joint space, and AJS is the anterior joint space ( Fig 5 ). For the joint space and disc position indexes, positive and negative values indicated anterior and posterior positions, respectively.
Computer-assisted analysis of magnetic resonance images was conducted by the same radiologist (E.A.). All measurements were made twice, and their mean values were used.
Statistical analysis
For the assessment of the method error, 10 randomly selected cephalograms and magnetic resonance images were retraced and remeasured. Systematic errors were estimated by using a paired 2-tailed t test; no significant differences were found. Dahlberg’s formula was used for calculation of combined method errors in locating and measuring the changes of different landmarks: ∑ⅆ
∑ ⅆ 2 2 n
, where d is the difference between 2 measurements of a pair, and n is the number of double measurements. Errors for the joint space and disc position indexes did not exceed 4.5 and 1.2, respectively. The method errors did not exceed 0.81 mm and 0.83° for any cephalometric variables investigated.
Statistical analysis of the roentgenographic cephalometry and magnetic resonance image data was carried out with the SPSS for Windows program (version 15.0, SPSS, Chicago, Ill). For different variables, arithmetic means and standard deviations were calculated and are presented for information.
The homogeneity of the groups before Forsus fatigue resistant device treatment was tested with the Mann-Whitney test. The nonparametric Wilcoxon signed rank test was used to evaluate the differences between the left and right TMJs. When no statistically significant differences were observed between the left and right TMJs, they were pooled. In the statistical analysis of cephalometric and magnetic resonance images measurements, the Wilcoxon signed rank test was used to evaluate the changes from pretreatment to posttreatment in each group. To compare the changes in the 2 groups, the Mann-Whitney U test was used. Statistical significance was determined at the 0.05 level. According to the power analysis with this level and 80% power (based on a 1.4-mm SD and a 1.5-mm detectable group difference), the minimum sample size needed for each group was 14.
Results
The cephalometric measurements for the dentoskeletal changes in both groups before and after the Forsus fatigue resistant device application are shown in Table I . The cephalometric changes and their significance in each group and the intergroup differences for changes are presented in Table II . In both groups, the mandible was positioned anteriorly (B-FHp, Pg-FHp, and SNB increased) with a consequent decrease in the ANB angle ( P <0.05). In the peak pubertal group, increases in mandibular length (Co-Gn) and ramus height (Co-Go) were found to be statistically significant; significant differences were observed between the 2 groups concerning these measurements ( P <0.05). In the peak pubertal group, the SNGoGn angle remained unchanged during treatment with the Forsus fatigue resistant device ( P >0.05), whereas it showed a significant decrease in the late pubertal group ( P <0.05). However, the difference between the 2 groups was nonsignificant ( P >0.05).
| Peak pubertal group | Late pubertal group | |||||||
|---|---|---|---|---|---|---|---|---|
| Before | After | Before | After | |||||
| Mean | SD | Mean | SD | Mean | SD | Mean | SD | |
| Skeletal measurements | ||||||||
| ANS-FHp (mm) | 82.14 | 4.34 | 82.77 | 4.29 | 80.71 | 5.55 | 81.29 | 5.24 |
| A-FHp (mm) | 75.27 | 3.90 | 75.54 | 4.83 | 73.64 | 5.34 | 73.75 | 5.06 |
| B-FHp (mm) | 62.32 | 6.09 | 63.73 | 7.54 | 63.21 | 6.41 | 64.50 | 7.28 |
| Pg-FHp (mm) | 64.09 | 6.56 | 65.40 | 8.40 | 64.57 | 8.01 | 66.07 | 8.87 |
| SNA (°) | 80.90 | 3.01 | 80.23 | 3.24 | 82.25 | 3.18 | 82.39 | 3.38 |
| SNB (°) | 74.86 | 2.72 | 75.36 | 3.02 | 76.61 | 2.93 | 77.61 | 3.34 |
| ANB (°) | 6.04 | 1.54 | 4.86 | 1.64 | 5.67 | 1.21 | 4.85 | 1.47 |
| SNGoGn angle (°) | 31.72 | 3.29 | 31.04 | 3.56 | 29.17 | 5.00 | 28.07 | 5.15 |
| Co-Go (mm) | 60.59 | 6.15 | 62.94 | 5.55 | 59.82 | 4.06 | 61.28 | 5.14 |
| Co-Gn (mm) | 108.91 | 4.67 | 111.63 | 4.91 | 105.38 | 7.46 | 106.76 | 7.63 |
| Dental measurements | ||||||||
| U6c-FHp (mm) | 48.50 | 3.70 | 46.82 | 5.12 | 47.60 | 5.64 | 46.30 | 6.20 |
| U6a-FHp (mm) | 47.35 | 5.31 | 47.50 | 5.91 | 45.05 | 6.66 | 45.37 | 7.19 |
| L6c-FHp (mm) | 45.54 | 4.57 | 48.63 | 5.55 | 45.57 | 5.93 | 48.21 | 6.36 |
| L6a-FHp (mm) | 43.20 | 5.51 | 45.42 | 5.12 | 42.23 | 5.87 | 43.97 | 5.76 |
| U1c-FHp (mm) | 79.50 | 4.96 | 77.68 | 6.50 | 78.75 | 5.41 | 76.82 | 6.37 |
| U1a-FHp (mm) | 76.65 | 3.57 | 76.50 | 3.91 | 75.52 | 4.61 | 75.86 | 5.70 |
| L1c-FHp (mm) | 71.04 | 4.98 | 74.32 | 6.49 | 70.61 | 5.49 | 73.89 | 5.58 |
| L1a-FHp (mm) | 68.75 | 4.86 | 71.03 | 4.58 | 67.18 | 5.38 | 69.22 | 4.92 |
| U1-PD angle (°) | 115.27 | 6.45 | 111.45 | 4.17 | 117.50 | 7.17 | 113.21 | 3.86 |
| U6-PD angle (°) | 84.32 | 5.08 | 81.91 | 5.01 | 86.75 | 3.02 | 82.82 | 2.90 |
| L1-MD angle (°) | 97.41 | 4.57 | 102.86 | 3.21 | 100.86 | 5.36 | 107.00 | 6.48 |
| L6-MD angle (°) | 85.32 | 3.21 | 89.18 | 3.13 | 87.21 | 3.17 | 91.03 | 4.11 |
| U1-PD (mm) | 32.77 | 3.38 | 34.23 | 2.66 | 30.29 | 2.93 | 31.57 | 2.60 |
| U6-PD (mm) | 28.05 | 3.25 | 27.45 | 3.77 | 26.03 | 2.56 | 25.68 | 3.49 |
| L1-MD (mm) | 47.67 | 4.26 | 46.23 | 4.19 | 43.00 | 3.47 | 40.93 | 4.08 |
| L6-MD (mm) | 36.95 | 3.89 | 38.28 | 3.59 | 33.82 | 2.90 | 34.14 | 3.04 |
| Overjet (mm) | 8.41 | 1.78 | 3.45 | 0.41 | 8.14 | 1.29 | 2.85 | 1.42 |
| Overbite (mm) | 5.04 | 1.49 | 2.94 | 0.65 | 4.42 | 1.94 | 2.54 | 1.66 |
| Peak pubertal group | Late pubertal group | Group difference | |||||
|---|---|---|---|---|---|---|---|
| Mean change | SD | Wilcoxon test | Mean change | SD | Wilcoxon test | Mann-Whitney U test | |
| Skeletal measurements | |||||||
| ANS-FHp (mm) | 0.63 | 1.00 | 0.58 | 1.01 | |||
| A-FHp (mm) | 0.27 | 1.72 | 0.10 | 1.25 | |||
| B-FHp (mm) | 1.40 | 1.09 | ∗ | 1.29 | 0.97 | ∗ | |
| Pg-FHp (mm) | 1.31 | 0.93 | ∗ | 1.50 | 1.16 | ∗ | |
| SNA (°) | −0.68 | 1.12 | 0.14 | 0.81 | |||
| SNB (°) | 0.50 | 0.92 | ∗ | 1.00 | 1.01 | ∗ | |
| ANB (°) | −1.18 | 0.78 | ∗ | −0.82 | 0.60 | ∗ | |
| SNGoGn angle (°) | −0.68 | 1.48 | −1.10 | 1.25 | ∗ | ||
| Co-Go (mm) | 2.35 | 1.41 | ∗ | 1.47 | 1.50 | ∗ | |
| Co-Gn (mm) | 2.72 | 1.63 | ∗ | 1.38 | 1.04 | ∗ | |
| Dental measurements | |||||||
| U6c-FHp (mm) | −1.68 | 0.52 | ∗ | −1.30 | 0.46 | ∗ | |
| U6a-FHp (mm) | 0.15 | 1.48 | 0.31 | 1.57 | |||
| L6c-FHp (mm) | 3.09 | 0.96 | ∗ | 2.64 | 1.03 | ∗ | |
| L6a-FHp (mm) | 2.21 | 1.04 | ∗ | 1.73 | 1.16 | ∗ | |
| U1c-FHp (mm) | −1.81 | 1.08 | ∗ | −1.93 | 0.98 | ∗ | |
| U1a-FHp (mm) | −0.15 | 1.03 | 0.34 | 1.22 | |||
| L1c-FHp (mm) | 3.22 | 1.17 | ∗ | 3.28 | 1.46 | ∗ | |
| L1a-FHp (mm) | 2.27 | 1.06 | ∗ | 2.04 | 1.25 | ∗ | |
| U1-PD angle (°) | −3.81 | 1.99 | ∗ | −4.29 | 1.54 | ∗ | |
| U6-PD angle (°) | −2.40 | 2.03 | ∗ | −3.93 | 2.28 | ∗ | |
| L1-MD angle (°) | 5.45 | 0.58 | ∗ | 6.14 | 0.45 | ∗ | |
| L6-MD angle (°) | 3.86 | 1.41 | ∗ | 3.82 | 1.13 | ∗ | |
| U1-PD (mm) | 1.45 | 0.93 | ∗ | 1.17 | 0.82 | ∗ | |
| U6-PD (mm) | −0.59 | 0.60 | −0.35 | 1.43 | |||
| L1-MD (mm) | −1.43 | 0.70 | ∗ | −2.07 | 0.42 | ∗ | |
| L6-MD (mm) | 1.32 | 1.27 | ∗ | 0.27 | 1.43 | ∗ | |
| Overjet (mm) | 4.95 | 1.86 | ∗ | −5.28 | 2.11 | ∗ | |
| Overbite (mm) | −2.09 | 1.39 | ∗ | −1.88 | 0.96 | ∗ | |
Stay updated, free dental videos. Join our Telegram channel
VIDEdental - Online dental courses


