Introduction
To correct dentofacial deformities, a combination of orthodontic treatment and orthognathic surgery is needed. Prediction software packages are beneficial in treatment planning and achieving improved outcomes, but before using any software, its reliability and reproducibility must be assessed. The aim of this study was to evaluate the accuracy of 2-dimensional Dolphin (version 10; Dolphin Imaging & Management Solutions, Chatsworth, Calif) and 3-dimensional Maxilim (Medicim, Sint-Niklaas, Belgium) softwares in predicting the soft-tissue profiles of patients who had Le Fort I osteotomies.
Methods
The presurgical and postsurgical cone-beam computed tomography synthesized lateral cephalograms of 13 patients were collected. Using the Dolphin and Maxilim softwares, the postsurgical profiles were predicted. The positions of the soft-tissue landmarks in profile views were compared with landmarks in the postsurgical photographs. The data were analyzed with the coefficient of reliability and paired-sample t tests.
Results
The alpha values of the interclass correlations for each landmark in the x and y planes were between 0.96 and 0.99, except for stomion superior in Maxilim (0.83). The 95% confidence interval and the absolute mean of the error showed that errors in the Dolphin software were greater than those in the Maxilim software, but the differences were not significant ( P >0.05), except for soft-tissue A-point. The greatest errors were seen in the chin region. The prediction errors of the nasolabial and mentolabial angles were greater; the prediction error in the Dolphin software was 9°, which has clinical significance.
Conclusions
The Dolphin and Maxilim softwares are both appropriate for clinical use. Their inaccuracies in the prediction of the chin region should be considered in complicated surgical planning.
Correcting dentofacial deformities needs a combination of orthodontic and surgical approaches. Assessment of the results is based not only on the correction of malocclusion, but also on the esthetic improvement of the face. Facial appearance is a key factor in a person’s social life, and people are sensitive to facial changes after orthognathic surgery. Lateral cephalometric analysis and computer predictions are helpful for quantification of treatment plans, presurgical orthodontic preparations, comparison of different treatment plans, improved surgical outcomes, communications with other members of the interdisciplinary team, and database management. It is crucial to assess the feasibility of the treatment plan to optimize case management. Several software packages are designed for prediction in orthognathic surgery. The 2-dimensional (2D) softwares are based on lateral cephalometrics and profile photographs, including Dentofacial Planner (Dentofacial Software, Toronto, Ontario, Canada), OPAL, Quick Ceph (Quick Ceph Systems, San Diego, Calif), TIOPS, and Dolphin (Dolphin Imaging & Mangement Solutions, Chatsworth, Calif) that simulate changes in the anteroposterior and vertical facial planes. The main shortcomings of these programs are the limitations of the algorithms in the prediction of soft-tissue changes and their inability to predict changes in the transverse plane. Three-dimensional (3D) prediction planning is based on cone-beam computed tomography (CBCT) or conventional computed tomography scans for 3D reconstruction of the skull and prediction in 3 planes of space. In addition, it is feasible to generate 3D facial models by color texture mapping. Three-dimensional systems are now becoming more popular because of their potential in presenting more realistic soft-tissue predictions. However, before applying prediction software in clinical practice, qualitative and quantitative validations are required; furthermore, it is important to define the magnitude, direction, and location of errors to evaluate the clinical impact of these errors. Several studies have assessed the accuracy and reliability of 2D prediction softwares, but the results were often conflicting, and most of these inaccuracies and controversies are related to soft-tissue predictions. There are limited studies evaluating Dolphin prediction accuracy; in most of them, only hard tissues were evaluated. For 3D prediction softwares, there is even less evidence regarding their validity and reliability. Maxilim software (Medicim, Sint-Niklaas, Belgium) is a 3D image-based environment for assessing the head’s anatomy and for preoperative planning for maxillofacial surgery and visualizing the expected soft-tissue outcome. In contrast to the Dolphin software, which uses linear ratios for the soft-tissue response, the Maxilim software uses computational strategies that can model the deformation behavior of the soft tissues to predict the patient’s postoperative look. Maxilim is based on a biomechanical simulation model that does not use hard-tissue or soft-tissue movement ratios to predict; instead, it mimics the elastic deformation behavior of the soft tisuues. The aim of this study was assess whether a 3D orthognathic planning package could predict the changes in the soft-tissue profile more accurately than 2D programs.
Material and methods
The sample consisted of 13 white adult patients over the age of 20 years (11 women, 2 men) who had orthognathic surgery in Monica Hospital in Antwerp, Belgium, in 2008 and 2009.
The inclusion criteria were the following: (1) all patients had a Le Fort I osteotomy alone or combined with a bilateral sagittal split osteotomy; (2) all had completed their growth; (3) all underwent presurgical orthodontic treatment and orthognathic surgery by the same surgeon and with a similar technique with a computer-generated surgical splint; and (4) presurgical records were taken no more than 2 weeks before surgery, and postoperative records were taken 4 months after surgery.
Preoperative and postoperative records were taken with the same CBCT machine. To minimize the effect of head position on the facial soft tissues, the following standard protocol was used during preoperative and postoperative scanning and photography procedures: the preoperative and postoperative scans were taken with the patients in natural head position while gently biting on a thin wafer in centric relation. Natural head position was obtained by asking the patient to look at his or her image in a mirror. Then the distance between the suprasternal notch and soft-tissue pogonion was measured. We called this distance the “natural head distance” and made sure that it was respected during the preoperative and postoperative scanning procedures, and the photographs were taken at the same time in this defined position.
The exclusion criteria were the following: (1) patients with congenital deformities or syndromes, such as cleft lip and palate; and (2) other adjunctive surgical procedures, such as rhinoplasty and liposuction.
There were 6 key stages for the predictions and data gathering (all performed by 1 operator [N.A.]): (1) magnification calibration, (2) landmark identification, (3) creation of predictions by Dolphin and Maxilim softwares; (4) superimposition of the 2 predictions on a postoperative profile photograph, (5) measuring the differences in soft-tissue outlines of the superimposed images, and (6) error estimation.
For the magnification calibration in the Dolphin software, 2 points 20 mm apart were marked on the lateral cephalograms using Photoshop software (CS3; Adobe, San Jose, Calif), and magnification calibration was done in the Dolphin software.
Landmarks were identified using the Dolphin software; 15 soft-tissue and 25 hard-tissue landmarks were digitized. The soft tissue landmarks were glabella, nasal dorsum, pronasale, subnasale, soft-tissue A-point, labrale superior, stomion superior, stomion inferior, soft-tissue B-point, pogonion, gnathian, menton, soft tissue nasion, labrale inferior, and throat point.
Predictions by the Dolphin software and the Maxilim software were created. Since validation of the accuracy of soft-tissue predictions was the aim of this study, the amounts of bony movement in 2 planes (anteroposterior and vertical) had to be the same as performed by the surgeon. Before creation of the predictions by the 2 softwares, the preoperative virtually osteotomized bone fragments of each patient were moved to the actual postoperative positions by the iterative closest point algorithm to achieve the best alignment and to align the surfaces of the maxilla and the mandible in 3 dimensions. The amount of bone displacement of each virtually osteotomized bony segment in the anteroposterior and vertical planes was considered to be the actual surgical movement and used by the softwares for prediction of the soft-tissue results.
For prediction by the Dolphin software, preoperative photographs were registered on CBCT synthetized lateral cephalometry radiographs. This process begins with the registration of subnasale of 2 images on each other, and then the magnification and orientation of the 2 images are matched manually. Using the magnified image of superimposition, it is possible to complete the process of superimposition by finite adjustment of the soft-tissue outlines of lateral cephalometry on the photograph boundaries to obtain the best fit of the images on each other.
In the Maxilim software, the 3D photographs are aligned to the CBCT skin surface automatically, and a head model is created. Although the Maxilim software can construct 3D images, just the 2D simulated profiles were used. Table I shows details of the bony movements and surgical procedures in each patient.
| Patient | Maxillary advancement (mm) | Maxillary impaction (mm) Anterior/posterior |
Bilateral sagittal split osteotomy (mm) | Genioplasty (mm) | |
|---|---|---|---|---|---|
| 1 | 4 | 3 | 3 | 2 | – |
| 2 | – | 3.5 | 3.5 | 4 | – |
| 3 | – | 5 | 5 | 3.5 | 2 |
| 4 | – | 4 | 4 | 6 | – |
| 5 | 3 | 2.5 | 2.5 | 4 | – |
| 6 | – | 6 | – | 7 | – |
| 7 | – | 5 | 5 | 4.5 | – |
| 8 | 3 | 4 | 4 | – | – |
| 9 | 4 | – | 4.5 | 5 | – |
| 10 | 4 | 3 | 1.5 | 4.5 | 4 |
| 11 | 3.5 | 2.5 | 2 | – | 2.5 |
| 12 | – | 5 | 2 | 5 | – |
| 13 | 0 | 5 | 5 | 3 | 5 |
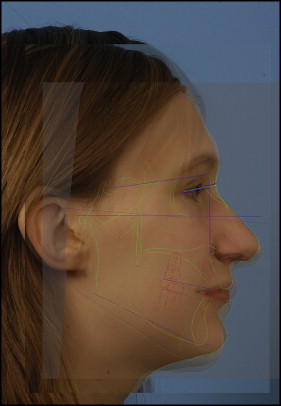
The 2 predictions were superimposed on the postoperative photograph. For superimposition and quantitative validation in our study, Adobe Photoshop was used, and the postoperative and the 2 predicted images were superimposed based on the best-fit method, so that the predicted and postoperative soft-tissue images were rigidly registered on each other based on unaltered surfaces. In our study, these included the surfaces above the infraorbital rim and the radix of the nose. In addition to the best fit of unaltered surfaces, well-defined facial landmarks were digitized, such as soft-tissue nasion, sella, nasion, and right-eye outer canthus. Then superimposition of the sella-nasion line and outer canthus–soft-tissue nasion line were used additionally for more accuracy ( Fig 1 ).
The same procedure that was used for the superimposition of the preoperative photographs on the preoperative CBCT image was applied to the superimposition of the postoperative photographs on the postoperative CBCT synthetized lateral cephalometric radiographs in the Dolphin software. These images were used as the Dolphin prediction photographs in Adobe Photoshop for quantitative validation.
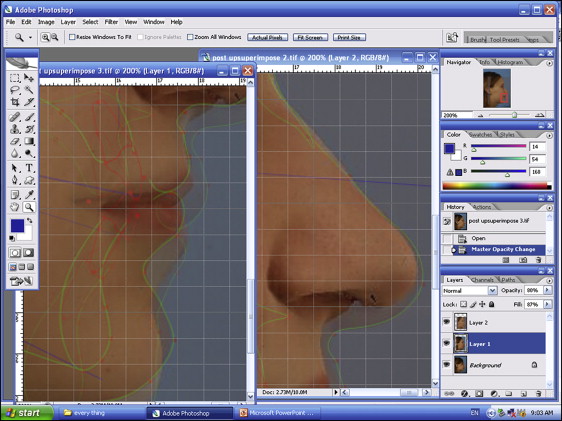
We measured the differences in the soft-tissue outlines of the superimposed images. Linear measurements between each predicted image and the postoperative profile photographs ( Fig 2 ) were measured.The differences between the computer predictions and the postoperation results were calculated for each landmark across the x-axis and y-axis. A negative value indicated that the computer prediction was more posterior in the x-axis or more superior in the y-axis compared with the postsurgical result.
The nasolabial and mentolabial angles were also measured.
Error of the method was assessed by analyzing the reliability and reproducibility of the method with the double determinant method by repeated digitizations of the landmarks.
Statistical analysis
All statistical analyses were carried out using SPSS software (version 11; SPSS, Chicago, Ill). Descriptive statistics, paired-sample t tests, and interclass correlations were used.
Results
The error range of the Dolphin software in predicting the horizontal position of the soft-tissue landmarks was between −1.41 and 1.20 mm. The greatest errors were related to pronasale, gnathion, menton, and stomion superior. For the rest of the landmarks, there was a high coefficient of reliability between the predicted and the actual postoperative photographs ( Table II ).
| Landmark | Mean (mm) | Minimum (mm) | Maximum (mm) | SD | Frequency of clinically acceptable error (%) ± 0.5 | 95% CI (maximum error) |
|---|---|---|---|---|---|---|
| Bridge of nose | −0.0008 | −1.14 | 0.20 | 0.823 | 92.3 | −0.33, 0.13 (0.46) |
| Pronasale | −0.0331 | −0.31 | 0.33 | 0.505 | 92.3 | −0.14, 0.07 (0.21) |
| Subnasale | −0.25 | −0.65 | 0.30 | 0.013 | 84.6 | −0.30, 0.09 (0.39) |
| A-point | 0.12 | −0.30 | 0.50 | 0.003 | 84.6 | −0.20, 0.17 (0.40) |
| Labrale superior | 0.12 | −0.45 | 0.65 | 0.124 | 92.3 | −0.39, 0.09 (0.48) |
| Stomion superior | 0.10 | −0.30 | 1.02 | 0.004 | 92.3 | −0.36, 0.13 (0.20) |
| Stomion inferior | −0.05 | −0.60 | 0.80 | 0.305 | 84.6 | −0.23, 0.12 (0.36) |
| Labrale inferior | −0.06 | −0.40 | 0.80 | 0.091 | 84.6 | −0.32, 0.03 (0.47) |
| B-point | −0.02 | −0.75 | 0.70 | 0.906 | 60.6 | −0.26, 0.21 (0.52) |
| Pogonion | −0.04 | −0.95 | 0.90 | 0.972 | 76.9 | −0.30, 0.22 (0.64) |
| Gnathion | 0.05 | −0.70 | 1.10 | 0.834 | 56.6 | −0.25, 0.37 (0.62) |
| Menton | 0.00 | −1.00 | 1.20 | 0.696 | 69.2 | −0.32, 0.32 (0.64) |
Variability in the vertical position of the predicted landmarks was between −1.85 and 1.55 mm. The maximum vertical errors were seen in subnasale, gnathion, pogonion, and menton. The reliability coefficients were above 0.97 for each predicted landmark ( Table III ).
| Landmark | Mean (mm) | Minimum (mm) | Maximum (mm) | SD | Frequency of clinically acceptable error (%) ± 0.5 | 95% CI (maximum error) |
|---|---|---|---|---|---|---|
| Bridge of nose | −0.008 | −0.20 | 0.12 | 0.087 | 100 | −0.02, 0.04 (0.10) |
| Pronasale | 0.196 | −0.30 | 0.60 | 0.156 | 92.3 | −0.05, 0.33 (0.38) |
| Subnasale | 0.079 | −1.85 | 0.50 | 0.603 | 92.3 | −0.46, 1.12 (0.64) |
| A-point | 0.126 | −0.30 | 0.50 | 0.246 | 92.3 | 0.01, 0.26 (0.26) |
| Labrale superior | 0.125 | −0.45 | 0.65 | 0.351 | 92.3 | −0.06, 0.31 (0.36) |
| Stomion superior | 0.102 | −0.32 | 1.02 | 0.388 | 92.3 | 0, 0.40 (0.40) |
| Stomion inferior | −0.034 | −0.50 | 1.05 | 0.378 | 84.6 | −0.23, 0.16 (0.40) |
| Labrale inferior | 0.066 | −0.40 | 0.80 | 0.332 | 92.3 | −0.24, 0.11 (0.35) |
| B-point | 0.042 | −0.40 | 1.15 | 0.40 | 92.3 | −0.18, 0.26 (0.44) |
| Pogonion | 0.167 | −0.65 | 1.25 | 0.502 | 69.2 | −0.10, 0.42 (0.52) |
| Gnathion | 0.069 | −0.70 | 1.55 | 0.596 | 76.9 | −0.26, 0.30 (0.64) |
| Menton | 0.000 | −1.00 | 1.20 | 0.594 | 69.2 | −0.32, 0.32 (0.64) |
The correlations of the predicted nasolabial and mentolabial angular measurement with the actual results were 0.72 and 0.81.
The range of error for the Maxilim software in the horizontal positions of the predicted landmarks was between −1.60 and 1.50 mm. The greatest errors in horizontal positions were observed in menton, gnathion, and pogonion ( Table IV ). In the vertical direction, the variability ranged between −4.25 and 2.42 mm. The positions of the predicted landmarks in the Maxilim software were highly correlated to the actual results in both the horizontal and vertical dimensions. The weakest correlation was observed between the vertical positions of stomion superior, at 0.83 ( Table V ).


