Introduction
The purposes of this study were to examine and compare the craniofacial growth in girls with Class I or Class II occlusion from the ages of 9 to 18.
Methods
Twenty-five Class I (ANB, 1°-4°) and 21 Class II (ANB, >4°) untreated Caucasian girls were selected from the Burlington Growth Centre in Toronto, Ontario, Canada. Cephalograms of each subject at ages 9, 14, and 18 years were traced, and 29 parameters were measured. The growth changes in each parameter from ages 9 to 14, 14 to 18, and 9 to 18 were calculated, and comparisons of each parameter were made between the 2 groups.
Results
From ages 9 to 14, the Class I and Class II groups had similar skeletal growth patterns (increases of SNA and SNB angles, decreases of ANB, MP-SN, and gonial angles). Dentally, the Class II group showed less maxillary incisal proclination and more overbite than did the Class I group. From ages 14 to 18, the 2 groups also showed similar growth patterns, with little sagittal but continued vertical growth, and the MP-SN angle continued to decrease. From ages 9 to 18 (combined periods of 9-14 and 14-18), the 2 groups showed similar skeletal growth, with the exception of a slightly higher ANS-ME/N-Me in the Class I group. Dental changes were similar in the 2 groups, except that overbite increased slightly more in the Class II group.
Conclusions
Overall, the craniofacial growth patterns of Class I and Class II girls were similar. With growth, the face became more flattened with a decrease of the ANB angle, and the mandible demonstrated forward rotation with decreases of the MP-SN and gonial angles, and an increase of PFH:AFH.
Highlights
- •
Craniofacial growth patterns in Class I and Class II girls are similar from ages 9 to 18 years.
- •
With growth, the face becomes flatter, and the mandible rotates forward.
- •
The ANB, MP-SN, and gonial angles decrease, and PFH:AFH (%) increases.
It is widely agreed by orthodontists that understanding craniofacial growth and development is essential in making a proper diagnosis and treatment planning for children. This knowledge is needed to help the orthodontist predict the child’s magnitude and direction of facial growth and choose appropriate appliances to achieve the most favorable and stable results possible.
Studies have shown that 60% to 70% of children have a Class I malocclusion, and 20% to 30% have a Class II malocclusion. Facial growth of Class I and Class II children is an intriguing subject for orthodontists and has been studied extensively for many years. For example, Sinclair and Little examined facial growth of Class I boys and girls from the mixed dentition through early adulthood using cephalometric analysis. They found increases in the SNA and SNB angles, and decreases in the ANB and mandibular plane angles in these children. Similar results were reported by Chung and Mongiovi, who studied the craniofacial growth of Class I boys and girls from ages 9 to 18 years. Foley and Mamandras examined facial growth of Class I female subjects from postpuberty through adulthood and found that the mandible continued to grow and remodel during this period, resulting in a more flattened mandibular plane.
Ngan et al studied facial growth changes of Class I and Class II girls from ages 7 to 14 years and reported that the mandibular plane became steeper as the mandible grew downward and backward, leading to a larger ANB angle. Contrarily, in a longitudinal study, Chung and Wong found that from ages 9 to 18, Class II male and female subjects showed downward and forward growth of the mandible and a decrease of the ANB angle.
Bishara et al examined the facial growth of children from the deciduous dentition through the permanent dentition. They reported that the growth in mandibular length was similar between the Class I and Class II groups, and the mandibular plane angle became more flattened in both groups. Differently, Stahl et al reported that from ages 10 to 15, the Class II subjects had significantly smaller increments in mandibular growth than did the Class I subjects. They also found a growth deficiency of ramus height in the Class II group that would cause backward rotation of the mandible. Baccetti et al investigated the postpubertal growth of Class I and Class II male and female subjects at ages 15.8 and 19 years. They found that the growth during this period was similar between the 2 groups.
Clearly, there is plenty of literature reporting on the craniofacial growth of Class I and Class II children, but there is still no consensus on how Class I and Class II children grow from childhood to adulthood compared with one another. Therefore, the purposes of this study were to investigate and compare the craniofacial growth of untreated Class I and Class II girls from ages 9 to 18 years.
Material and methods
The sample consisted of 46 Caucasian female subjects (25 Class I, 21 Class II) from the Burlington Growth Centre, Toronto, Ontario, Canada. They were selected based on the following criteria: (1) lateral cephalograms available at ages 9, 14, and 18; (2) Class I subjects with an ANB angle between 1° and 4° (at age 18); (3) Class II Division 1 subjects with an ANB angle greater than 4° (at age 18); (4) skeletal age within 1 year of chronologic age based on hand-wrist film as determined by Greulich and Pyle ; and (5) in good health with no prior orthodontic treatment.
The cephalograms were all taken at a magnification of 9.84%. They were traced using Quick Ceph Studio software (version 3.3.1; Quick Ceph Systems, San Diego, Calif) by the same operator (S.S.Y.). The cephalometric landmarks were chosen, and the following measurements were made, as shown in the Figure .
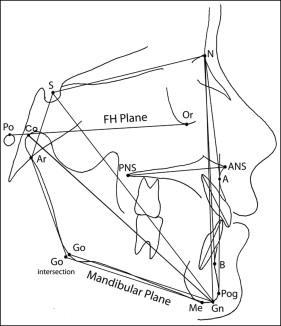
The sagittal measurements were the SNA, SNB, ANB, and convexity (N-A-Pog) angles, and Pog-NB (effective chin), ACB (anterior cranial base), mandibular corpus length (Go intersection-Me), and mandibular length (Co-Gn).
The vertical measurements were MP-SN, PP-SN (palatal plane ANS-PNS to SN), and facial taper (N-Gn-Go) angles, AFH (anterior facial height, N-Me), PFH (posterior facial height, S-Go intersection), PFH:AFH, ANS-Me (lower facial height), ANS-Me/N-Me (LFH:AFH), saddle angle (N-S-Ar), articular angle (S-Ar-Go intersection), gonial angle (Ar-Go intersection to MP), ramus height (Ar-Go), PCB (posterior cranial base, S-Ar), and y-axis (FH to S-Gn).
The dental measurements were 1/ to NA (maxillary incisor to NA), /1 to NB (mandibular incisor to NB), interincisal angle, overbite, overjet, 1/ to NA angle (maxillary incisor to NA), and /1 to NB angle (mandibular incisor to NB).
To determine intraexaminer reliability, 10 randomly chosen lateral cephalograms were retraced by the same examiner (S.S.Y.) 3 days after the initial tracing and analyzed with the same software to determine the error resulting from landmark selection or tracing. A paired t test was used for all measurements to determine whether they were within acceptable limits. To determine interexaminer reliability, the same cephalograms were traced by another examiner using the same software. A paired t test was used to determine whether there was any significant error between the examiners. The significance of differences was predetermined at P ≤0.05. A post-hoc power analysis was done on the SNB angle to determine the ideal sample size at 0.80 using G*Power software (version 3.1.9.2; Department of Psychology, University of Düsseldorf, Düsseldorf, Germany).
The means and standard deviations were calculated for each cephalometric variable (measurement), and the differences of each variable between and within the groups were tested with 1-way analysis of variance. The significance of the differences was predetermined at P ≤0.05.
Results
The evaluation of both intraexaminer and interexaminer errors showed no statistically significant differences between the angular or the linear measurements. The intraexaminer results showed mean differences of 0.30 mm in linear measurements and 0.4° in angular measurements, with a P value of 0.566 and an average Pearson coefficient of greater than 95%. The interexaminer results showed mean differences of 0.46 mm in linear measurements and 0.5° in angular measurements with a P value of 0.516 and an average Pearson coefficient greater than 95%. The power analysis showed that the ideal sample size should be between 79 and 143 subjects.
The means and standard deviations of each measurement at ages 9, 14, and 18 for the Class I and Class II groups are shown in Tables I, II, and III . The differences between the 2 groups, with the corresponding P values, are also shown in Tables I, II, and III . Table I shows, at age 9, significant differences between the Class I and Class II subjects for SNA, ANB, convexity, corpus length, PFH, mandibular incisor position, and overjet. Table II shows that SNA, ANB, convexity, corpus length, and overjet differences between the Class I and Class II groups were still statistically significant at age 14. The differences in mandibular length and maxillary incisor position were also statistically significant. Table III shows that by age 18, the differences in SNA, ANB, convexity, mandibular length, mandibular incisor position, overjet, and mandibular incisor angle were statistically significant.
| Class I | Class II | Difference | P value | |||
|---|---|---|---|---|---|---|
| Mean | SD | Mean | SD | |||
| Sagittal | ||||||
| SNA (°) | 80.35 | 2.50 | 82.42 | 3.11 | 2.07 | 0.016 ∗ |
| SNB (°) | 77.29 | 2.47 | 76.67 | 2.54 | 0.62 | 0.421 |
| ANB (°) | 2.91 | 0.77 | 5.77 | 1.64 | 2.86 | <0.001 ∗ |
| Convexity (°) | 5.68 | 2.19 | 11.79 | 3.87 | 6.11 | <0.001 ∗ |
| Pog-NB (mm) | 0.37 | 1.45 | −1.10 | 1.54 | 1.47 | 0.299 |
| ACB (mm) | 72.38 | 2.47 | 72.83 | 3.73 | 0.45 | 0.621 |
| Corpus length (mm) | 68.30 | 3.31 | 66.41 | 2.94 | 1.89 | 0.048 ∗ |
| Co-Gn (mm) | 114.83 | 4.70 | 112.40 | 5.26 | 2.43 | 0.105 |
| Vertical | ||||||
| MP-SN (°) | 34.04 | 4.39 | 34.13 | 4.39 | 0.09 | 0.943 |
| PP-SN (°) | 8.00 | 3.25 | 8.28 | 2.49 | 0.28 | 0.755 |
| Facial taper (°) | 68.32 | 3.34 | 69.23 | 3.38 | 0.91 | 0.366 |
| AFH (mm) | 115.48 | 5.45 | 114.19 | 5.82 | 1.29 | 0.439 |
| PFH (mm) | 73.42 | 3.55 | 72.50 | 4.20 | 0.92 | <0.001 ∗ |
| PFH:AFH (%) | 63.68 | 3.70 | 63.58 | 3.76 | 0.10 | 0.928 |
| ANS-Me (mm) | 64.74 | 4.20 | 64.00 | 4.72 | 0.74 | 0.566 |
| ANS-Me/N-Me (%) | 56.03 | 1.90 | 56.11 | 1.76 | 0.08 | 0.880 |
| Saddle angle (°) | 122.73 | 5.19 | 122.26 | 5.05 | 0.47 | 0.756 |
| Articular angle (°) | 145.68 | 4.46 | 145.84 | 8.88 | 0.16 | 0.933 |
| Gonial angle (°) | 125.62 | 4.68 | 126.21 | 6.35 | 0.59 | 0.719 |
| Ramus height (mm) | 42.71 | 3.28 | 43.03 | 4.61 | 0.32 | 0.782 |
| PCB (mm) | 34.08 | 2.08 | 34.80 | 8.66 | 0.72 | 0.685 |
| Y-axis (°) | 59.54 | 2.63 | 59.49 | 3.24 | 0.05 | 0.947 |
| Dental | ||||||
| 1/ to NA (mm) | 4.78 | 1.68 | 4.27 | 1.95 | 0.51 | 0.345 |
| /1 to NB (mm) | 5.11 | 1.46 | 6.53 | 2.43 | 1.42 | 0.019 ∗ |
| Interincisal angle (°) | 123.70 | 7.66 | 119.13 | 7.93 | 4.57 | 0.054 |
| Overbite (mm) | 1.00 | 1.29 | 0.41 | 2.43 | 0.59 | 0.295 |
| Overjet (mm) | 3.78 | 1.07 | 4.99 | 1.61 | 1.21 | <0.001 ∗ |
| 1/ to NA (°) | 25.24 | 5.30 | 24.09 | 5.50 | 1.15 | 0.475 |
| /1 to NB (°) | 27.94 | 5.37 | 30.99 | 6.28 | 3.05 | 0.083 |
| Class I | Class II | Difference | P value | |||
|---|---|---|---|---|---|---|
| Mean | SD | Mean | SD | |||
| Sagittal | ||||||
| SNA (°) | 81.51 | 2.74 | 83.58 | 2.88 | 2.07 | 0.017 ∗ |
| SNB (°) | 79.48 | 2.88 | 78.60 | 2.27 | 0.88 | 0.264 |
| ANB (°) | 2.00 | 0.84 | 5.05 | 1.63 | 3.05 | <0.001 ∗ |
| Convexity (°) | 2.81 | 2.14 | 9.24 | 4.31 | 6.43 | <0.001 ∗ |
| Pog-NB (mm) | 1.50 | 1.35 | 1.24 | 2.07 | 0.26 | 0.598 |
| ACB (mm) | 76.31 | 2.42 | 77.06 | 3.57 | 0.75 | 0.402 |
| Corpus length (mm) | 76.73 | 3.93 | 73.76 | 3.78 | 2.97 | 0.012 ∗ |
| Co-Gn (mm) | 128.70 | 5.45 | 124.77 | 5.98 | 3.93 | 0.023 ∗ |
| Vertical | ||||||
| MP-SN (°) | 32.06 | 5.60 | 31.59 | 4.63 | 0.47 | 0.757 |
| PP-SN (°) | 7.29 | 3.23 | 8.07 | 2.48 | 0.78 | 0.371 |
| Facial taper (°) | 67.71 | 4.11 | 69.19 | 3.78 | 1.48 | 0.213 |
| AFH (mm) | 126.95 | 6.68 | 124.14 | 6.37 | 2.81 | 0.155 |
| PFH (mm) | 83.32 | 4.92 | 82.31 | 4.78 | 1.01 | 0.615 |
| PFH:AFH (%) | 65.78 | 4.78 | 66.44 | 3.93 | 0.66 | 0.615 |
| ANS-Me (mm) | 71.29 | 5.51 | 69.40 | 5.09 | 1.89 | 0.236 |
| ANS-Me/N-Me (%) | 56.09 | 2.10 | 55.38 | 1.94 | 0.71 | 0.245 |
| Saddle angle (°) | 123.26 | 5.43 | 122.52 | 4.13 | 0.74 | 0.490 |
| Articular angle (°) | 143.78 | 6.63 | 144.82 | 6.83 | 1.04 | 0.604 |
| Gonial angle (°) | 124.67 | 5.65 | 124.27 | 6.40 | 0.40 | 0.823 |
| Ramus height (mm) | 50.13 | 3.92 | 49.88 | 4.90 | 0.25 | 0.847 |
| PCB (mm) | 38.18 | 2.38 | 38.21 | 8.69 | 0.03 | 0.985 |
| Y-axis (°) | 59.16 | 2.25 | 59.32 | 3.65 | 0.16 | 0.849 |
| Dental | ||||||
| 1/ to NA (mm) | 5.78 | 1.93 | 4.26 | 2.18 | 1.52 | 0.016 ∗ |
| /1 to NB (mm) | 6.00 | 2.89 | 6.91 | 2.54 | 0.91 | 0.265 |
| Interincisal angle (°) | 125.76 | 8.80 | 123.79 | 8.88 | 1.97 | 0.455 |
| Overbite (mm) | 1.65 | 1.45 | 2.45 | 1.73 | 0.80 | 0.096 |
| Overjet (mm) | 3.58 | 1.02 | 4.99 | 1.61 | 1.41 | <0.001 ∗ |
| 1/ to NA (°) | 31.65 | 3.14 | 20.86 | 5.93 | 10.79 | 0.129 |
| /1 to NB (°) | 26.80 | 5.69 | 30.30 | 6.32 | 3.50 | 0.056 |
| Class I | Class II | Difference | P value | |||
|---|---|---|---|---|---|---|
| Mean | SD | Mean | SD | |||
| Sagittal | ||||||
| SNA (°) | 82.08 | 2.12 | 84.40 | 2.96 | 2.32 | 0.003 ∗ |
| SNB (°) | 80.08 | 2.26 | 79.56 | 2.55 | 0.52 | 0.470 |
| ANB (°) | 1.99 | 0.69 | 4.85 | 1.71 | 2.86 | <0.001 ∗ |
| Convexity (°) | 2.08 | 2.07 | 8.51 | 4.25 | 6.43 | <0.001 ∗ |
| Pog-NB (mm) | 2.04 | 1.57 | 1.51 | 1.90 | 0.53 | 0.309 |
| ACB (mm) | 76.99 | 2.88 | 77.74 | 3.80 | 0.75 | 0.456 |
| Corpus length (mm) | 78.82 | 4.25 | 76.42 | 3.88 | 2.40 | 0.053 |
| Co-Gn (mm) | 132.81 | 5.53 | 129.12 | 6.01 | 3.69 | 0.037 ∗ |
| Vertical | ||||||
| MP-SN (°) | 30.66 | 5.62 | 30.11 | 5.23 | 0.55 | 0.733 |
| PP-SN (°) | 6.77 | 3.30 | 7.51 | 2.90 | 0.74 | 0.424 |
| Facial taper (°) | 67.67 | 4.49 | 70.18 | 4.03 | 2.51 | 0.050 |
| AFH (mm) | 128.32 | 6.36 | 125.73 | 6.62 | 2.59 | 0.184 |
| PFH (mm) | 86.02 | 4.94 | 85.40 | 5.22 | 0.62 | 0.681 |
| PFH:AFH (%) | 67.16 | 4.64 | 68.01 | 4.28 | 0.85 | 0.522 |
| ANS-Me (mm) | 72.35 | 6.62 | 70.99 | 5.61 | 1.36 | 0.459 |
| ANS-Me/N-Me (%) | 56.78 | 2.26 | 55.90 | 2.08 | 0.88 | 0.176 |
| Saddle angle (°) | 123.66 | 4.64 | 122.48 | 4.12 | 1.18 | 0.371 |
| Articular angle (°) | 144.04 | 5.00 | 144.73 | 7.29 | 0.69 | 0.707 |
| Gonial angle (°) | 123.20 | 5.37 | 123.50 | 8.51 | 0.30 | 0.881 |
| Ramus height (mm) | 51.88 | 4.75 | 52.52 | 4.98 | 0.64 | 0.656 |
| PCB (mm) | 38.50 | 2.41 | 38.70 | 8.87 | 0.20 | 0.914 |
| Y-axis (°) | 58.33 | 2.60 | 57.82 | 3.01 | 0.51 | 0.541 |
| Dental | ||||||
| 1/ to NA (mm) | 5.94 | 2.41 | 4.73 | 2.24 | 1.21 | 0.085 |
| /1 to NB (mm) | 5.34 | 2.41 | 7.34 | 2.91 | 2.00 | 0.013 ∗ |
| Interincisal angle (°) | 126.96 | 8.74 | 123.06 | 9.19 | 3.90 | 0.148 |
| Overbite (mm) | 1.98 | 1.44 | 2.67 | 1.57 | 0.69 | 0.128 |
| Overjet (mm) | 3.78 | 1.40 | 4.82 | 1.66 | 1.04 | 0.024 ∗ |
| 1/ to NA (°) | 24.41 | 5.57 | 21.18 | 6.59 | 3.23 | 0.078 |
| /1 to NB (°) | 26.58 | 5.65 | 30.91 | 6.33 | 4.33 | 0.018 ∗ |
Table IV shows the comparison of growth changes of the Class I and Class II groups from ages 9 to 14. Statistically significant growth changes were AFH, which was shorter in the Class II subjects, and dental measurements such as maxillary incisor position, overbite, and maxillary incisor angle.
| Class I | Class II | P value | |||
|---|---|---|---|---|---|
| Mean change | SD | Mean change | SD | ||
| Sagittal | |||||
| SNA (°) | 1.16 | 1.44 | 1.16 | 1.56 | 0.995 |
| SNB (°) | 2.20 | 1.76 | 1.94 | 1.62 | 0.586 |
| ANB (°) | −0.90 | 0.67 | −0.73 | 0.91 | 0.454 |
| Convexity (°) | −2.87 | 1.89 | −2.54 | 2.07 | 0.578 |
| Pog-NB (mm) | 1.16 | 0.86 | 1.35 | 0.81 | 0.435 |
| ACB (mm) | 3.94 | 1.15 | 4.23 | 2.25 | 0.573 |
| Corpus length (mm) | 8.42 | 1.96 | 7.34 | 1.92 | 0.068 |
| Co-Gn (mm) | 13.87 | 3.07 | 12.37 | 3.60 | 0.066 |
| Vertical | |||||
| MP-SN (°) | −1.98 | 0.42 | −2.55 | 1.75 | 0.329 |
| PP-SN (°) | −0.72 | 1.48 | −0.21 | 2.11 | 0.346 |
| Facial taper (°) | −0.61 | 1.82 | −0.04 | 1.51 | 0.257 |
| AFH (mm) | 11.46 | 2.14 | 9.96 | 2.48 | 0.032 ∗ |
| PFH (mm) | 9.89 | 3.61 | 9.87 | 2.33 | 0.974 |
| PFH:AFH (%) | 2.09 | 2.81 | 2.85 | 1.65 | 0.280 |
| ANS-Me (mm) | 6.55 | 2.38 | 5.40 | 3.06 | 0.158 |
| ANS-Me/N-Me (%) | 0.06 | 1.26 | −0.73 | 1.50 | 0.059 |
| Saddle angle (°) | 0.53 | 2.94 | 0.26 | 3.10 | 0.767 |
| Articular angle (°) | −1.89 | 3.90 | −1.02 | 4.69 | 0.497 |
| Gonial angle (°) | −0.95 | 3.01 | −1.94 | 2.51 | 0.238 |
| Ramus height (mm) | 7.42 | 2.73 | 6.84 | 1.93 | 0.421 |
| PCB (mm) | 4.09 | 2.45 | 3.40 | 1.35 | 0.251 |
| Y-axis (°) | −0.39 | 1.50 | −0.16 | 2.28 | 0.689 |
| Dental | |||||
| 1/ to NA (mm) | 0.95 | 1.25 | −0.01 | 1.70 | 0.025 ∗ |
| /1 to NB (mm) | 0.89 | 2.81 | 0.39 | 1.32 | 0.457 |
| Interincisal angle (°) | 2.06 | 7.43 | 4.66 | 7.50 | 0.247 |
| Overbite (mm) | 0.65 | 1.92 | 2.04 | 2.27 | 0.029 ∗ |
| Overjet (mm) | −0.20 | 1.12 | −0.56 | 1.63 | 0.383 |
| 1/ to NA (°) | −0.11 | 3.88 | −3.23 | 5.64 | 0.023 ∗ |
| /1 to NB (°) | −1.12 | 5.55 | −0.69 | 3.02 | 0.753 |
Stay updated, free dental videos. Join our Telegram channel
VIDEdental - Online dental courses


