Introduction
The aims of our study were to assess nasopharyngeal soft-tissue characteristics in white patients with Class III malocclusion and to compare the results with patients with ideal occlusion.
Methods
A sample of 71 patients with Class III malocclusion was selected from the Dental School at the Complutense University of Madrid. None of the subjects had a history of upper airway disease, adenoidectomy, or pathology in the pharynx. Lateral cephalograms were digitized, and linear and area measures were made to define the airway characteristics. Error analysis was performed to prevent systematic or random errors. Independent means t tests and Pearson correlation analysis were used to evaluate sex differences and the correlations among the variables. A discriminant analysis was also used to identify different groups with excellent occlusion and Class III malocclusion.
Results
Nasopharyngeal soft-tissue characteristics in Class III subjects were different in male and female subjects. Adenoidal tissue and upper airway length were greater in the men. Three groups of variables tended to be related among themselves but not with others. A discriminant analysis showed that changes in cranial base length are directly related to nasopharyngeal morphology in Class III malocclusion. A discriminant equation was also obtained.
Conclusions
This study suggests new lines of investigation about the relationship between skeletal and dental anomalies and airway obstruction, and possible specific respiratory characteristics for each type of malocclusion.
The influence of the soft tissues on craniofacial growth has been discussed in the orthodontic literature for many years. Since 1873, authors have studied airway obstruction and its effects on malocclusion development. In general, obstructive disorders are thought to be responsible for muscular imbalances such as greater extensions in head posture, changes in tongue position, or lip incompetence, and these have been cited as etiologic factors for malocclusions. It has been also suggested that skeletal Class III with maxillary hypoplasia is a cause of upper pharynx constriction. The effects of rapid maxillary expansion associated with maxillary protraction on pharyngeal dimensions demonstrated that maxillary protraction improves the nasopharyngeal airway dimensions. According to these facts, it can be assumed that a skeletal Class III malocclusion is associated with an abnormal airway.
Class III malocclusions are relatively frequent in Spain, affecting up to 16% of people, depending on the region. On the other hand, a person with mild skeletal Class III does not always show a dental Class III relationship. Some patients have an excellent occlusion. The muscular environment partly determines the correct dental relationship, but can the nasopharyngeal airway be 1 factor that makes an excellent occlusion possible in patients with slight skeletal disharmonies? Normal values can be described under skeletal, occlusal, and esthetic points of view, but when can we consider an airway as “normal”? Is this normality valid for different malocclusions? Is a specific airway characteristic related to a specific malocclusion?
The literature includes few articles relating airway with occlusion. A recent study analyzed the airway in Chinese subjects with skeletal Class I, but not directly with occlusion. Skeletal classification is a useful tool to evaluate the airway when comparing groups with pronounced skeletal differences but, under our assumption, makes the mistake of classifying a mild skeletal disharmony with an ideal airway and a muscular balance.
In a previous study, we showed the nasopharyngeal norms of ideal occlusion in a Spanish population and the relationships between the variables. The aims of this study were to describe the nasopharyngeal characteristics of Class III malocclusion and to compare the results with those obtained previously for excellent occlusion. The objectives of this study were to (1) identify soft-tissue nasopharyngeal characteristics in adults with excellent occlusion and Class III malocclusion, (2) evaluate sexual dimorphism in soft-tissue airway structure of subjects with excellent occlusion and Class III malocclusion, (3) establish a possible relationship between soft-tissue measurements with cranial structures in these patients, (4) establish nasopharyngeal differences between Class III subjects and a control group, and (5) determine a discriminant equation based on cranial structures.
Material and methods
We selected 162 adults from the data base of the Dental School at Complutense University, Madrid, Spain. This sample was divided into 2 groups: excellent occlusion (n = 91; 55 men, 36 women) and Class III malocclusion (n = 71; 33 men, 38 women).
Our selection criteria were white adults with no previous orthodontic treatment in both groups; and excellent occlusion with correct overjet and overbite, bilateral molar and canine Class I relationships, balanced occlusion, and no history of sleep disorders, snoring, sleep apnea, upper airway disease, adenoidectomy, or pathology in the pharynx in the control group. Our exclusion criteria included tooth rotations over 25°, crowding greater than 3 mm, posterior crossbite, and craniofacial anomalies.
The selection criteria for the Class III group included a dental Class III relationship; no craniofacial syndromes, deformities, or asymmetries; sealed lips in a relaxed position; optimal periodontal health; and no missing teeth. Overjet and overbite values were −2 ± 1 and 1 ± 1 mm, respectively.
Cephalograms of all subjects were taken in natural head position. Good definition, molars in maximum intercuspation, and lips sealed in a relaxed position were also required. All radiographs were digitized by the same investigator (O.M.) using a computerizated tracing program.
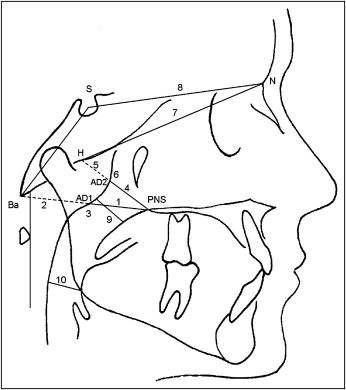
The following cephalometric measurements were selected ( Figs 1 and 2 ).
- 1.
PNS-AD1: lower aerial width, the distance between PNS and the nearest adenoid tissue measured through the PNS-Ba line (AD1).
- 2.
AD1-Ba: lower adenoid width, defined as the soft-tissue thickness at the posterior nasopharynx wall through the PNS-Ba line.
- 3.
PNS-Ba: lower airway width, the distance between PNS and Ba—the sum of variables 1 and 2.
- 4.
PNS-AD2: upper aerial width, the distance between PNS and the nearest adenoid tissue measured through a perpendicular line to S-Ba from PNS (AD2).
- 5.
AD2-H: upper adenoid width, defined as the soft-tissue thickness at the posterior nasopharynx wall through the PNS-H line.
- •
Hormion (H): the cephalometric point located near the adenoidal tissue at the cranial base, localized where a perpendicular to S-Ba line crosses the sphenoid bone. The variations of this point are minimal because it is located far from growing sites.
- 6.
PNS-H: upper airway width, the distance between PNS and H—the sum of variables 1 and 2.
- 7.
N-H: nasal fossa length, the distance between N and H.
- 8.
S-N: anterior cranial base.
- 9.
McNamara’s upper pharynx dimension: the minimum distance between the upper soft palate and the nearest point on the posterior pharynx wall.
- 10.
McNamara’s lower pharynx dimension: the minimum distance between the point where the posterior tongue contour crosses the mandible and the nearest point on the posterior pharynx wall.
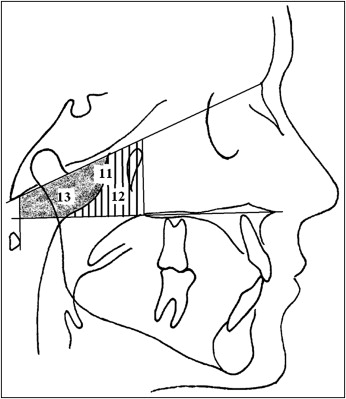
- 11, 12, and 13.
Total, adenoidal, and aerial areas, using the method of Handelman and Osborne. This method takes as references the Ba-N plane, the bispinal plane, and 2 perpendicular lines to the bispinal plane: one crosses the more anterior point at the atlas vertebra, and other crosses the PNS. The resulting trapezoid is divided into 2 spaces (aerial and adenoid). The total area is the sum of the adenoidal and aerial areas.
To assess measurement error, duplicate tracings of 25 films were made by the same investigator, and the random method was used as described by Dahlberg.
The mean difference between the first and second measurements, the standard error of a single measurement, and the percentage of total variance attributable to measurement errors were calculated for each variable. Method error was determined as suggested by Houston with the formula <SPAN role=presentation tabIndex=0 id=MathJax-Element-1-Frame class=MathJax style="POSITION: relative" data-mathml='ME=∑d22n’>ME=∑d22n−−−−√ME=∑d22n
ME = ∑ d 2 2 n
where d is the difference between measured pairs, and n is the number of pairs.
The error method is comparable with that used in other cephalometric studies and explained less than 10% of the biologic variance.
The mean differences were less than 1.0 mm, except for the adenoidal and aerial areas: the mean differences were less than 4 mm The errors tended to be greater when the definition points were less precise: eg, the soft-tissue contours.
The coefficient of reliability was calculated by comparing the method error with the variance of the total sample and expressed as a percentage. Reliability varied from 97.86% to 99.71%.
Statistical analysis
Statistical analysis was performed in the Statistical Department at the Complutense University of Madrid. The subjects of each group were distributed in 2 subgroups (men and women) to compare sex differences. The Levine test was used to assess the equality of the groups’ variances. All measurements showed similar variances ( P >0.05), except for PNS-AD2 in the Class III group and N-H in the excellent occlusion group.
An independent-means t test, assuming equality of variances, was used for all variables except N-H and PNS-AD2. In these cases, an independent-means t test not assuming equality of variances was applied. Pearson correlations between cranial base and the variables were also calculated, as well as the amount of variance explained in the variables. Statistical significance was established by using a P value less than 0.05. A factorial analysis was applied to prove a group-dependant relationship among the variables, and a discriminant analysis was designed to obtain a predictive classification function.
Results
High standard deviations were noted in the parameters for adenoid, aerial, and total areas. Since the error method showed reliability near 99%, this means great interindividual variability. Most subjects in the control group had a skeletal Class I relationship, and all subjects in the Class III group had a skeletal Class III relationship.
Tables I and II show sexual dimorphism in the groups. Statistically significant differences ( P <0.05) were found in the Class III group for these variables: AD1-Ba, PNS-H, upper pharynx, and adenoidal area. The results suggest that men with Class III malocclusion have larger adenoid tissue areas than do women. Men also had greater sagittal thickness of the upper airway. Nasal fossa and cranial base were also greater in men but not statistically different from women.
| Men | Women | ||||||
|---|---|---|---|---|---|---|---|
| Mean | SD | SE | Mean | SD | SE | P value | |
| PNS-AD1 (mm) | 27.7 | 3.5 | 0.5 | 28.8 | 3.5 | 0.6 | |
| AD1-Ba (mm) | 21.5 | 2.1 | 0.4 | 19.4 | 3 | 0.5 | <0.05 |
| PNS-Ba (mm) | 49.3 | 3.6 | 0.5 | 48 | 3.3 | 0.5 | |
| PNS-AD2 (mm) | 25.6 | 4.2 | 0.6 | 25.7 | 3.6 | 0.6 | |
| AD2-H (mm) | 12 | 3.6 | 0.5 | 9.6 | 3.6 | 0.6 | <0.05 |
| PNS-H (mm) | 37.6 | 3 | 0.4 | 35.3 | 2.5 | 0.4 | <0.05 |
| N-H (mm) | 92.1 | 4.3 | 0.6 | 85.1 | 3 | 0.5 | <0.001 |
| S-N (mm) | 75.6 | 3.6 | 0.5 | 71.1 | 2.7 | 0.4 | <0.001 |
| Lower pharynx (mm) | 11.6 | 3.3 | 0.4 | 10.1 | 4 | 0.7 | |
| Upper pharynx (mm) | 17.3 | 3.9 | 0.5 | 17.5 | 3.1 | 0.5 | |
| Total area (mm 2 ) | 777.6 | 122.2 | 16.5 | 703 | 125.1 | 20.8 | <0.05 |
| Aerial area (mm 2 ) | 478.7 | 114.3 | 15.4 | 458.2 | 96.9 | 16.1 | |
| Adenoidal area (mm 2 ) | 298.9 | 111 | 15 | 244.9 | 97.4 | 16.2 | <0.05 |
| Men | Women | ||||||
|---|---|---|---|---|---|---|---|
| Mean | SD | SE | Mean | SD | SE | P value | |
| PNS-AD1 (mm) | 25.70 | 4.54 | 0.79 | 25.98 | 3.80 | 0.62 | |
| AD1-Ba (mm) | 23.51 | 4.39 | 0.76 | 21.22 | 3.52 | 0.57 | <0.05 |
| PNS-Ba (mm) | 49.18 | 6.32 | 1.10 | 47.23 | 5.24 | 0.85 | |
| PNS-AD2 (mm) | 23.31 | 7.11 | 1.24 | 21.29 | 3.10 | 0.50 | |
| AD2-H (mm) | 8.82 | 4.03 | 0.70 | 7.68 | 2.72 | 0.44 | |
| PNS-H (mm) | 31.20 | 4.95 | 0.86 | 28.69 | 3.58 | 0.58 | <0.05 |
| N-H (mm) | 70.17 | 6.93 | 1.21 | 67.27 | 6.30 | 1.02 | |
| S-N (mm) | 72.22 | 7.28 | 1.27 | 69.68 | 5.36 | 0.87 | |
| Lower pharynx (mm) | 12.60 | 3.69 | 0.64 | 12.59 | 3.07 | 0.50 | |
| Upper pharynx (mm) | 19.24 | 5.15 | 0.90 | 16.77 | 4.03 | 0.65 | <0.05 |
| Total area (mm 2 ) | 767.84 | 167.05 | 29.08 | 702.57 | 148.98 | 24.17 | |
| Aerial area (mm 2 ) | 447.25 | 121.54 | 21.16 | 435.69 | 103.96 | 16.86 | |
| Adenoidal area (mm 2 ) | 320.59 | 96.45 | 16.79 | 266.88 | 105.01 | 17.03 | <0.05 |
In the excellent occlusion group, all variables showed significant differences except for the upper pharynx dimension. Significant sexual dimorphism was also found for AD2-H in this group. Likewise, for the Class III malocclusion group, the men had a higher mean value than did the women.
Table III shows the Pearson correlations among cranial base and the variables in the groups. This table shows the correlation coefficient (r), the percentage of variance explained (r 2 ), and the P value for these correlations. In the Class III group, cranial base explained 59% of the changes in lower airway thickness and 61% of the changes in nasal fossa length. Because we hypothesized the existence of different groups in the excellent occlusion and the Class III malocclusion groups, a discriminant analysis was used to identify them. The results of the discriminant analysis are given in Tables IV and V .
| Variable | Excellent occlusion | Class III malocclusion |
|---|---|---|
| S-N | S-N | |
| PNS-AD1 | ||
| P value | 0.017 | <0.01 |
| % explanation | 5 | 22.94 |
| r value | 0.24 | 0.48 |
| AD1-Ba | ||
| P value | 0.0001 | <0.01 |
| % explanation | 15 | 38.07 |
| r value | 0.39 | 0.62 |
| PNS-Ba | ||
| P value | <0.0001 | <0.01 |
| % explanation | 33 | 59.75 |
| r value | 0.58 | 0.77 |
| PNS-AD2 | ||
| P value | NS | <0.01 |
| % explanation | 13.69 | |
| r value | 0.37 | |
| AD2-H | ||
| P value | NS | NS |
| % explanation | ||
| r value | ||
| PNS-H | ||
| P value | 0.0008 | <0.01 |
| % explanation | 11 | 51.12 |
| r value | 0.34 | 0.72 |
| N-H | ||
| P value | <0.0001 | <0.01 |
| % explanation | 47 | 61.15 |
| r value | 0.69 | 0.78 |
| S-N | ||
| P value | ||
| % explanation | 100 | 100.00 |
| r value | 1 | 1 |
| Lower pharynx | ||
| P value | NS | <0.05 |
| % explanation | 7.67 | |
| r value | 0.28 | |
| Upper pharynx | ||
| P value | NS | <0.01 |
| % explanation | 20.43 | |
| r value | 0.45 | |
| Total area | ||
| P value | 0.0002 | <0.01 |
| % explanation | 14 | 25.20 |
| r value | 0.38 | 0.50 |
| Aerial area | ||
| P value | 0.0071 | <0.01 |
| % explanation | 7 | 10.82 |
| r value | 0.28 | 0.33 |
| Adenoidal area | ||
| P value | NS | <0.01 |
| % explanation | 17.56 | |
| r value | 0.42 |
Stay updated, free dental videos. Join our Telegram channel
VIDEdental - Online dental courses


