Introduction
In this study, we aimed to evaluate the adenoidal nasopharyngeal ratio (ANR) on lateral cephalograms by assessing upper airway volumes using cone-beam computed tomography (CBCT) images as the validation method.
Methods
Fifty-five patients were included in the study, and it was essential that the lateral cephalograms and CBCT images taken at their examinations were not more than 1 week apart. There were 32 subjects in group A (age ≤15 years) and 23 subjects in group B (age >15 years). The ANR was measured on the lateral cephalograms. The area and volumetric measurements of the nasopharynx and the total upper airway were obtained from CBCT images. Repeated measurements of the ANR and airway volume were performed on 10 subjects by 2 observers.
Results
Group A had a higher correlation (r = −0.78) between the ANR and the nasopharynx volume than did group B (r = −0.57). The ANR had a weak correlation with the total upper airway volume (group A, r = −0.48; group B, r = −0.32). Both measurements made on lateral cephalograms and CBCT were highly reproducible in terms of intraobserver and interobserver agreement.
Conclusions
Based on our results, the measurement of the ANR on lateral cephalograms can be used as an initial screening method to estimate the nasopharynx volumes of younger patients (age ≤15 years).
Highlights
- •
The size of the adenoids has an important role in the evaluation of airway volume.
- •
Adenoidal nasopharygeal ratio (ANR) can estimate nasopharyngeal volume (patients ≤ 15 years).
- •
Other factors affect airway volume in addition to ANR values for older patients (>15 years).
- •
CBCT examination should be recommended for evaluating the airway volume.
Obstruction of the airway often alters normal breathing, which has a significant impact on the development of craniofacial structures, such as incompetent lips, lower or anterior tongue position, narrow maxillary arch, long face height, crossbites, and posteroinferior rotation of the mandible. The most common reason for obstruction of the airway is adenoid hypertrophy. Adenoids are a collection of lymphoid tissues in the posterior nasopharyngeal wall; they are small at birth but progressively enlarge as a result of increased immunologic activity. Repeated adenoidal infection and inflammation or genetic factors may lead to pharyngeal obstruction, causing mouth breathing, which can in turn result in altered craniofacial development.
Before planning orthodontic treatment, orthodontists should view and analyze the airway region on a lateral cephalogram. If an obstruction is observed, the patient might be referred to an otolaryngologist for further treatment. A diagnostic method that can accurately provide data on the severity of nasopharyngeal obstruction is important for both dentists and medical specialists. Several methods may be used for evaluating the size of adenoidal tissues, including conventional lateral cephalogram, nasal endoscopy, acoustic rhinometry, rhinomanometry, computed tomography, and magnetic resonance imaging. Among these methods, the conventional lateral cephalogram was reported to be the most cost effective, reproducible, and easy to interpret in assessing the size of adenoidal tissues. A lateral cephalogram is useful for analyzing adenoidal tissues and the nasopharyngeal airway; however, it is a 2-dimensional imaging modality that has limitations to represent 3-dimensional (3D) structures. Several studies have reported that computed tomography and magnetic resonance imaging may provide more clinically useful data to supplement the information from the 2-dimensional images. Recently, with the introduction of cone-beam computed tomography (CBCT), 3D images of patients became more available in dentistry, with reduced radiation doses compared with multidetector computed tomography and lower costs than magnetic resonance imaging. A study by Ludlow and Walker reported that the effective dose of radiation of CBCT for a cephalometric scan with low-dose settings may be reduced to the level of a panoramic examination at the expense of lower image quality expressed in the signal:noise ratio. However, the image quality of low-dose protocols in relation to diagnostic tasks needs to be further studied before CBCT can be recommended as a routine radiographic method for orthodontic patients.
Interest in using CBCT to measure airway volume on craniofacial growth and airway changes after orthognathic surgery and rapid maxillary expansion is growing. However, during the orthodontic treatment period, more lateral cephalograms are readily available than CBCT images. Previous studies have tried to find correlations between measurements performed on lateral cephalograms and CBCT images. Sears et al measured the nasopharynx (NP), oropharynx, and hypopharynx airways, using both cephalograms and CBCT, but the correlations between linear measurements and volumes were weak. In another study, a moderately high correlation was found between the NP area on lateral cephalograms and the NP volume on CBCT images. There is no consensus concerning whether the measurements on lateral cephalograms can estimate the airway volume calculated on CBCT images.
It has been generally accepted that despite many limitations, lateral cephalograms serve as radiographic standards for airway assessment. When lateral cephalograms are used, the adenoidal nasopharyngeal ratio (ANR) is a helpful diagnostic parameter for assessing nasopharyngeal obstruction. The ANR is a classic method for assessing adenoid size in clinical diagnosis and treatment. In 1979, Fujilka et al obtained the ANR by simple linear measurements on the lateral radiographs of 1398 infants and children. They concluded that the ANR reliably expressed adenoidal size and patency of the nasopharyngeal airway. After that study, several reports confirmed the positive correlations between the ANR and surgical findings, nasal endoscopic examinations, and clinical symptomatology.
The size of the adenoids has an important role in the evaluation of airway volume. The adenoids develop progressively, with their growth peak reached by 4 to 5 years of age, followed by another peak between 9 and 10 years; then the size diminishes progressively until 14 to 15 years. Our hypothesis was that instead of linear measurement of the adenoids, the ANR on lateral cephalograms might be an applicable method to assess airway volume for younger patients.
The aim of this study was to evaluate whether the ANR on lateral cephalograms can be used to estimate the airway volume, using CBCT as the validation method. Since lateral cephalograms are routinely used in orthodontic diagnosis and treatment planning, these results will provide essential information on the value of lateral cephalograms for the assessment of airway volume.
Material and methods
This study was approved by the ethics committee of the Stomatological Hospital in Dalian, China (protocol number DLKQLL201302).
This was a retrospective study; we used the image database available at the Department of Orthodontics, Stomatological Hospital, Dalian, China. The database was searched systematically between 2010 and 2012 at the Department of Oral Radiology for patients who had both lateral cephalograms and CBCT images taken not more than 1 week apart. The field of view of the CBCT images should cover the whole upper airway with the superior border above sella turcica and the inferior border below the tip of the epiglottis. The included CBCT examinations were performed for various indications, such as temporomandibular joint disorders, orthognathic surgery, and problematic impacted teeth. Fifty-five patients (35 female, 20 male) between 9 and 43 years of age fulfilled the inclusion criteria.
All radiographs were acquired according to standard clinical exposure protocols. For lateral cephalographs, a digital pan/ceph system (ORTHOPHOS XG 5; Sirona Dental Systems, Bensheim, Germany) was used at 73 kVp and 15 mA, with exposure times of 9.7 and 9.4 seconds for adults and children, respectively. The magnification factor was 1.1 with a 16-bit pixel depth for all images. The patients stood with the Frankfort horizontal line parallel to the floor with their teeth in maximum intercuspation.
For the CBCT examinations, a machine (3D eXam; KaVo, Biberach an der Riss, Germany) was used at 120 kV and 5 mA, with a scanning time of 14.7 seconds for the adults and children according to the manufacturer’s guidelines. The voxel size was 0.2 mm, with 14-bit pixel depth for all the images, and the field of view varied depending on the purpose of the examination. The patients were asked to sit up straight with the Frankfort horizontal line parallel to the floor with their teeth in maximum intercuspation.
All images were stored in DICOM format.
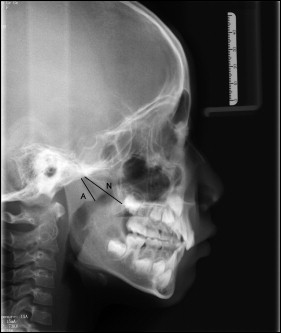
Radiographs from the 55 patients were randomly arranged in 2 sequences: lateral cephalograms and CBCT images. The ANR was measured on the lateral cephalograms using the software SIDEXIS XG (Sirona Dental Systems) according to the method described by Fujioka et al ( Fig 1 ). Figure 1 , A denotes the perpendicular distance between the points of maximal convexity of the adenoid shadow and the anterior margin of the basiocciput. N is the distance between the posterosuperior edge of the hard palate and the anteroinferior edge of the spheno-occipital synchondrosis.
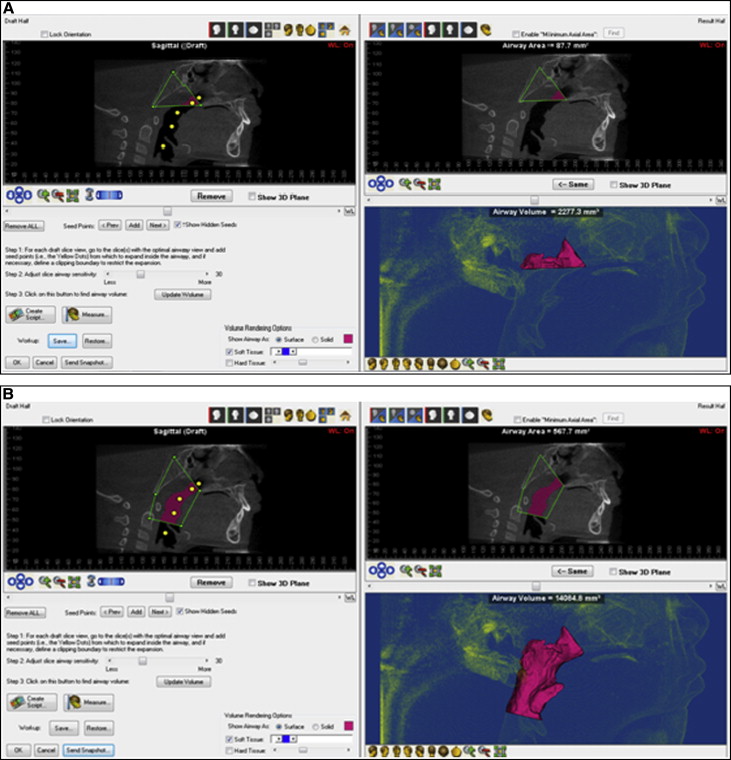
All measurements were made by 1 examiner (X.F.) under identical viewing conditions in a room with dimmed light. The CBCT images were imported as DICOM data to imaging software (version 11.0; Dolphin Imaging & Management Solutions, Chatsworth, Calif). Once the image was properly oriented, the software created a 2-dimensional simulated lateral cephalometric image at the midsagittal plane. From this view, the airway of interest could be defined using the airway analysis tool. In our study, the NP was defined with the superior border at a line connecting the midpoint of sella turcica and the posterior nasal spine, and with the inferior border at a line connecting the point most posteroinferior on the clivus with the posterior nasal spine. For the total airway volume, the superior border was the same as the NP, and the lower border of the airway was defined at a horizontal level with the tip of the epiglottis against the wall of the posterior airway. Data of airway volume and area in the midsagittal view could be calculated and presented automatically once the boundary of the airway was defined ( Fig 2 ). When the airway had been demarcated by the software, the volume of the airway could be further adjusted manually at different threshold levels to ensure a more accurate representation of the airway in the head and neck regions. In our study, threshold values of 25, 30, 40, and 50 were applied for all CBCT images, and the measurements of airway areas and volumes of the midsagittal section with different thresholds were subsequently compared.
To evaluate the reliability of the ANR measurements on the cephalograms and the NP volumes on the CBCT images, the above-mentioned measurements were repeated by 2 observers (X.F., Z.Q.) on 10 randomly chosen subjects.
Statistical analysis
SPSS software (version 17.0; SPSS, Chicago, Ill) was used for data analysis. The patients were classified into 2 groups according to age: group A (≤15 years) and group B (>15 years). The mean ages and standard deviations of the 2 groups were calculated. Analysis of the CBCT radiographs was performed using the following 4 parameters: NP area, NP volume, total upper airway area, and total upper airway volume. These measurements were made at the threshold levels of 25, 30, 40, and 50 provided by the software, to discriminate the airway boundaries and remove any visible extraneous scatter, artifact, or background. The influence of the threshold levels on image analysis was analyzed using analysis of variance (ANOVA). The method repeatability of the measurements was tested in terms of intraobserver and interobserver correlation coefficients.
Correlations between the ANR values obtained from cephalograms and the measured data from the CBCT images, including the area and volume of the NP, as well as the area and volume of the total upper airway, were analyzed using scatter plots to calculate the correlation coefficients for the 2 groups.
Results
Among the 55 patients, 32 were included in group A and 23 in group B. The mean ages and standard deviations of these groups were 11.8 (1.6) and 21.1 (5.7) years, respectively. For the image analyses performed on the CBCT radiographs, no statistically significant difference was found between the measurements with different thresholds with ANOVA ( P >0.05) ( Table I ). However, the measurements had a tendency to decline as the threshold values decreased. Subsequently, a subjective viewing of all reconstructed airway volumes was conducted, and a threshold level of 30 was selected for further analyses. The means of NP area, NP volume, total upper airway area, and total upper airway volume at threshold 30 for the 2 groups are shown in Table II . The mean values of the ANR obtained from the cephalograms were 0.49 and 0.3 for groups A and B, respectively. For the repeated measurements of the ANR and NP volume, high correlation coefficient values were obtained within and between the 2 observers, indicating that both measurements were reliable ( Table III ). The correlation coefficient calculated by scatter plots between the ANR values from cephalograms and the measurements from CBCT are presented in Table IV . The correlation coefficients between the ANR and the NP volumes were −0.78 and −0.57 for groups A and B, respectively. Figure 3 shows the scatter plots of correlations between measurements on the cephalograms and CBCT images for the 2 age groups. Both groups exhibited a low correlation between the ANR and total upper airway area and total upper airway volume.


