Introduction
Genetic studies of malocclusion etiology have identified 4 deleterious mutations in genes DUSP6, ARHGAP21 , FGF23 , and ADAMTS1 in familial Class III cases. Although these variants may have large impacts on Class III phenotypic expression, their low frequency (<1%) makes them unlikely to explain most malocclusions. Thus, much of the genetic variation underlying the dentofacial phenotypic variation associated with malocclusion remains unknown. In this study, we evaluated associations between common genetic variations in craniofacial candidate genes and 3-dimensional dentoalveolar phenotypes in patients with malocclusion.
Methods
Pretreatment dental casts or cone-beam computed tomographic images from 300 healthy subjects were digitized with 48 landmarks. The 3-dimensional coordinate data were submitted to a geometric morphometric approach along with principal component analysis to generate continuous phenotypes including symmetric and asymmetric components of dentoalveolar shape variation, fluctuating asymmetry, and size. The subjects were genotyped for 222 single-nucleotide polymorphisms in 82 genes/loci, and phenotpye-genotype associations were tested via multivariate linear regression.
Results
Principal component analysis of symmetric variation identified 4 components that explained 68% of the total variance and depicted anteroposterior, vertical, and transverse dentoalveolar discrepancies. Suggestive associations ( P < 0.05) were identified with PITX2 , SNAI3 , 11q22.2-q22.3, 4p16.1, ISL1 , and FGF8 . Principal component analysis for asymmetric variations identified 4 components that explained 51% of the total variations and captured left-to-right discrepancies resulting in midline deviations, unilateral crossbites, and ectopic eruptions. Suggestive associations were found with TBX1 AJUBA , SNAI3 SATB2 , TP63 , and 1p22.1. Fluctuating asymmetry was associated with BMP3 and LATS1 . Associations for SATB2 and BMP3 with asymmetric variations remained significant after the Bonferroni correction ( P <0.00022). Suggestive associations were found for centroid size, a proxy for dentoalveolar size variation with 4p16.1 and SNAI1 .
Conclusions
Specific genetic pathways associated with 3-dimensional dentoalveolar phenotypic variation in malocclusions were identified.
Highlights
- •
Craniofacial genes and 3D dentoalveolar malocclusion variation were correlated.
- •
Symmetric discrepancies correlated with PITX2 , SNAI3 , 11q22.2-q22.3, 4p16.1, ISL1 , and FGF8.
- •
Asymmetric arch discrepancies were associated with SATB2 and BMP3.
- •
Genetic pathways underlying dentoalveolar phenotypic discrepancies were identified.
Malocclusion is a common disarrangement of teeth or jaws that affects populations worldwide, resulting in impaired oral function, increased susceptibility to dental trauma, periodontal disease, and reduced dentofacial esthetics. Genetic studies of malocclusion etiology have focused on Class III malocclusion; so far, full exome sequencing of large families segregating maxillary hypoplasia or mandibular prognathism has identified 4 etiologic mutations. The first mutation identified was a heterozygous missense change rs139318648 (c.545C>T, p.Ser182Phe) in the duel specific phosphatase 6 ( DUSP6 ) gene on chromosome 12q22-q23 carried by 5 siblings of an Estonian family with maxillary hypoplasia. The second mutation, rs111419738 (c.3361G>A, p.Gly1121Ser), in the rho GTPase-activating protein 21 ( ARHGAP21 ) gene on 10p12.1 was found in a large Italian family segregating mandibular prognathism. The third mutation, c.35C>A (no rs assigned yet, p.Ala12Asp), in the fibroblast growth factor 23 ( FGF23 ) gene (12p12.3) gene was discovered in a Chinese family and also found in 3 of 65 isolated cases of mandibular prognathism. The fourth mutation, rs200052788 (c7421>T c.2225T>C, p.Ile742Thr), was found in a disintegrin-like and metalloproteinase with thrombospondin type 1 motif, 1 ( ADAMTS1 ) gene (21q21.3) also in a large Chinese family. The latter (c7421>T rs200052788) was also detected in 3 of 230 unrelated persons with mandibular prognathism. Moreover, significant associations were found with single-nucleotide polymorphisms (SNPs) rs2768 and rs229038 in ADAMTS1 , indicating that both rare and common variants of this gene are associated with mandibular prognathism.
As indicated above, progress toward the identification of deleterious mutations for Class III malocclusion is evident; yet future research is needed to continue to unravel the genetic etiology of malocclusion conditions. For instance, the mutations described above are likely to have a large impact in the maxillary hypoplasia and mandibular prognathism phenotypes of persons carrying these mutations. Thus, functional studies to understand their specific roles in jaw growth are essential. However, their low frequency in global populations (<1%) implies that these mutations are not likely to explain most malocclusions. Also to our knowledge, these mutations have not been replicated in other populations; thus, it is uncertain whether the results can be generalized to other ancestries. Moreover, the above studies have only used discrete phenotypes (ie, maxillary hypoplasia or mandibular prognathism), which lack resolution to identify phenotype-genotype correlations underlying the multitude of dentofacial phenotypic variations that in persons with these conditions. In an effort to address some of these knowledge gaps, a recent genetic association study of 71 craniofacial genes/loci in white subjects with severe malocclusion used both categorical (skeletal Class II or Class III vs Class I) and quantitative skeletal malocclusion phenotypes derived from cephalometric tracings and geometric morphometrics methods, respectively. This study showed that the risk for skeletal Class II relative to Class I was modulated by rare alleles in variants near FGFR2 and EDN1 , whereas Class III risk was modulated by variants in FGFR2 , COL1A1 , and TBX5 . In addition, SNPs near SNAI3 were highly associated with skeletal variations ranging from severely concave to convex skeletal profiles and SNPs near TWIST1 were associated with variations ranging from a large to a short mandibular body. Collectively, these findings suggest that malocclusion is a complex trait in both its phenotypic expression and its genetic etiology; therefore, continuing efforts to characterize phenotype-genotype correlations underlying the large variations of malocclusion phenotypes are warranted.
Orthodontic pretreatment records are rich sources of phenotypic information for genetic studies of malocclusion. For example, dental casts trimmed based on the patient’s bite registrations reproduce the patient’s pretreatment occlusion and are routinely taken for orthodontic diagnosis and treatment planning. Dental casts have been used in cross-sectional and longitudinal studies to document 3-dimensional (3D) variations via linear measurements of arch width, perimeter and length, and arch-shape variations as well as other malocclusion indicators such as overjet, overbite, curve of Spee, tooth size-arch length discrepancies, and various indexes to measure crowding and other dental irregularities.
With the recent technological advancements, it is possible to digitize dental casts and expedite dentoalveolar measurements beyond hand-held techniques. In addition, cone-beam computed tomography (CBCT) images have increasingly become more common in orthodontic and orthognathic practices facilitating the generation of 3D skeletal and dentoalveolar images that can provide abundant 3D phenotypic information.
Both digitized dental casts and CBCT images are amenable to analysis with landmark-based shape methods such as geometric-morphometric approaches. These techniques allow the study of an object’s shape independent of size and orientation, facilitating the evaluation of causal factors behind a given shape. Steps for geometric-morphometric analyses include a generalized least squares Procrustes superimposition applied to coordinate data to remove variations in landmarks due to size, position, and rotation. Once completed, any residual information in the positional relationships between landmarks is due purely to differences in shape. These standardized residuals can then be submitted to principal components analyses to reduce the multidimensional data into a few independent axes or principal components, simplifying subsequent analyses and yet retaining most of the shape variations in the data. The derived components of shape variation resemble quantitative phenotypes that can then be correlated with genetic data. The purpose of this study was to explore genetic associations between known craniofacial candidate genes/loci and 3D dentoalveolar shape phenotypes derived from digital casts or CBCT images of patients with moderate or severe malocclusion.
Material and methods
The study protocol was reviewed and approved by the ethics committee of the University of Iowa, and signed consents were obtained from all participants. A sample of 300 untreated healthy subjects (average age, 29.9 years; age range, 12-68 years) seeking orthodontic treatment at the Department of Orthodontics of the University of Iowa was recruited and classified into skeletal Class I (n = 63), Class II (n = 154), or Class III (n = 83) according to criteria specified previously and shown in Supplemental Figure 1 . Of these, about 80% were white (n = 239), and the remaining subjects had other ancestries ( Table I ). Exclusion criteria were craniofacial syndromes or chronic conditions that would limit physical activities according to the American Society of Anesthesiologists physical status classification system for dental care ( http://www.dhed.net/ASA_Physical_Status_Classification_SYSTEM.html ), previous orthodontic treatment, a history of facial trauma or facial surgery, missing or impacted teeth other than third molars, and CBCT images or dental casts of poor quality or with missing landmarks.
| Total sample, n = 300 | White subsample, n = 239 | |||||
|---|---|---|---|---|---|---|
| Sex | Data source | Skeletal Class | Ethnicity | Sex | Data source | Skeletal Class |
| Male, 93 | CBCT images, 131 | I, 63 | White, 239 | Male, 71 | CBCT images, 100 | I, 51 |
| Female, 207 | Casts, 169 | II, 154 | African American, 15 | Female, 168 | Casts, 139 | II, 123 |
| III, 83 | Asian, 18 | III, 65 | ||||
| Hispanic, 15 | ||||||
| Other, 13 | ||||||
| Age range, 12-68 y | Age range, 12-68 y | |||||
| Average age, 29.9 y | Average age, 30.7 y | |||||
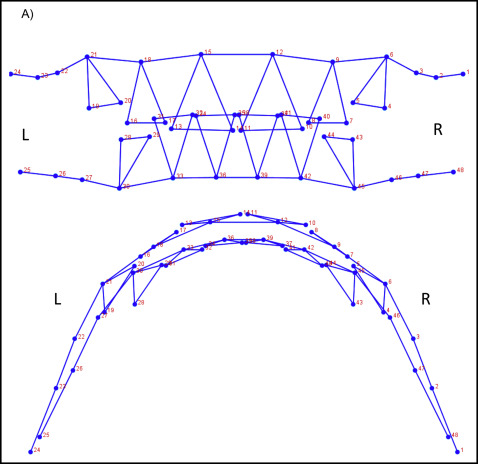
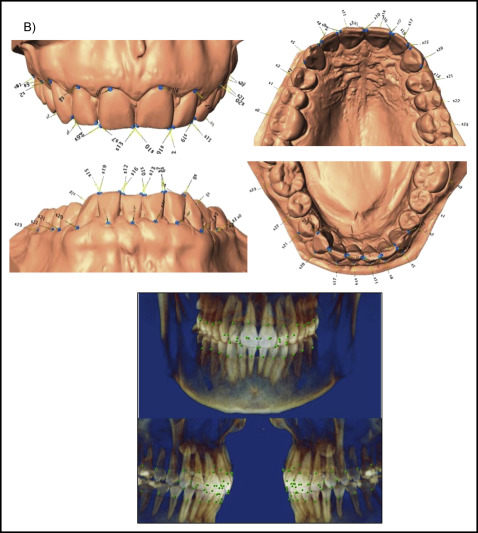
The total data set was procured from 2 subsets. CBCT images (n = 131) or digitized dental casts (n = 169) in occlusion were taken as pretreatment orthodontic records from the study sample. To select a group of landmarks that could capture similar aspects of shape on both data subsets and allow the analyses of the combined data, a test was used with subjects who had both pretreatment digitized dental casts and CBCT images. A sample of 7 subjects was selected, and a set of 136 dentoalveolar landmarks was digitized in both data subsets for each subject via the 3D module of Dolphin software (version 11.5; Dolphin Imaging, Chatsworth, Calif) and the Landmark Editor program (version 3.0; Institute for Data Analysis and Visualization, University of California, Davis, Calif) for CBCT images and digital casts, respectively ( Supplemental Fig 2 ). To test for compatibility between landmarks in CBCT images and digital casts, Euclidean distance differences were calculated between each landmark placed on both images. An error of 1.5 mm or less was considered acceptable; according to this criterion, 24 landmarks on each arch (48 of 136 total) were deemed compatible between CBCT images and digital casts, and therefore useful for shape analysis of both data subsets combined ( Fig 1 ; Table II ).
| Wire frame number | Landmark name | Description |
|---|---|---|
| Maxilla | ||
| 1 | s0 | Most cervical point of tooth on edge of gingiva-right first molar |
| 2 | s1 | Most cervical point of tooth on edge of gingiva-right second premolar |
| 3 | s2 | Most cervical point of tooth on edge of gingiva-right first premolar |
| 4 | s3 | Lateral edge of right canine |
| 5 | s4 | Medial edge of right canine |
| 6 | s5 | Most cervical point of tooth on edge of gingiva-right canine |
| 7 | s6 | Lateral incisal edge of right lateral incisor |
| 8 | s7 | Medial incisal edge of right lateral incisor |
| 9 | s8 | Most cervical point of tooth on edge of gingiva-right lateral incisor |
| 10 | s9 | Lateral incisal edge of right central incisor |
| 11 | s10 | Medial incisal edge of right central incisor |
| 12 | s11 | Most cervical point of tooth on edge of gingiva-right central incisor |
| 13 | s12 | Lateral incisal edge of left central incisor |
| 14 | s13 | Medial incisal edge of left central incisor |
| 15 | s14 | Most cervical point of tooth on edge of gingiva-left central incisor |
| 16 | s15 | Lateral incisal edge of left lateral incisor |
| 17 | s16 | Medial incisal edge of left lateral incisor |
| 18 | s17 | Most cervical point of tooth on edge of gingiva- left lateral incisor |
| 19 | s18 | Lateral edge of left canine |
| 20 | s19 | Medial edge of left canine |
| 21 | s20 | Most cervical point of tooth on edge of gingiva-left canine |
| 22 | s21 | Most cervical point of tooth on edge of gingiva-left first premolar |
| 23 | s22 | Most cervical point of tooth on edge of gingiva-left second premolar |
| 24 | s23 | Most cervical point of tooth on edge of gingiva-left first molar |
| Mandible | ||
| 25 | s0 | Most cervical point of tooth on edge of gingiva-left first molar |
| 26 | s1 | Most cervical point of tooth on edge of gingiva-left second premolar |
| 27 | s2 | Most cervical point of tooth on edge of gingiva-left first premolar |
| 28 | s3 | Lateral edge of left canine |
| 29 | s4 | Medial edge of left canine |
| 30 | s5 | Most cervical point of tooth on edge of gingiva-left canine |
| 31 | s6 | Lateral incisal edge of left lateral incisor |
| 32 | s7 | Medial incisal edge of left lateral incisor |
| 33 | s8 | Most cervical point of tooth on edge of gingiva-left lateral incisor |
| 34 | s9 | Lateral incisal edge of left central incisor |
| 35 | s10 | Medial incisal edge of left central incisor |
| 36 | s11 | Most cervical point of tooth on edge of gingiva-left central incisor |
| 37 | s12 | Lateral incisal edge of right central incisor |
| 38 | s13 | Medial incisal edge of right central incisor |
| 39 | s14 | Most cervical point of tooth on edge of gingiva-right central incisor |
| 40 | s15 | Lateral incisal edge of right lateral incisor |
| 41 | s16 | Medial incisal edge of right lateral incisor |
| 42 | s17 | Most cervical point of tooth on edge of gingiva-right lateral incisor |
| 43 | s18 | Lateral edge of right canine |
| 44 | s19 | Medial edge of right canine |
| 45 | s20 | Most cervical point of tooth on edge of gingiva-right canine |
| 46 | s21 | Most cervical point of tooth on edge of gingiva-right first premolar |
| 47 | s22 | Most cervical point of tooth on edge of gingiva-right second premolar |
| 48 | s23 | Most cervical point of tooth on edge of gingiva-right first molar |
For the 48 compatible landmarks, an additional step of intraobserver reliability was conducted using 15 subjects with CBCT images and 15 with digital casts. These 30 subjects were landmarked using the 48 landmarks in 2 separate attempts 2 weeks apart. Intraclass correlation methods, Euclidean distances, and t tests were used to evaluate discrepancies in landmark location between the 2 attempts. Intraclass correlation results indicated good to excellent reliability, Euclidean distances were less than 0.5 mm, and no error trends were detected for most landmarks except for landmarks 11, 12, 14, and 15 in the maxillary CBCT images and landmarks 5, 11, 19, and 20 for the mandibular CBCT images. For these problematic landmarks, intraclass correlation values of less than 0.8 and Euclidean distances greater than 0.6 mm were obtained; therefore, the average data of the 2 digitizing sessions were used to resolve inaccuracies.
After the landmark selection and reliability above, the CBCT images or digital casts of the 300 subjects were landmarked with 48 landmarks. Detailed steps for CBCT digitizing were described in Supplemental Table I . To prevent interference in landmark placement caused by the overlap between teeth, the maxillary and mandibular digital casts were landmarked separately at first. Subsequently, both digital casts were brought into occlusion via 14 matching points (7 on the maxilla, 7 on the mandible) via DVLR.msi (NYCEP Morphometrics Group; http://pages.nycep.org/nmg/programs.html ) ( Supplemental Fig 3 ). Occlusions were verified with the dental casts trimmed using each patient’s bite registration and confirmed against the patient’s photographic pretreatment records. The CBCT images, taken in maximum intercuspation, did not pose this problem, since the observer can scroll through multiple slices to locate each landmark even with dental superimposition.
The 3D coordinate data derived from the 48 landmarks digitized in the total sample (n = 300) and the white subsample (n = 239) were analyzed in 2 shape analyses, with Morpho J. The 3D data have object symmetry, which means that both the left and the right sides of the dental arches are connected by the midline plane, and the data are made of paired and unpaired landmarks. A 3D shape analysis of data with object symmetry includes independent analyses of both symmetric and asymmetric aspects of shape variation. The symmetric component of shape portrays all variations of paired landmarks in all directions of space, whereas the unpaired landmarks can only vary along the midline plane. Thus, in the symmetric component, anteroposterior, transverse, and vertical dentoalveolar shape variations are illustrated. The asymmetric component only depicts shape differences between the left and right side of the arches. According to the Procrustes fit of the coordinate data, covariance matrices are generated for both the symmetric and asymmetric components of shape variation and then submitted independently to principal component analyses. The symmetric and asymmetric principal components explaining at least 5% of the dentoalveolar shape variation were used as quantitative phenotypes for phenotype-genotype correlations with the genetic data.
In addition, we estimated fluctuating asymmetry Mahalanobis scores, which represent the overall magnitude to which a person’s dental arch shows differences between the left and right sides based on a zero mean value, without considering laterality or directionality. We also measured dental arch size via centroid size, calculated as the square root of the sum of the squared distances between the centroid and all other points in the landmark configurations. The resulting phenotypic data consisted of the principal components of symmetric and asymmetric shape variations, fluctuating asymmetry, and centroid size.
Genomic DNA was extracted from saliva samples collected with Oragene kits (DNA Genotek, Ontario, Calif). As described in our previous study, selection criteria for genes/loci were based on at least 1 of the following: (1) evidence of genetic association or linkage to malocclusion phenotypes in previous studies, (2) known expression patterns or biologic functions in the craniofacial complex, (3) known role in the etiology of craniofacial conditions with phenotypic spectra that include skeletal malocclusion, and (4) previous Genome Wide Association Analysis indicating association with craniofacial variation. For SNP selection, haplotype blocks were reconstructed for all genes/loci, including 10-kb regions flanking intended intervals via Haploview, using genotypic data from a white population (HapMap CEU; HapMap release 27 based on February 2009 assembly, phase 2 and 3 versions). A total of 224 tagging SNPs across 82 candidate genes and loci were selected. Of these, 24 SNPs were genotyped using 5-μL reaction volumes and TaqMan chemistry (Applied Biosystems, Foster City, Calif) and detected on a 7900HT sequence detection instrument (Applied Biosystems). A 96.96 or 192.24 dynamic array was used to generate genotypes for the 200 remaining SNPs using competitive allele specific PCR KASPar chemistry (KBioscience, Hoddesdon, United Kingdom) on a nanofluidic platform (Fluidigm, South San Francisco, Calif). For genotype calling, default settings of the Fluidigm SNP genotyping software (version 4.1.2) were used, including a calling algorithm confidence threshold of 65%, a nontemplate control normalization method, and a K-means clustering method. Genotyping quality was assessed by manually inspecting all genotyping plots, excluding subjects who failed on 10 or more SNPs (>5% failure rate) and removing SNPs with greater than a 5% genotyping failure rate or Hardy-Weinberg disequilibrium test at P <10 −4 . All retained SNPs had a minimum minor allele frequency greater than 3%. Of the 224 SNPs attempted, 5 SNPs (rs10801834, rs2235371, rs12106771, rs1374961, rs2852458) in the total sample and 2 SNPs (rs2235371, 2852458) in the white subsample were dropped. Thus, totals of 219 and 222 SNPs remained for analyses, respectively ( Supplemental Tables II and III ).
Principal components explaining 5% or more of the symmetric and asymmetric dentoalveolar variations were selected for genotype-phenotype correlation analyses along with centroid size and fluctuating asymmetry for the total sample and the white subsample. SNPs were coded as 0, 1, or 2 according to the number of minor allele copies on a subject’s genotype. Multivariate linear regressions were performed in both samples, adjusting for age, sex, and data source (CBCT or dental cast). An adjustment for self-reported ancestry was also included for the total sample. Regressions were performed using software (version 2011; StataCorp, College Station, Tex) to test for associations between each SNP (1 at a time) and the phenotypic data. The formal threshold for statistical significance after the Bonferroni correction for multiple testing was P <0.00022 (0.05/222 SNPs).
Results
Phenotypic analyses of the total sample and the white subsample resulted in almost identical dentoalveolar phenotypic variations. Thus, for ease of description and visualization, we only show the components of shape variation for the white subsample ( Figs 2-9 ). Shape components of the total sample are available upon request.
Principal component analysis of the symmetric dentoalveolar shape variations resulted in 4 components that together explained 68% of the total symmetric variations. The scree plot and histograms depicting the sample distribution in each symmetric component of variation are shown in Supplemental Figures 4 and 5 , respectively. The first component explained 39.1% of the variation and depicted discrepancies ranging from severe overjet and increased overbite mostly due to mandibular incisors stepped up for subjects with negative principal component scores to end-on or anterior crossbite relationships and decreased overbites in those with highly positive principal component scores ( Fig 2 ).
Symmetric component 2 explained 15.5% of the variations ranging from a severe open-bite tendency with increased vertical dimension, proclined maxillary and mandibular incisors, and narrow arches for subjects with more negative principal component scores to a deepbite tendency with decreased vertical dimensions, retroclined maxillary and mandibular incisors, and broad arches for those with highly positive principal component scores ( Fig 3 ).
Symmetric component 3 explained 7.5% of the variations and depicted retroclined maxillary central incisors and proclined and mesially tipped lateral incisors, and also retroclined mandibular incisors for subjects with negative principal component scores. Conversely, proclined maxillary central incisors and retroclined lateral incisors with uprighted mandibular incisors were found in subjects with highly positive principal component scores ( Fig 4 ). Interestingly, in symmetric component 3, anterior crossbites between maxillary lateral incisors and mandibular incisors are common in those with highly positive principal component scores.
Symmetric component 4 explained 6.2% of the variations and ranged from features of a Class II Division 2 malocclusion on the negative end to a Class II Division 1 malocclusion on the positive end of the spectrum. Subjects with negative principal component scores had all 4 maxillary incisors stepped down and retroclined with the central incisors slightly more retroclined than the lateral incisors and also wider maxillary arches. In contrast, those with positive principal component scores showed proclined and stepped up maxillary incisors and narrow arches ( Fig 5 ).
Principal component analysis of the asymmetric dentoalveolar shape variations resulted in 4 components that together explained 51% of the total asymmetric variations. The scree plot and histograms depicting the sample distribution of each asymmetric principal component are show in Supplemental Figures 5 and 6 , respectively. Asymmetric principal component 1 explained 32.4% of the variation and depicts left or right rotations of the maxillary and mandibular arches. Subjects with negative principal component scores had the maxillary arch rotated to the left and the mandibular arch rotated to the right. Conversely, those with positive principal component scores had the exact opposite morphology. This leads to dental midline deviations, asymmetries in the anteroposterior occlusion relationships, and a tendency for increased lateral overjet on 1 side and a transverse tight relationship or unilateral crossbite on the other side. As depicted in Figure 6 , subjects with negative principal component scores can show a Class II subdivision right, whereas those on the other end can display a Class II subdivision left.
Asymmetric principal component 2 explained 8.2% of the variations with a unilateral maxillary arch transverse collapse and misalignment in the mandibular arch resulting in both maxillary and mandibular lateral incisors shifted palatally or lingually, respectively, and blockage of the maxillary canine with ectopic eruption gingivally and buccally. Also, a crossbite or end-on relationship involving the maxillary lateral incisor and the mandibular canine on the same side was often seen. Thus, subjects with negative principal component scores had the maxillary right side collapsed, the maxillary right canine blocked buccally and gingivally, and the maxillary right lateral incisor in a crossbite relationship, whereas subjects with highly positive principal component scores had the exact opposite morphology ( Fig 7 ).
Asymmetric principal component 3 explained 5.6% of the variations and portrayed unilateral transverse collapse of the maxillary arch along with right or left mandibular arch rotations leading to unilateral posterior crossbites. Subjects with negative principal component scores had unilateral right posterior crossbites, and those with positive principal component scores had the opposite morphology ( Fig 8 ).
Asymmetric principal component 4 explained 5% of the variations and illustrates severe maxillary and mandibular incisor crowding with blocked right or left central incisors that appeared to erupt buccally and gingivally compared with the rest of the arch. Subjects with negative principal component scores had maxillary and mandibular right central incisors blocked, whereas those with negative principal component scores had the opposite morphology ( Fig 9 ).
Fluctuating asymmetry scores were regressed on the skeletal classification variable Class II or Class III with Class I as the reference category and adjusting for the variables of sex, age, and data source as indicated above. No significant differences were found in the total sample or the white subsample, indicating no difference in overall dentoalveolar asymmetry when comparing Class II or Class III subjects with Class I.
Similar to fluctuating asymmetry, centroid size was regressed on the skeletal classification variable Class II or Class III with Class I as the reference category and also adjusting for the variables of sex, age, and data source as indicated above. No significant differences were found in the arch sizes in the total sample or the white subsample when comparing Class II or Class III subjects with Class I.
Multivariate linear regressions were performed separately for the total sample and the white subsample with 219 and 222 SNPs, respectively. Most results in both samples indicated suggestive associations ( P <0.05) with only a few signals significant at P <0.00022 after the Bonferoni correction as shown below. Comparison of results between both samples showed that most association signals point to the same SNPs and or gene/loci, and most alleles were associated in the same direction (according to β regression coefficient) with few exceptions. Therefore, to facilitate visualization, we will focus on the results of the white subsample, pointing out result differences and similarities between samples when appropriate. Figures 2 through 9 show associations at P <0.05 for the white subsample along with the direction of the associated minor allele. Figure 10 shows all regression results for all phenotypes studied, and Table III summarizes the key findings in the white subsample. Complete phenotype-genotype correlation results are shown in Supplemental Tables IV (total sample) and V (white subsample) .


