Introduction
Orthodontic relapse is a common and significant problem. Few risk factors have been identified, and the role of bone has only recently been investigated. The purpose of this study was to examine the influence of alveolar bone volume and tooth volume on dental relapse.
Methods
The sample was chosen from the postretention database at the Department of Orthodontics of the University of Washington in Seattle. Based on the 10-year postretention (T3) irregularity index (II), 40 relapse subjects (T3 II >6 mm) and the 40 most stable subjects (lowest T3 II <1.5 mm) were identified for the study. Cone-beam computed tomography (CBCT) scans were taken of the posttreatment (T2) models. Total volume (V) was defined laterally by the distal contact points of the canines and vertically by the cusp tips of the canines to a depth 7 mm below the most inferior gingival margin. Alveolar volume (AV) was defined as the region below a vertical line at the most inferior gingival margin and tooth volume (TV) as the region above that line. The ratio TV:AV was calculated. Logistic regression analysis was used to determine the association between relapse and AV, and to adjust for potentially confounding variables (TV, initial II, sex, age, retention time, and postretention time). Mandibular cortical thickness (CT) measured on T2 lateral cephalograms was used as another measure of bone quantity. Nine patients from the graduate orthodontic clinic who had pretreatment CBCT scans were identified. V, AV, and TV were measured on both the in-vivo scans and the scans of their dental casts to verify the method.
Results
The relapse group had significantly greater V and AV and significantly lower CT. TV:AV was not different between the groups. T2 II was found to be a significant predictor of relapse based on logistic regression analysis, whereas AV was not. CT was poorly correlated with AV. V and AV were highly correlated between in-vivo scans and dental cast scans, whereas TV approached significance.
Conclusions
Although postretention relapse was associated with increased V and AV, when other variables were controlled, bone volume was not a significant predictor of relapse.
It has been stated that the greatest risk in orthodontic treatment is partial or total failure in accomplishing a worthwhile and lasting change in the dentition. Long-term stability, therefore, is a key objective in orthodontic treatment. However, it has been shown that 20% of patients are likely to have marked relapse of the mandibular incisors and that satisfactory alignment after retention is maintained in fewer than 30% of orthodontically treated patients. Prior research has sought to identify potential biologic or therapeutic predictors of incisor relapse, including treatment plan (extraction vs nonextraction), Angle class, sex, retention time, overbite, overjet, and arch width, but few significant predictors have been identified. Of the multitude of descriptive characteristics investigated, only increased intercanine width during treatment and initial irregularity are significant predictors.
Since dental crowding is a reflection of a discrepancy between tooth size and available space in the dental arch, the proportions between these 2 measures are invariably linked to crowding. Tooth size measurements are a simple clinical measure that is routinely used in the orthodontic diagnostic process. Naturally, the relationship of mandibular incisor size and orthodontic stability has been investigated. Peck and Peck identified a ratio of mesiodistal and buccolingual widths that correlated with crowding in untreated normal subjects. Investigations involving both untreated normal subjects and postretention relapse found little significant correlation between tooth size ratios and crowding and relapse. Despite the contention of Peck and Peck that tooth morphology ratios are highly correlated to crowding, it appears that a larger than average mesiodistal tooth dimension is not a predictor for relapse.
Until recently, the role of bone in dental relapse had not been investigated, even though the teeth are housed in and orthodontically moved through the alveolar bone. Animal models have demonstrated that teeth move faster and show greater relapse in animals with decreased bone density. A retrospective study of orthodontically treated patients by Rothe et al showed that decreased mandibular cortical thickness, a measure of bone mass, density, and size, on panoramic and lateral cephalograms was shown to be a risk factor for incisor relapse. Fractal dimension of anterior periapical radiographs, a measure of trabecular bone quality, was not. It was further hypothesized that increased cortical thickness might contribute to stability because it is correlated with increased bone volume in the mandibular incisor region. If so, then bone size itself might have a relationship to stability.
The recent introduction of cone-beam computed tomography (CBCT) in orthodontic diagnosis allows for 3-dimensional (3D) imaging and measurements of volume. It is fast becoming a key diagnostic tool for assessing alveolar bone height and volume in areas of dental implants or osteotomy sites. Its accuracy and reliability in linear measurements have been shown to exceed those of lateral cephalograms. Volumetric measurements of simulated bone defects in acrylic blocks and simulated tumors in cadaver heads have been shown to be both repeatable and accurate. This technology opens new opportunities for orthodontic stability studies by allowing volumetric measurements of teeth and their alveolar housing. This could provide new insights into the role of tooth and bone geometry in relapse, since the relationship between tooth mass and available space is invariably linked to dental crowding.
The purpose of this case-control study was to examine the influence of bone and tooth volume on dental relapse. It was hypothesized that an increased ratio of dental vs bone volume results in less stability of orthodontic treatment. Our secondary aims were to investigate the relationship between mandibular cortical thickness and 3D alveolar volume and to determine whether alveolar volume measured on dental casts is correlated to in-vivo alveolar bone volume measured on patients’ CBCT scans.
Material and methods
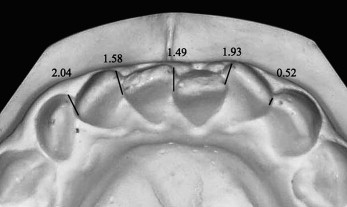
The subjects for the case-control study were obtained from the collection of postretention records at the Department of Orthodontics at the University of Washington in Seattle. This data set includes full orthodontic records of over 900 patients obtained before treatment (T1), at the end of treatment (T2), and 10 years postretention (T3). Subjects and controls were identified by measuring Little’s irregularity index (II) on the mandibular incisors at T3, with subjects defined as having an II value more than 6.0 mm and controls as having an II value less than 3.5 mm ( Fig 1 ). Sixty subjects and 263 controls were initially identified. T2 models were chosen for the investigation because, at this time point, all subjects had just completed orthodontic treatment and should have comparable and acceptable alignment of the mandibular incisors. To be included, the T2 model needed to be taken without a retainer, and there could be no significant gingival recession on the facial aspect of the mandibular incisors. From the overall sample, 40 subjects were identified who met the inclusion criteria, and the 40 most stable controls (lowest II at T3) were selected.
For the in-vivo comparison, all patients from the graduate orthodontic clinic at the University of Washington who had CBCT scans taken and dental casts taken within 3 months of the scan were identified. Those with appliances on during the scan were excluded. Nine subjects were identified.
The institutional committee reviewed and approved the research protocol.
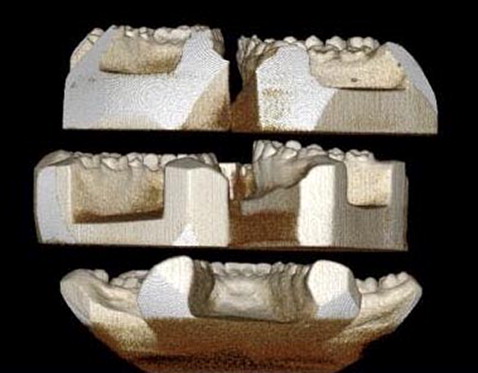
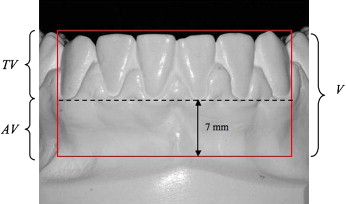
Identifying information was removed from all dental casts. CBCT scans of the mandibular casts were taken with a CB MercuRay (Hitachi Medical Corporation, Tokyo, Japan) at 10 mA, 120 kVp, with field of view of 9 in and a voxel size of 0.292 mm. Ten to 12 casts were fitted into each scan by using 3 plastic platforms ( Fig 2 ). The scans were analyzed with OnDemand3D software (Cybermed, Seoul, Korea). The threshold was set to ensure visibility of the incisor region. One examiner (J.B.C.) performed the following measurements on each cast ( Fig 3 ).
- 1.
Total volume (V): bounded laterally by the distal contact of both canines (when viewed from the occlusal aspect), superiorly by the tallest cusp tip or the incisal edge of the anterior teeth, and inferiorly by a horizontal line 7 mm below the most inferior gingival margin on the facial aspect of the incisors. This inferior boundary was selected because it represented the maximum depth that could be accommodated by all casts because of varying vestibular extensions on the casts.
- 2.
Alveolar volume (AV): the area in the total volume below a horizontal line at the most inferior gingival margin on the facial aspect of the incisors. This landmark was chosen as the demarcation point because it was easily identifiable and represents the most inferior demarcation between tooth structure and alveolar bone.
- 3.
Tooth volume (TV): the area in the total volume above a horizontal line at the most inferior gingival margin on the facial aspect of the incisors.
- 4.
Tooth-alveolar ratio (TV:AV): the ratio of TV to AV.
These measurements were made on all casts. The examiner was blinded to the subject or control designation of the models.
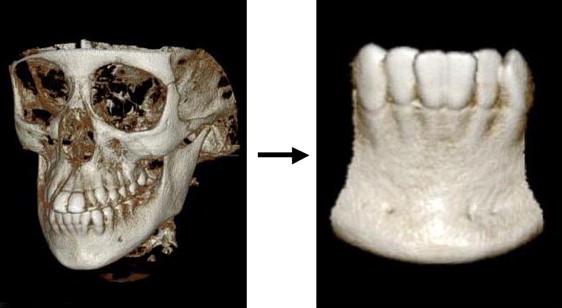
The CBCT scans of the 9 patients not identifiable. All scans were performed on the same CB device (field of view, 6 in, and voxel size, 0.200 mm; or field of view, 9 in, and voxel size, 0.292 mm) and analyzed by using the same software as the dental cast analysis. The scans were performed at 15 mA, 100 kVp (n = 4); 10 mA, 120 kVp (n = 3); or 15 mA, 120 kVp (n = 2). The scan was configured to display only hard tissue by setting the threshold to “bone” as preset in the software. Since the patients were scanned in occlusion, the mandibular incisor region was isolated from the whole image by cropping ( Fig 4 ). From this point, the same V, AV, and TV calculations were performed by substituting the most inferior alveolar bone margin on the facial aspect of the incisors for the gingival margin used in the dental cast analysis.
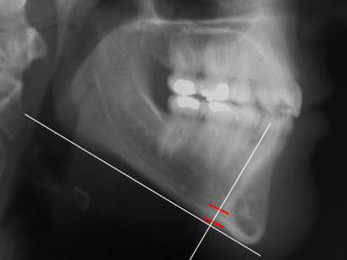
Measurements of mandibular cortical thickness (MCT) were made on both lateral cephalograms and panoramic radiographs of subjects and controls at T1, T2, and T3 by a blinded, calibrated examiner during a previous study (J.B.C.). The modified method of Wical and Swoope was used on the panoramic radiographs by measuring bilateral MCT with digital calipers along a line perpendicular to the long axis of the mandible and bisecting the mental foramen. The values were averaged for each subject. On the lateral cephalograms, MCT was measured as the distance between the inferior and superior borders of the cortex along a line tangential to the greatest curvature of the posterior border of the mandibular symphysis and perpendicular to the mandibular plane ( Fig 5 ).
Statistical analysis
Descriptive statistics were calculated for all measured variables. Independent sample, 2-tailed t tests were used to evaluate differences in the mean values between the subjects and the controls. The logistic regression analysis was performed to explore the data for associations, controlling for the potentially confounding variables of TV, sex, T2 age, postretention time, T1 II, T2 II, MCT, and retention time.
The Pearson product moment correlation coefficients were calculated to determine the correlation of true CBCT volumetric measurements and corresponding measurements on the models of live patients and the relationship between MCT and AV on the casts. Significance was set at P <0.05 for all tests.
To evaluate intraexaminer error, 10 subjects and 10 controls were randomly chosen to be rescanned 10 weeks after the initial measurements. Error was calculated by using Dahlberg’s formula for root mean square error (RMSE), where D is the difference between duplicated measurements, and N is the number of duplicated measurements.
R M S E = ∑ D 2 2 N
Stay updated, free dental videos. Join our Telegram channel
VIDEdental - Online dental courses


