Introduction
In this study we aimed to compare measurements on plaster models using a digital caliper, and on 3-dimensional (3D) digital models, produced using a structured-light scanner, using 3D software.
Methods
Fifty digital models were scanned from the same plaster models. Arch and tooth size measurements were made by 2 operators, twice. Calibration was done on 10 sets of models and checked using the Pearson correlation coefficient. Data were analyzed by error variances, repeatability coefficient, repeated-measures analysis of variance, and Bland-Altman plots.
Results
Error variances ranged between 0.001 and 0.044 mm for the digital caliper method, and between 0.002 and 0.054 mm for the 3D software method. Repeated-measures analysis of variance showed small but statistically significant differences ( P <0.05) between the repeated measurements in the arch and buccolingual planes (0.011 and 0.008 mm, respectively). There were no statistically significant differences between methods and between operators. Bland-Altman plots showed that the mean biases were close to zero, and the 95% limits of agreement were within ±0.50 mm. Repeatability coefficients for all measurements were similar.
Conclusions
Measurements made on models scanned by the 3D structured-light scanner were in good agreement with those made on conventional plaster models and were, therefore, clinically acceptable.
Highlights
- •
Measurements made on plaster and 3D models were compared.
- •
3D models were digitized by structured-light scanner using mirror software.
- •
Differences between the 2 methods were not clinically significant.
- •
Measurements made by both methods were similarly reliable.
In dentistry, plaster models are used to analyze the occlusion and aid in treatment planning. Linear measurements made on plaster models are commonly used for space, tooth size, and arch width analyses. Direct measurement of casts using calipers has been accepted as the clinical standard for linear measurements. The advent of 3-dimensional (3D) image models has spurred a growing interest in their usefulness to address the issues of limited storage space and transport as well as to prevent the long-term wear and tear of the study models that is commonly seen with stone or plaster models.
Several studies have investigated digital models made by systems that require models or impressions to be couriered to the proprietors (eg, OrthoCAD, emodel, and DigiModel ) for their clinical acceptability compared with conventional plaster models. OrthoCAD models are scanned by a patented “destructive scanning” technique, whereas DigiModel and emodel use cone-beam computed tomography (CBCT)-based and laser-based scanners, respectively. InVivoDental uses captured computed tomography and CBCT images sent for model reconstruction, but such highly invasive techniques may not be justified for all patients. Several in-house scanning devices have also been studied to compare linear measurements made on digital and conventional models. These include laser scanners such as the Kodak Minolta VIVID and 3Shape, as well as conoscopic holographic sensors such as Optimet. Measurements on these systems have been extensively compared with digital calipers and have been found to be clinically acceptable.
Structured-light scanners, such as the Comet 100 optical digitizer, are also commercially available, but a previous study focused on measuring simulated dental objects on arches rather than on clinically relevant study models. The structured-light scanner is a type of noncontact active scanner that reconstructs 3D surfaces based on triangulation. The active projector device emits a structured-light pattern that forms an illusion of texture on an object. This increases the number of unique definitions of matchable object points, corresponding to every unitary position in the image, thus enabling 3D object reconstruction by matching of the projected and recorded patterns. To date, no study has validated the digital study models obtained from a structured-light projector scanner for linear orthodontic measurements. As with any new method, clinical acceptance must be assessed by comparing it with the old method or the current gold standard—in this case, measurements made manually on plaster models. The literature contains no evaluation of the clinical acceptance of the structured-light scanner Maestro 3D (Age Solutions, Pisa, Italy). Therefore, the purpose of this study was to evaluate the agreement of linear measurements made on 3D models scanned using a structured-light projector scanner and software with those made on plaster models with digital calipers. The hypotheses were the following.
- 1.
The null hypothesis was that there is no difference between measurements made on 3D models scanned with a structured-light projector scanner and those made on plaster models using digital calipers.
- 2.
The alternative hypothesis was that there is a difference between measurements made on 3D models scanned with a structured-light projector scanner and those made on plaster models using digital calipers.
We assessed both statistically and clinically significant differences between the measurements made on these models. In this study, the clinically acceptable boundary for the differences between the measurements was set at 0.50 mm.
Material and methods
Ethical approval was obtained from the medical ethics committee, Faculty of Dentistry, University of Malaya (DF CD1204/0038[U]), Kuala Lumpur, Malaysia. Plaster orthodontic study models were obtained from the faculty’s research database. The inclusion criteria were a full set of permanent teeth from the right first molar to the left first molar, with a displacement of less than 4 mm, and no anomalies of the crown. Exclusion criteria were broken and poorly cast models.
Two examiners, operator 1 (S.N.A.) and operator 2 (A.A.R.), were trained to measure the landmarks of interest by an orthodontist (W.N.W.H.). Calibration was done with repeated measurements at least a week apart using 10 sets of randomly selected plaster models and their digitized images. Both examiners then measured all models and repeated the procedure separately. Plaster models were measured to the nearest 0.01 mm using the Pro-Max Electronic Digital Caliper (Fowler High Precision, Newton, Mass) ( Fig 1 ). The plaster models were scanned by placing each arch on the integrated rotary table (Maestro 3D, Age Solutions) and digitized using the Easy Dental Scan software (Age Solutions). Scans were made using the “arch with palate” program set at the maximum number of acquisitions, maximum number of faces, and the full rotary table turn. One acquisition of the palate and upper surface of the model was taken at 45°. The acquired data were then processed at “Method V1” and then exported in stereolithographic format. Digital casts were later measured to the nearest 0.0001 mm using the Mirror software (Canfield Scientific, Parsippany, NJ).
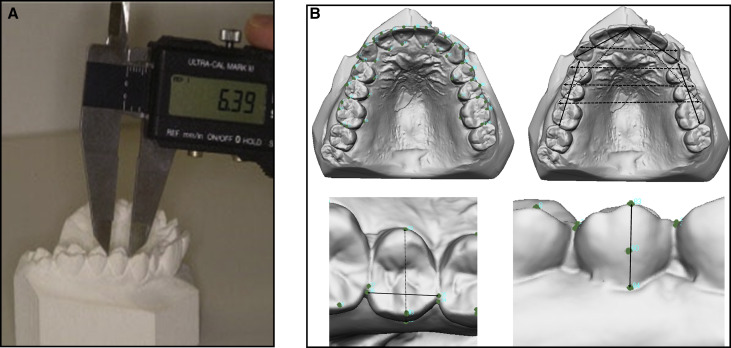
Tooth dimensions were measured in 3D perpendicular planes ( Fig 1 ): the greatest mesiodistal widths, the greatest buccolingual or bucco-palatal widths, and the facial axis of the clinical crowns of each tooth, from the first molar to the first molar of the contralateral sides on both arches. Arch measurements included were intercanine widths, interfirst premolar distances, intersecond premolar distances, intermolar distances, arch lengths (diagonal line between the mesiobuccal cusp tips of the first molars and the mesial contact areas of the central incisors), and the arch perimeter segments (sum of 2 bilateral arch segments). The first segment is the distance between the distal measurement point of the first molar and the mesial contact point of the first premolar, and the second segment is the distance from the distal contact point of the canine to the mesial contact point of the central incisor. For the statistical analysis, the arch length was calculated as separate left and right segments, and the arch perimeter segments were calculated as separate posterior or anterior and left or right perimeter segments.
Statistical analysis
Since no study has been published on the machine used for this study, the estimated standard deviation and mean difference were based on average values of similar studies. Therefore, a minimum of 8 samples per group were required to allow a 90% chance of detecting a 0.4-mm difference, with a standard deviation of 0.30 mm at the 5% level of significance (version 3.0.43; PS, Vanderbilt University, Nashville, Tenn). However, for detection of systematic errors, Houston advocated a large number of replicated samples of at least 25 cases. In this study, we compared the linear measurements made in clinically relevant directions (arch measurements, mesiodistal widths, buccolingual widths, and facial axis of the clinical crowns) between the 2 methods.
Error variance (s e 2 ) was taken to be half of the variance between the 2 measurements to give a correct estimate of the error for 1 measurement. The coefficient of reliability and percentage of error variance were calculated as follows.
Coefficient of reliability = 1 − ( S e 2 S t 2 )
where s e 2 is the variance due to random error, and s t 2 is the variance of the series of measurements at both times.
Percentage error variance = 100 − ( coefficient of reliability × 100 ) .
Repeated-measures analysis of variance (ANOVA) was done to assess the effect of repeated observations as within-subject factors, and the effects of the methods and operators as between-subject factors for the detection of systematic errors (bias). If there were significant differences between the variables, post hoc pairwise comparisons were performed using the Bonferroni test.
The Bland-Altman analysis was done to determine the agreement between the 2 methods of measurement with the assumption that the true value of each linear measurement is constant. Replicate measurements by each method were done so that the repeatability of the 2 methods could be compared. The repeatability coefficient was calculated as follows.
Stay updated, free dental videos. Join our Telegram channel
VIDEdental - Online dental courses


