9
Progression of periodontal diseases
Figure 9.1 Matrix metalloproteinase activity.
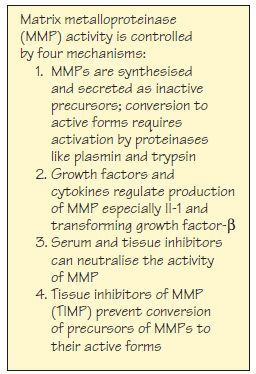
Figure 9.2 (a) Continuous rate model of clinical attachment loss (CAL). (b) Examples of three sites showing different rates of continuous ‘linear’ CAL over the patient’s lifetime.
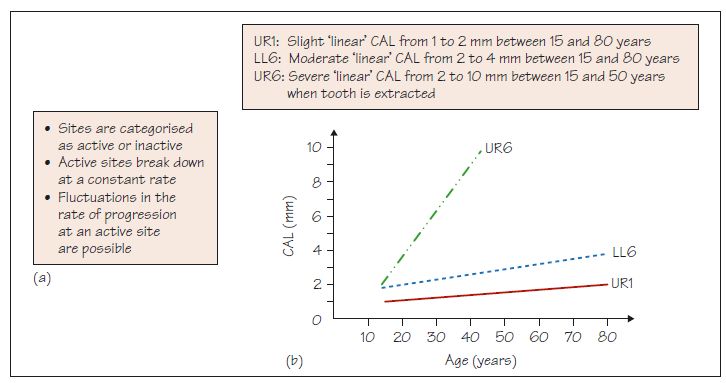
Figure 9.3 (a) Random burst model of clinical attachment loss (CAL). (b) Examples of the same three sites as in Fig. 9.2b showing random bursts of CAL over the patient’s lifetime but with the same clinical outcome.
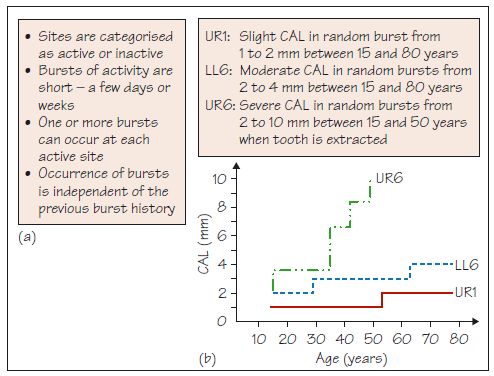
Figure 9.4 (a) Asynchronous multiple burst model of clinical attachment loss (CAL). (b) Examples of the same three sites as in Figs 9.2b and 9.3b showing asynchronous bursts of CAL over the patient’s lifetime but with the same aclinical outcome.
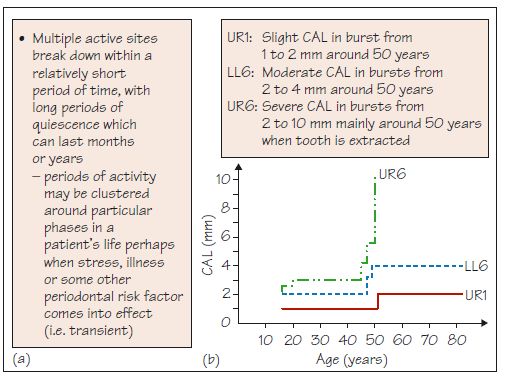
Figure 9.5 Possible patterns of clinical attachment loss at an individual site between three time points: (a) no change; (b) loss then loss again; (c) loss then plateau; (d) loss then gain with a net result of no change; (e) no change, then loss, leading to net loss; (f) gain then gain; (g) gain then plateau, leading to net gain; (h) gain then loss with a net result of no change; and (i) no change then gain, leading to net gain in attachment.
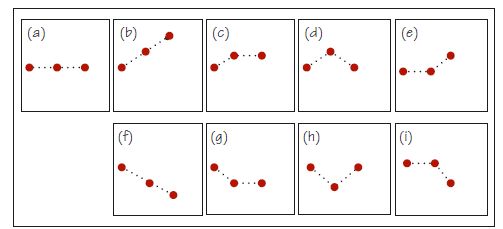
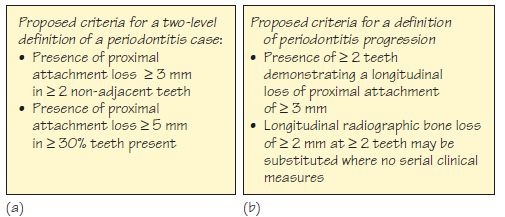
Figure 9.6 Proposed criteria for: (a) periodontitis, and (b) periodontitis progression.
Periodontal diseases can progress in individuals and at various sites within the mouth at different times and rates, and the extent and severity of the resulting disease can be variable and unpredictable. Relevant to progression are: changes in the connective tissues during progression; susceptibility; models of progression.
Changes in the connective tissues during progression
Building on what was covered in Chapters 7 and 8, periodontal disease progression involves complex inflammatory and immune responses, affecting epithelial and connective tissue turnover and activity associated with the infiltrating inflammatory cells. Great numbers of B- and T-cells accumulate in the tissues, although their role has not been fully elucidated. During />
Stay updated, free dental videos. Join our Telegram channel

VIDEdental - Online dental courses


