CHAPTER 8 CONTEMPORARY RADIOGRAPHIC EVALUATION OF THE IMPLANT CANDIDATE
The use of endosseous implants, as well as other types of designs such as subperiosteal and transosseous, for dental rehabilitation of patients represents one of the most technologically advanced forms of dentistry available today.1–4 Radiographs are typically the first window for seeing whether or not patients are candidates for dental implants. In fact, there are situations in which taking the appropriate dental radiograph is all that is needed to place a simple implant. However, in complex cases, in which the patient’s medical history indicates significant medical problems, or a clinical exam shows diminished bone or other anatomical areas of concern, a more extensive radiographic evaluation is warranted.5–9 This has often required sending a patient to a local hospital to have a medical computed tomography (CT) scan taken.
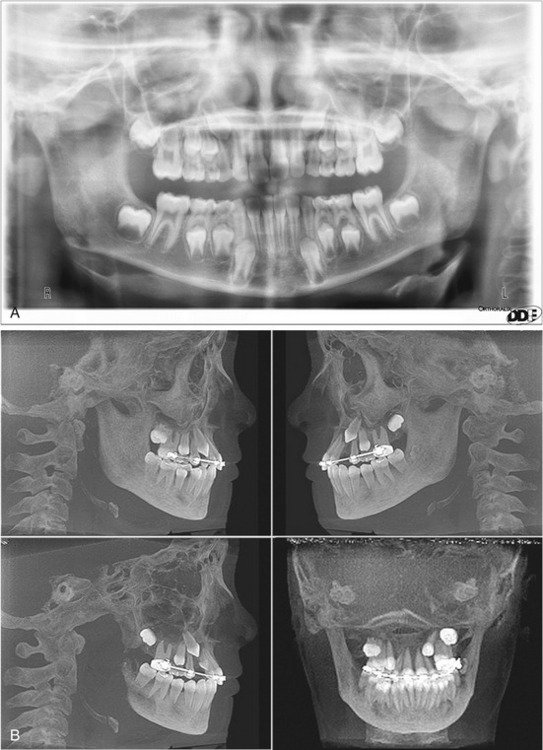
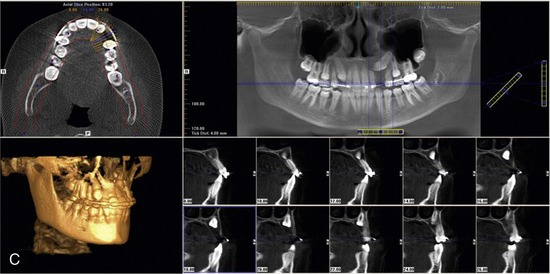
Since the previous edition of this book, cone beam computed tomography (CBCT) has become widely available. Cone beam 3-D dental imaging brings the advantages of hospital-based CT scans into the dental practitioner’s office. Unlike conventional two-dimensional radiographs, CBCT offers 3-D views of the mouth, face, and jaw from any direction (Figure 8-1).
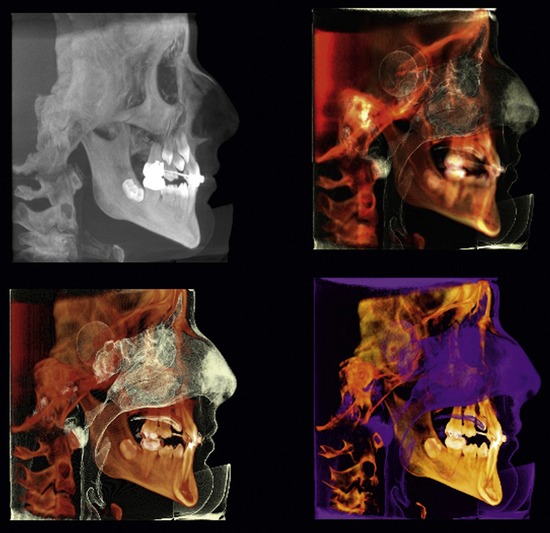
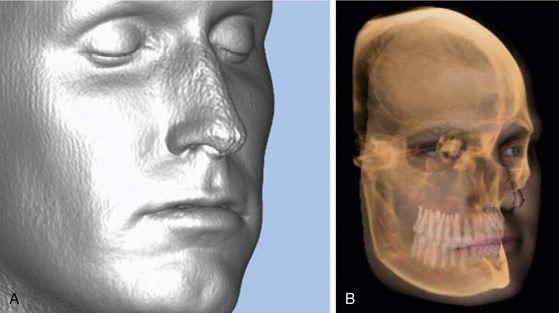
Additionally, software provided by unit manufacturers and third party vendors can enhance grayscale and add pseudo-color to delineate both hard and soft tissue densities (Figure 8-2). With these advances, it is possible to clearly see vital anatomical structures, including soft tissue. Some products will even overlay the patient’s facial image onto the radiographic image (Figure 8-3). CBCT, in combination with the appropriate software, thus eliminates much of the guesswork that was previously necessary when trying to determine placement of an implant from a two-dimensional grayscale image.
 Two-Dimensional Views
Periapical and Panoramic Images: Digital Versus Conventional
In many practices, digital radiographs (Figure 8-4, A) have largely replaced conventional films. As a result, many dentists will find they are already familiar with the combination of rapid imaging and computer display that cone beam units provide. Digital images will not fade and can be stored on a computer along with other patient information. They can be manipulated easily on a computer, where angles can be rotated, grayscale intensities can be adjusted, negative and positive can be reversed, and pseudo-color can be added to enhance contrast to facilitate immediate diagnosis. These are all major advances over trying to make a diagnosis by examining films by hand.
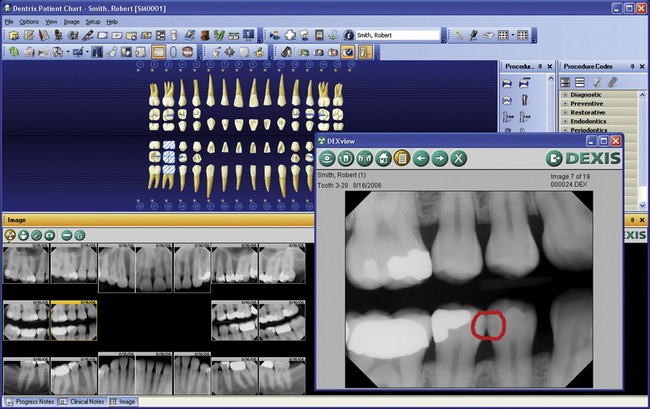
The downside is that digitized two-dimensional radiographs cannot provide any information about the third dimension, so the dentist is still forced to estimate implant depth and width, just as with conventional films. Nevertheless, in cases involving the extraction of a tooth caused by a lack of periodontal support, root fracture, or nonresolving periapical pathological condition, periapical radiographic images (Figure 8-4, B) still provide useful information. They show the location of adjacent roots and any opaque foreign bodies that may be in the area being considered for implant placement.
 Computed Tomography and Digital Images
The limitations of radiographs, both film and digital, are well known:
Tomo is Greek for slice. A radiographic scanner takes slices through the patient’s body and the slices are then composited into an image with more depth than conventional radiographs. Tomography had been tried in the 1940s with film-based systems, but its potential could not be fully realized because of blurring. Hounsfield calculated the necessary math to eliminate blur and engineered the first CT scanner, which partly rotated around the patient’s head.10,11 (A bit of trivia to entertain nervous patients. The Beatles deserve credit for making CT research possible. Hounsfield developed CT while working as an engineer at British music publishing giant, EMI. Although EMI would later sell off their technology division, in the 1970s they invested the profits from the Beatles’ hit records into engineering R&D.)12,13
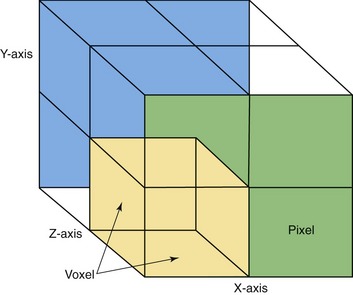
The CT beam “cuts” through the body to image a transverse slice of tissue. In addition to the x (horizontal) and y (vertical) coordinates of a two-dimensional radiograph, the CT slice has a z plane, representing depth. According to CT pioneer Willi Kalender, a German physicist and author of Computed Tomography, the slice itself consists of “discrete cubic volume elements”14 that encompass the numeric values of the tissue density. In more concrete terms, imagine a CT slice as a mosaic made from dyed sugar cubes. The individually colored sugar cubes are “voxels,” Kalender’s cubic volume elements. Each voxel is a complete description of a tiny part of the whole slice. The three-dimensional voxels are seen on monitors as two-dimensional picture elements or “pixels” (Figure 8-5). How much chromatic information each pixel can display is determined by the number of “bits” (binary digits) of which it is composed. (The bits are the underlying 0,1 computer code).
As part of his work, Hounsfield created a scale for calculating tissue density based on CT pixel intensity, which is far more sensitive than film. Air appears black on x-ray film, and bone appears white. CT scanning generates over 200 shades of gray, which distinguish the density of the tissues between those extremes. Called Hounsfield units, the scale is generally given as −1000 (air) to +1000 (bone), with water at 0. Because the scale’s values are based on the equation to calculate attenuation,14,15 it can actually go both above and below those numbers.
According to Kalender, “CT measures and computes the spatial distribution of the linear attenuation coefficient µ(x,y). … For an arbitrary tissue T with attenuation coefficient µt the CT value is defined as: CT value = (µt − µwater)/µwater · 1000 HU.”14 Kalender notes, however, that human beings can generally perceive only 60 to 80 shades of gray, far fewer than the 4096 levels of the full Hounsfield scale. On this scale, dense medullary bone would be approximately 400 (150-850) and cortical bone 1500 (850-2000).
Hounsfield’s prototype took 9 days to make an image. Contemporary CT machines can take scans in a breath-hold. The increase in speed is a result of design changes. By the late 1970s, the sequential scanning procedure (now known as conventional CT) had become established. In this method, the patient lies still on a table that slowly slides between an x-ray beam and an x-ray detector. Rather than pointing straight on at one area, the beam makes a 360-degree revolution around a “slice” of the patient’s body. Although scan times are substantially reduced with this method, it is still a time-consuming procedure due to the fact that the table pauses between slices and then moves incrementally to image the next slice. There is always a risk of patient movement distorting images, as well as the risk that important anomalies might be missed if they are below the threshold of the slice widths. Nevertheless, a composite image can be reconstructed from the slices that gives a view of the soft tissue not possible with conventional radiographs. Conventional CT produces images that look like a blade has sliced clean through the body.16,17
/>
Stay updated, free dental videos. Join our Telegram channel
VIDEdental - Online dental courses


