3
Physical Properties of MTA
Ricardo Caicedo1 and Lawrence Gettleman2
1 Department of Oral Health and Rehabilitation (Endodontics Division), University of Louisville, School of Dentistry, USA
2 Department of Oral Health and Rehabilitation (Prosthodontics Division), University of Louisville, School of Dentistry, USA
INTRODUCTION
The two versions of mineral trioxide aggregate (MTA; gray and white) have enjoyed clinical success in endodontics since 1995. The grayness of GMTA arises from the presence of an iron-containing compound, tetracalcium-aluminoferrite (4CaO-Al2O3-Fe2O3) in Portland cement (ProRoot® MTA product literature). In 2002, a white formula of MTA was introduced, achieved by eliminating iron oxide from the formulation. To distinguish between the two materials in this chapter, we will refer to the gray and white versions of MTA as GMTA and WMTA, respectively. Values in tables preceded by “~” were read from figures in the reference articles rather than from tables or text.
pH
In chemistry, pH is the measure of the solvated hydrogen ion. By definition, pure water has a pH close to 7.0. Solutions with a pH lower than 7.0 are acidic and those with a higher value are called basic or alkaline. The pH of a solution is measured with an electronic glass electrode or chemical indicators. Several studies have evaluated the pH value of MTA, which is ~10.2 immediately after mixing, and rises to 12.5 and remains constant after 3 hours (Torabinejad et al. 1995). When comparing pH values of GMTA with WMTA, the white material has been reported to display significantly higher pH values over an extended period of time following mixing (Chng et al. 2005; Islam et al. 2006). The pH of GMTA and WMTA were compared with ordinary and white Portland cement over 60 min. The pH values of all four products rise within 20 min after initial mixing and plateau by 60 min. White Portland and ordinary Portland cement also reached their peak pH values earlier than GMTA and WMTA (Table 3.1) (Islam et al. 2006).
Table 3.1 pH of two MTA products and two Portland cement products at two time periods.
Source: Islam et al. 2006. Reproduced with permission of Elsevier Publishing.
| Material | Initial pH | 60 min pH |
| Ordinary Portland cement | ~12.3 | ~13.0 |
| White Portland cement | ~11.9 | ~13.1 |
| Gray PMTA | ~11.3 | ~12.8 |
| White WMTA | ~11.9 | ~13.0 |
Mineral Trioxide Aggregate reportedly kept its high pH value throughout the course of a long-term study performed over a 78-day period (Fridland & Rosado 2005).
A Brazilian experimental formulation was measured for various properties and for pH compared with a commercial MTA product for up to 15 days. There were very few differences noted over this time period, but the pH values were much lower than reported in other studies (Table 3.2) (Santos et al. 2005).
Table 3.2 Changes in pH of a Brazilian MTA product and an experimental cement up to 15.4 days.
Source: Santos et al. 2005. Reproduced with permission of John Wiley & Sons, Inc.
| Time in hours | 0 | 25 | 50 | 100 | 200 | 250 | 370 |
| MTA-S (Angelus) | ~6.0 | ~10.4 | ~9.5 | ~7.2 | ~9.4 | ~7.5 | ~7.6 |
| Expt’l. cement | ~6.0 | ~10.3 | ~9.8 | ~7.2 | ~9.4 | ~7.6 | ~7.6 |
White MTA and three experimental MTA formulations were tested for pH and other properties by Porter and associates (Porter et al. 2010). The pH of Ceramicrete-D was very acidic, measuring 2.2. The others were typically basic (Table 3.3).
Table 3.3 Immediate pH of WMTA and three experimental MTA formulations.
Source: Porter et al. 2010. Reproduced with permission of Elsevier Publishing.
| Immediate pH | |
| White ProRoot MTA | 12.6 |
| Capasio 150 | 10.3 |
| Ceramicrete-D | 2.2 |
| Generex-A | 10.8 |
As part of a larger study of WMTA, pH measurements were made at intervals of up to 6 hours. There were no differences between WMTA mixed with distilled water and WMTA mixed with 15% Na2HPO4 buffer solution (Table 3.4) (Ding et al. 2008).
Table 3.4 pH of WMTA and WMTA modified with Na2HPO4 buffer.
Source: Ding et al. 2008. Reproduced with permission of Elsevier Publishing.
| WMTA mixed with | Initial pH | 6 h |
| Distilled water | ~11.0 | ~13.5 |
| 15% Na2HPO4 buffer | ~11.1 | ~13.3 |
White MTA Angelus, an experimental MTA, white Portland cement, and AH Plus epoxy sealer were placed in 1.5 mm tubes and immersed in 10 mL flasks for varying times up to 28 days, followed by pH measurements of the liquid. Modest changes in pH were observed, probably due to the small size of the cement samples, but the measured pH values were much lower than others reported in the literature. The pH of the three cement-based materials rose, but fell for the AH Plus sealer (Table 3.5) (Massi et al. 2011).
Table 3.5 pH of an experimental MTA, Portland cement, WMTA, and an epoxy sealant up to 28 days.
Source: Massi et al. 2011. Reproduced with permission of Elsevier Publishing.
| pH | MTAS | White Portland cement | WMTA Angelus | AH Plus |
| 3 h | 9.83 | 8.46 | 7.66 | 6.14 |
| 6 h | 8.18 | 7.79 | 8.06 | 5.77 |
| 12 h | 9.49 | 7.96 | 7.64 | 6.06 |
| 24 h | 8.76 | 7.62 | 7.62 | 5.88 |
| 48 h | 8.16 | 7.67 | 7.66 | 6.04 |
| 7 days | 7.97 | 7.82 | 8.00 | 4.97 |
| 14 days | 7.90 | 7.82 | 8.00 | 4.96 |
| 28 days | 8.08 | 8.03 | 8.10 | 6.75 |
Most references report pH values from 10 to 13, except the studies by Santos et al. (2005) and Massi et al. (2011). In general, pH rises after mixing and mimics the alkalinity of calcium hydroxide used in endodontics in the past, which may help to account for its favorable biological response.
SOLUBILITY
The solubility of a substance fundamentally depends on the solvent as well as on temperature and pressure. The extent of the solubility of a substance in a specific solvent is measured as the saturation concentration, after which adding more solute does not increase its concentration in the solution. The degree of solubility of MTA was assessed according to a modified American Dental Association specification (ANSI/ADA 1991). While the majority of studies have reported low or no solubility for MTA (Torabinejad et al. 1995; Danesh et al. 2006; Poggio et al. 2007; Shie et al. 2009), partial solubility with a decreasing rate over time was reported in a long-term study over a 78-day period (Fridland & Rosado 2005).
The water-to-powder ratio influences the amount of solubility, with higher water-to-powder ratios increasing MTA solubility and porosity (Fridland & Rosado 2005).
The release of calcium ions from MTA has been reported by several investigators (Sarkar et al. 2005; Bortoluzzi et al. 2006; Bozeman et al. 2006; Ozdemir et al. 2008). Despite the fact that the formation of apical barriers is highly successful using calcium hydroxide, this material is quickly reabsorbed when in contact with the apical tissues, making it necessary to follow the clinical case long-term to confirm the formation of the barrier. With the MTA, this formation is predictable and it is not necessary to monitor. MTA offers a barrier with excellent sealing properties and a high degree of biocompatibility (Linsuwanont 2003). Addition of CaCl2 to WMTA revealed a significant increase in calcium release during the first 24 hours (Bortoluzzi et al. 2006). Interestingly, high levels of calcium in a cell culture environment decreased cell proliferation (Midy et al. 2001), suggesting that released calcium ions from MTA may interact with phosphorus in tissue fluid to yield hydroxylapatite, which helps to explain the physicochemical basis for MTA’s successful clinical applications (Fig. 3.1) (Sarkar et al. 2005). Calcium release from MTA might be influenced by certain clinical conditions. Islam and associates found that the percent solubility of WMTA was greater than that of white Portland cement, ordinary Portland cement, and, especially, GMTA (Islam et al. 2006). Solubility in this case may be beneficial to the success of the product in that it allows for the dissolution of components, which leads to the formation of reaction products at the interface between the material and the tooth, generating a biologic seal mostly of calcium hydroxide (Table 3.6).
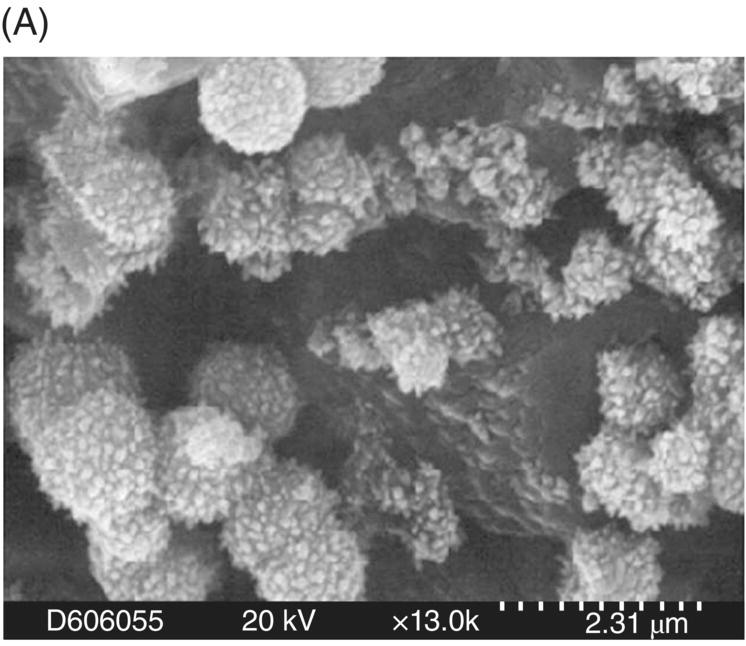
Fig. 3.1 (A) Typical scanning electron micrograph of precipitates from mineral trioxide aggregate – synthetic tissue fluid interaction (×13,000). (B) Energy dispersive X-ray analysis spectrum from precipitates in A (above) and their semi-quantitative chemical composition (below). (C) X-ray diffraction pattern of mineral trioxide aggregate – synthetic tissue fluid precipitates. Source: Sarkar et al. 2005. Reproduced with permission of Elsevier Publishing.
Table 3.6 Percent solubility of two MTA products and two Portland cement products at an unspecified time.
Source: Islam et al. 2006. Reproduced with permission of Elsevier Publishing.
| Solubility in % ± SD | |
| White WMTA | 1.28 ± 0.02 |
| Gray PMTA | 0.97 ± 0.02 |
| White Portland cement | 1.05 ± 0.02 |
| Ordinary Portland cement | 1.06 ± 0.07 |
Fridland & Rosado (2003) found that the higher the water-to-powder ratio for WMTA, the lower the degree of solubility and porosity at 24 hours (Fridland & Rosado 2003). This is in accord with the notion that the chemical reaction may be extended and incomplete using a wetter mix, accounting for the greater clinical success of WMTA (Table 3.7).
Table 3.7 Percent solubility and porosity at 24 hours of WMTA as a function of water-to-powder ratios.
Source: Fridland & Rosado 2003. Reproduced with permission of Elsevier Publishing.
| Water/powder ratio WMTA | W/W % Solubility | % Porosity |
| 0.26 | 1.76 | 30.25 |
| 0.28 | 2.25 | 35.72 |
| 0.30 | 2.57 | 35.19 |
| 0.33 | 2.83 | 38.39 |
In a later study, Fridland & Rosado (2005) found that the solubility of WMTA at 0.33 water-to-powder ratio decreased over nine days from 0.37% to 0.02%, and that the calculated cumulative solubility was a remarkable 24.02% at 80 days. The solubility was considerably less for the 0.28 water-powder-ratio mix (Table 3.8).
Table 3.8 Daily and cumulative percent solubility of WMTA up to 80 days.
Source: Fridland & Rosado 2003. Reproduced with permission of Elsevier Publishing.
| Water/powder ratio | Tested W/W % daily solubility | ||
| 1 day | 0.28 | ~2.9 | |
| 0.33 | ~3.7 | ||
| 2 days | 0.28 | ~1.2 | |
| 0.33 | ~1.8 | ||
| 9 days | 0.28 | ~0.1 | |
| 0.33 | ~0.2 | ||
| 80 days | 0.28 | Calculated cumulative solubility | 16.13 |
| 0.33 | Calculated cumulative solubility | 24.02 |
Poggio and associates measured the percent solubility of four retrograde filling materials as weight loss after one day and two months and found no significant difference between them. ProRoot WMTA displayed 0.91% solubility after two months (Table 3.9) (Poggio et al. 2007).
Table 3.9 Weight loss of four root sealant materials for up to 2 months.
Source: Poggio et al. 2007. Reproduced with permission of Elsevier Publishing.
| Material (n = 6) | % Weight loss after 24 h (SD)% | Weight loss after 2 months (SD) |
| IRM | 0.65 (0.19) | 1.01 (0.22) |
| ProRoot MTA | 0.70 (0.26) | 0.91 (0.29) |
| Superseal | 0.23 (0.25) | 0.40 (0.24) |
| Argoseal | 0.97 (0.33) | 1.50 (0.35) |
Solubility was tested for white Portland cement and WMTA, both modified with added CaCl2. Setting time was greatly reduced and WMTA gained weight by 72 hours. Solubility was reduced for the white Portland cement and both products increased in pH (Table 3.10) (Bortoluzzi et al. 2009).
Table 3.10 Composition of modifications of WMTA and two Portland cements, with solubility values up to 28 days.
Source: Bortoluzzi et al. 2009. Reproduced with permission of Elsevier Publishers.
| WMTA (1.0 g) | 1.0 g WMTA + 0.26 mL H2O | |||||||||
| WMTA + CaCl2 | 1.0 g WMTA + 0.1 g CaCl2, + 0.18 mL H2O | |||||||||
| White Portland cement | 0.8 g white Portland cement + 0.2 g Bi2O3 + 0.26 mL H2O | |||||||||
| White Portland cement + CaCl2 | 0.8 g white Portland cement + 0.2 g Bi2O3 + 1 g CaCl2 +1 g WPC with 0.1 g CaCl2 + 0.18 mL H2O | |||||||||
| 24 h | 72 h | 7 days | 14 days | 28 days | ||||||
| M | MP | M | MP | M | MP | M | MP | M | MP | |
| WMTA | −0.468 | 15.50 | −0.659 | 15.50 | −0.331 | 15.5 | −0.721 | 15.5 | −0.499 | 15.5 |
| WMTA+CaCl2 | −0.593 | 9.333 | 3.462 | 18.66 | 3.875 | 19.00 | 3.991 | 19.16 | 4.112 | 19.50 |
| WPC | −0.199 | 19.00 | −4.696 | 6.333 | −5.064 | 6.00 | −5.863 | 6.000 | −6.777 | 6.00 |
| WPC+CaCl2 | −0.878 | 6.166 | −1.267 | 9.500 | −1.920 | 9.500 | −2.646 | 9.333 | −2.809 | 9.00 |
Negative values indicate weight loss.
M, median, MP, mean posts of solubility (%) of hydrated cements in each period.
In general, the tests show low solubility of MTA products in most cases. However, there is enough solubility in the early stages to begin the formation of a calcium-rich and highly basic environment, which is thought to stimulate the formation of calcium hydroxide, a precursor of biologically formed hydroxylapatite.
Silver zeolite is a crystalline aluminosilicate material that releases silver ions, which are antimicrobial against most microbes. Silver ions were added to sodium zeolite (Na2O:Al2O3:2SiO2:XH2O) with sodium nitrate by an ion exchange mechanism. MTA powder (Dentsply, DeTrey, Germany) received the activated zeolite at 0.2% or 2.0% mass fraction. The control material was unmodified MTA. Calcium release, setting times, water solubility and absorption were measured at 7 days (Cinar et al. 2013).
There were no differences in calcium release, with the highest value for 2.0% at 24 hours. Water absorption and solubility for the 0.2% sodium zeolite MTA was 8.59% and 1.38%, respectively. For the 2.0% sodium zeolite MTA it was 6.79% and −7.09%, respectively, c.f. 8.98% and 1.01%, respectively. The 2.0% addition significantly reduced setting time and was significantly more soluble than 0.2% zeolite MTA and plain MTA. These mineral additions to MTA have not been shown to be advantageous (Cinar et al. 2013).
SETTING EXPANSION
One reason for the sealing ability of MTA is its slight expansion upon setting. Both GMTA and WMTA are composed of approximately 75% Portland cement. White MTA differs from GMTA in its lower content of tetracalcium aluminoferrite. This difference in composition may affect setting expansion. Researchers have measured the setting expansion of several versions of MTA and found that GMTA expanded much more than WMTA or Portland cement, and that the water-to-powder ratio had little effect on expansion (Tables 3.11 and 3.12) (Storm et al. 2008; Hawley et al. 2010).
Table 3.11 Percent expansion of MTA as a function of water-to-powder ratios after 25 hours.
Source: Hawley et al. 2010. Reproduced with permission of Elsevier Publishing.
| Water/powder ratio | WMTA | GMTA |
| 0.26 | 0.084 ± 0.012 | 2.42 ± 0.324 |
| 0.28 | 0.058 ± 0.044 | 2.38 ± 0.034 |
| 0.30 | 0.093 ± 0.013 | 2.56 ± 0.393 |
| 0.35 | 0.086 ± 0.029 | 2.15 ± 0.337 |
Table 3.12 Mean percentage of linear setting expansion of GMTA and WMTA submerged in distilled water or Hank’s buffered salt solution and Portland cement submerged in water.
Source: Storm et al. 2008. Reproduced with permission of Elsevier Publishing.
| Groups | 5 h (SD) (n) | 7.7 h (SD) (n) | 24 h (SD) (n) |
| GMTA/water | 0.47 (0.09) (5) | 0.74 (0.15) (3) | 1.02 (0.19) (3) |
| GMTA/HBSS | 0.34 (0.04) (3) | 0.45 (0.06) (3) | 0.68 (0.12) (3) |
| WMTA/water | 0.04 (0.01) (5) | 0.06 (0.01) (5) | 0.08 (0.01) (3) |
| WMTA/HBSS | 0.09 (0.03) (3) | 0.10 (0.03) (3) | 0.11 (0.03) (3) |
| PC/water | 0.24 (0.05) (5) | 0.26 (0.04) (5) | 0.29 (0.04) (5) |
RADIOPACITY
The radiopacity of MTA is determined using the method described by ISO 6876, section 7.7. The thickness of an aluminum step wedge is plotted against the logarithm of the corresponding densitometer values to calculate relative radiopacity, expressed as the equivalence of aluminum (International Organization for Standardization 2001). Due to the additions of Bi2O3 as a radiopacifier, WMTA and GMTA were found to have more than six times the radiopacity of modified and unmodified Portland cement (Islam et al. 2006). Conversely, Porter and associates found a higher level using the same methods and looked at the relative radiopacity of other dental sealants as well (Table 3.13) (Porter et al. 2010).
Table 3.13 Radiopacity equivalent of pure aluminum
| Islam et al. (2006)WMTA | 6.74 mm |
| PMTA | 6.47 mm |
| White Portland cement | 0.95 mm |
| Ordinary Portland cement | 0.93 mm |
| Porter et al. (2010) | |
| ProRoot WMTA | 8.5 mm |
| Capasio 150 | 4.2 mm |
| Ceramicrete-D | 3.2 mm |
| Generex-A | 6.8 mm |
Húngaro Duarte and associates examined the relative radiopacities of various heavy metals and other oxides at 20% concentration as possible radiopaquing additions to Portland cement (Húngaro Duarte et al. 2009). Bismuth oxide was found to be the most radiopaque of the additions, almost six times as radiodense as pure Portland cement (Table 3.14).
Table 3.14 Radiopacity of Portland cement, human dentin, and various additives to Portland cement.
Source: Húngaro Duarte et al. 2009. Reproduced with permission of Elsevier Publishing.
| Equivalent mm Al (±SD) | |
| Pure Portland cement | 1.01 ± 0.01 |
| Portland cement + 20% bismuth carbonate | 3.25 ± 0.38 |
| Portland cement + 20% iodoform | 4.24 ± 0.32 |
| Portland cement + 20% bismuth oxide | 5.93 ± 0.34 |
| Portland cement + 20% lead oxide | 5.74 ± 0.66 |
| Portland cement + 20% zinc oxide | 2.64 ± 0.02 |
| Portland cement + 20% zirconium oxide | 3.41 ± 0.19 |
| Portland cement + 20% barium sulfate | 2.80 ± 0.18 |
| Portland cement + 20% bismuth subnitrate | 4.66 ± 0.42 |
| Portland cement + 20% calcium tungstate | 3.11 ± 0.25 |
| Dentin | 1.74 ± 0.02 |
Radiopacity should be a fundamental characteristic of all materials and devices used in dentistry and medicine because, if these materials become embedded in the tissues of the body and are swallowed or inhaled, they must be identifiable in the case of trauma or other untoward events. Heavy metal powders, metal oxides and compounds, metallic glasses, and polymeric additives containing heavy metals all have advantages and disadvantages. Bismuth oxide has been used to successfully increase the radiopacity of MTA. Other substituents may be used in future studies that satisfy all requirements.
Cytotoxicity, radiopacity, pH, and flow of a calcium silicate-based (MTA Fillapex (Angelus, Brazil) and an epoxy resin-based (AH Plus, Dentsply, Germany) endodontic sealer were measured at 3, 24, 72, and 168 h. Cytotoxicity was evaluated by the MTT assay to check the viability of BALB/c 3T3 cells up to 4 weeks (Silva et al. 2013).
Radiopacity (mm Al) of the sealers were 8.59 for AH Plus and 7.06 for MTA Fillapex. Although significantly different, both sealers were sufficiently radiopaque, compared to 3 mm Al (Table 3.15). One gram of mixed sealer was pressed between glass plates under a 120 g load for 180 s. MTA Fillapex (31.09 ± 0.67 mm) flowed significantly more than AH Plus (25.80 ± 0.83 mm).
Table 3.15 Mean pH values and per cent cytotoxicity at different time periods. Silva et al. 2013.
| pH | Cytotoxicity (% of control) | ||||||||||
| Time in hours 3 | 24 | 48 | 72 | 168 | Time in weeks | 0 | 1 | 2 | 3 | 4 | |
| AH Plus | 7.08a | 6.93a | 6.78a | 6.90a | 6.92a | 37c | 70c | 92c | 100c | 98c | |
| MTA | 9.68b | 9.34b | 8.25b | 8.02b | 7.76b | 4d | 15d | 13d | 23d | 30d | |
| Fillapex Control | 6.50 | 6.50 | 6.50 | 6.50 | 6.50 | ||||||
Superscripts indicate significant differences (p < 0.05).
There were significant differences in pH and cytotoxicity between brands at all time periods. AH Plus was more cytotoxic than MTA Fillaplex, but both are adequate as an endodontic sealer.
Portland cement was modified with additions of 10, 20, and 30 wt. % Bi2O3, ZrO2 or YbF3. Controls were ProRoot MTA (Dentsply, Tulsa, USA) and pure Portland cement. An aluminum step wedge on occlusal dental films was radiographed next to tooth slices to measure radiopacity. Compressive strength, mercury intrusion porosimetry, and setting time were measured. The morphology was examined by scanning electron microscopy (Antonijevic et al. 2013).
Significant increases in porosity were observed in all experimental cements. Bi2O3 extended the setting time significantly, from 90 to 115 minutes; ZrO2 and YbF3 had no effect on setting time. Additions of at least 10 wt. % Bi2O3 and 20 wt. % ZrO2 or 20 wt. % YbF3 increased radiopacity above 3 mm Al. Compressive strength of Portland cement was increased by adding ZrO2 and YbF3, but not significantly; Bi2O3 significantly decreased it. No degradation of physical properties was observed by adding ZrO2 and YbF3, which may be used to replace Bi2O3 in MTA (Antonijevic et al. 2013).
White MTA Angelus (Angelus, Brazil) with powder-to-water ratios of 4:1, 3:1 and 2:1 were tested for radiographic density and compared to cylinders of dentin and an aluminum step wedge. Mean solubility, setting time, pH, and calcium ion release (measured using atomic absorption spectrophotometry) were carried out at 3, 24, 72 and 168 h (Table 3.16). Root-end fillings of 30 acrylic teeth were scanned twice by micro-CT before and after immersion in ultrapure water for 168 hours (Cavenago et al. 2014).
Table 3.16 Mean (±SD) for various properties. Cavenago et al. 2014.
| p/l ratio | Mean radiopacity (mm Al) | Mean solubility (%) | Setting time | pH | Calcium release (mg/L) (hours) | |||||||
| Initial(minutes) | Final(hours) | 3 | 24 | 72 | 168 | 3 | 24 | 72 | 168 | |||
| 4:1 | 6.94a | 1.62 (1.27)e | 57.0 (2.0)g | 112 (2.0)g | 7.75j | 7.84j | 7.31j | 7.71j | 5.29n | 4.46n | 2.15n | 5.48n |
| 3:1 | 5.70b | 1.83 (0.77)e | 105 (1.52)h | 135 (2.0)h | 7.87j | 7.89j | 7.34j | 7.78j | 6.33n | 4.70n | 3.16np | 6.20n |
| 2:1 | 5.31c | 6.46 (1.83)f | 120 (2.51)i | 321 (2.0)i | 9.47k | 8.00j | 7.59j | 8.43j | 9.21p | 6.73p | 3.92p | 9.72p |
| Dentin | 0.79d | |||||||||||
Different letters in each group and column indicate statistical differences (p < 0.05).
Higher radiopacity was seen with a powder/liquid ratio of 4:1. More water in the mix lengthens the setting time and the pH and calcium ion release are higher ( p < 0.05). The more dilute group (2:1) was significantly more soluble (6.46%) compared to the other groups. The powder/water ratio significantly affected the physical and chemical properties of white MTA Angelus (Cavenago et al. 2014 and Table 3.16).
VARIOUS TYPES OF STRENGTH
Compressive str/>
Stay updated, free dental videos. Join our Telegram channel
VIDEdental - Online dental courses


