25 Fluoridation of Drinking Water
OPTIMAL FLUORIDE CONCENTRATIONS IN DRINKING WATER
Public policy for controlled water F levels in the United States takes the form of nonenforceable guidelines set by the U.S. Public Health Service (Box 25-1). Current policy is that these levels, for the United States, should be between 0.7 and 1.2 ppm F, depending on mean annual temperature of the locality. These guidelines, based on the assumption that people drink more water in a hotter climate than they do in a cooler one, are more than 40 years old and are shown in Table 25-1.
BOX 25-1 Who Watches Over How Much Fluoride Is in our Drinking Water?
The maximum contaminant level goal (MCLG) is the level of a contaminant in drinking water below which there is no known or expected risk to health. MCLGs allow for a margin of safety and are nonenforceable public health goals. The maximum contaminant level (MCL) is the highest level of a contaminant that is allowed in drinking water. MCLs are set as close to MCLGs as is feasible when the best available treatment technology and cost are taken into consideration. MCLs are enforceable standards. Both the MCLG and the MCL remain at 4.0 ppm F,46 pending further review by the EPA.
Table 25-1 Fluoride levels recommended by the U.S. Public Health Service for cool and warm climates122
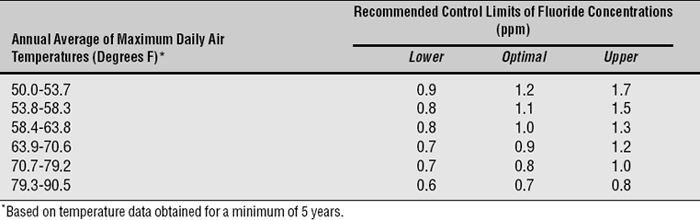
These temperature-related guidelines were developed from a series of well-conducted epidemiologic studies performed in the American west during the 1950s51–54; from these data, the researchers produced an algebraic formula for determining a community’s optimal water F level. This formula is based on Dean’s conclusion (see Chapter 24) that 1.0 ppm F was the optimum concentration for the Chicago area. Regardless of how appropriate Dean’s conclusion was in his time, the appropriateness of temperature-related guidelines is questionable given today’s living conditions. The climate-related guidelines are widely ignored in the United States anyway.80
The temperature-related guidelines in Table 25-1, developed under American dietary and cultural conditions, have been found unsuitable for Asian and African regions. Hong Kong, for example, reduced its water F levels to 0.5 ppm F by the mid-1990s because of increased fluorosis, and an expert committee of the World Health Organization has recommended a range of 0.5-1.0 ppm F for all parts of the world.130 The recommended levels for the United States have been in place since 1962 and are due for revision, because much in our lifestyles and exposure to F has changed since then. For example:
EARLY STUDIES OF FLUORIDATED WATER
The most important early studies of fluoridated water were described in Chapter 24. All the early research on the safety of F use and its impact on human health and function studied F in drinking water. By the time the first controlled fluoridation trials were begun in 1945, research had established the following facts:
Four independent studies of controlled fluoridation, in which the F concentration in the water supplies of the communities was brought up from negligible levels to 1.0-1.2 ppm, were begun in 1945 and 1946. They followed a long series of epidemiologic studies of caries experience related to F concentration in drinking water, which were summarized in Chapter 24. The four communities originally studied were the following:
At the end of terms ranging up to 15 years, caries experience was shown to be sharply reduced in each of the study populations, despite some differences in study design and examination criteria.2,5,12,69 These pioneer studies also found that dental fluorosis occurred to about the same extent6,105 as Dean had described earlier28: namely, some 7%-16% of the population was found to have mild to very mild fluorosis when the F exposure came from drinking water containing 1.0 ppm F.
The four original studies in which F was added to drinking water are sometimes called “classic” studies, although “pioneering” might be a better term. By present-day standards of field trials they were rather crude. Although they are often referred to as “longitudinal” studies, none of them was; all were of sequential cross-sectional design. Sampling methods and dental examiners tended to vary from year to year,1 which risked bias and unnecessary random error. Methods of statistical analysis were primitive by today’s standards. Data from the control communities were largely neglected after the initial reports, and conclusions were based on the much weaker before-after analysis in the test cities. (Among the early studies, the only true longitudinal study of fluoridation’s effects was the Tiel-Culemborg study in the Netherlands.)8,9
Public policy on any issue usually has to be established without complete information, and water fluoridation is no exception. When one considers that adults, on average, ingest 1-3 mg F/day in their normal diets, that 9-10 million Americans (and many other peoples around the world) have been drinking naturally fluoridated water for a century or so, and that over 100 million Americans have been drinking F-supplemented water for generations, there is a lot of empirical evidence that fluoridation at 1 ppm is not harmful. Certainly there is no credible evidence that F in these amounts leads to serious ill health. The scientific method cannot prove a negative; we take inability to reject the null hypothesis for specific conditions (see Chapter 13) as evidence of safety. The occasional allegation of a sensitivity reaction should be investigated seriously, but with the passage of time the probability becomes greater that fluoridation at 1.0 ppm produces no undesirable side effects. We support the policy of the U.S. Public Health Service that F should be added to drinking water at the recommended concentrations.
WORLD STATUS OF FLUORIDATION
Unfortunately there is no central compendium for international data on populations receiving fluoridated water. The FDI World Dental Federation has some self-reported information for some countries on its website (http://www%20fdiworlddental.org), but the data are not collated. Older information from the FDI shows that in 1984 there were 34 countries reporting fluoridation projects reaching some 246 million people, not including areas with naturally occurring F in the drinking water. Both the British Fluoridation Society16 and the World Health Organization95 estimated that some 210 million people worldwide receive fluoridated water. The foregoing statements are all of uncertain validity. Some factual summary statements about the global distribution of fluoridation are shown in Box 25-2.
BOX 25-2 Summary of Global Distribution of Water Fluoridation in 2000
Ireland remains the only nation (apart from the city-state of Singapore) to have a mandatory fluoridation law. Enacted in 1960, it subsequently withstood a legal challenge that went to the Irish High Court. Most large Irish urban communities had fluoridated water in the period 1964-72; 71% of Ireland’s population resided in fluoridated areas by 2004.98 Information from the Pan American Health Organization shows that nine countries in South America and the Caribbean have water fluoridation; most notable are Brazil and Chile, with 42% of the population in each country receiving fluoridated water.
At the other end of the spectrum, fluoridation has made little headway in Europe, and it is not technically feasible for much of Asia and Africa because of the relative absence of municipal water systems there. In Europe, fluoridation in the socialist countries of Eastern Europe ended with the demise of the former Soviet Union in the early 1990s.79 In Britain, the city of Birmingham, the second largest British city, has been fluoridated since 1964, and there is a belt of fluoridated communities near Birmingham in the West Midlands. On the other hand, there is no water fluoridation at all in Austria, Belgium, Denmark, France, Germany, Italy, Norway, and Sweden. Specific bans are in place in Sweden and Denmark (where a law on additives is interpreted to exclude fluoridation), and for various reasons fluoridation is a dead political issue in the others.
FLUORIDATION IN THE UNITED STATES
The Division of Oral Health of the Centers for Disease Control and Prevention (CDC) in Atlanta maintains fluoridation surveillance for the United States. The Water Fluoridation Reporting System, a voluntary program, forwards data from the states to the CDC, which then publishes the information periodically on its website. Extent of fluoridation is one of the eight indicators used in the National Oral Health Surveillance System (see Chapter 4).
At the end of 2000, the CDC estimated that fluoridated water was reaching some 162 million people in the United States, 57% of the total population and 66% of those receiving municipal water.125 About 10 million of these people were receiving water naturally fluoridated at 0.7 ppm F or more; the greatest concentrations of naturally fluoridated communities are found in Texas, Illinois, and New Mexico.128 In the year 2000 there were over 10,000 water systems with controlled or natural fluoride levels of 0.7 ppm F or more; these represent 18% of all public water systems in the country. This may not sound like much, but a large majority of public water systems serve communities with fewer than 1000 people, so that fluoridation is not cost effective. Drinking water is fluoridated in 42 of the 50 largest American cities. Over 700 communities in the United States have been fluoridating the water for 30 years or longer, and many of the naturally fluoridated communities have been using the same water source for more than three generations. The proportion of state populations reached by fluoridation ranges from close to 100% in Minnesota, Kentucky, Indiana, and Tennessee (plus the District of Columbia) to 2% in Utah and 9% in Hawaii.
Role of Federal, State, and Local Governments in Fluoridation
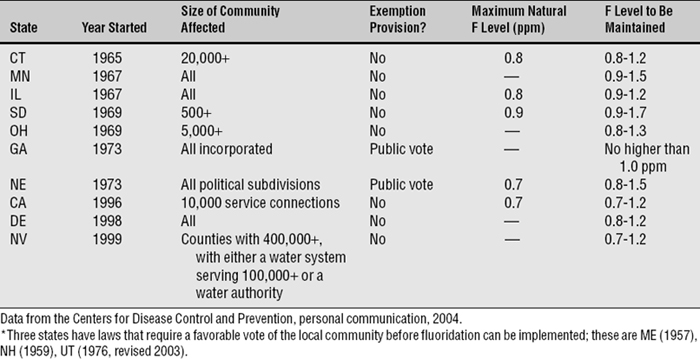
The decision to fluoridate is usually made by the local community, although a number of jurisdictions can be involved when water service district boundaries do not coincide with city and county boundaries. State laws requiring fluoridation now stand in 10 states; at the other end of the spectrum, there are three states that have laws requiring referenda. These states are shown in Table 25-2. The fluoridation laws have been generally successful, because in all states with them a high proportion of the population is receiving fluoridated water. Some of the states listed in Table 25-2, however, have provisions in their laws that can frustrate progress. These provisions reflect the political compromises necessary to get the law passed. For example, the California law, passed after a vigorous political battle in 1996, cannot be enforced unless outside funds (i.e., state or federal funds) are made available to the local community for the purchase, installation, and operation of the fluoridation system.
In 1981 seven block grants were initiated as a method of distributing federal health funds to the states. The philosophy behind block grants is that funds to finance a host of federal categorical programs that have grown up over the years are lumped together in specific blocks, and recipient states can determine for themselves to which programs they will allocate the funds. The Preventive Health and Health Services Block Grant includes funds for fluoridation, but fluoridation projects then have to compete at the intrastate level against other worthy prevention causes such as hypertension control and emergency medical services. Recent sources of federal funding for fluoridation are listed in Box 25-3. Future funding remains uncertain.
BOX 25-3 Sources of Federal Government Funding for Fluoridation
Drinking Water Standards
The U.S. Environmental Protection Agency (EPA) is the regulatory agency with responsibility for setting national standards for acceptable drinking water under the Safe Drinking Water Act (Public Law 93-523; see Box 25-1). This act was first passed in 1974 and has been renewed several times since. Most of these standards deal with defining acceptable levels of bacterial and chemical contaminants. In the 1975-76 National Interim Primary Drinking Water Regulations, in the standards promulgated soon after passage of the legislation, the EPA referred to naturally occurring F above 2 ppm as a “contaminant” requiring removal from drinking water. This latter requirement was intended to reduce dental fluorosis in affected areas, but it was criticized by many of the local authorities concerned on the grounds of cost (defluoridation is more expensive than fluoridation). Many communities that used drinking water naturally fluoridated at more than 2 ppm were small and could not afford the cost of meeting the standard. In addition, few of them seemed interested in defluoridating: the resulting fluorosis did not concern them and they were not aware of any other ill effects, so why bother?
The Interim Primary Drinking Water Regulations of 198040 left the recommended maximum contaminant level (RMCL) at 2 ppm F but included an explanatory statement that this standard did not contradict the beneficial effects of F in reducing dental decay. Whether this statement really helped clarify things, especially because that unfortunate word contaminant was retained, is doubtful. Public discussion on establishing the final standards became intense during the mid-1980s; the EPA was deluged with demands from both proponents and opponents of fluoridation. The state of South Carolina, for whom compliance with the RMCL of 2 ppm F would have been very expensive, brought suit against the EPA in 1981 to attempt to force it to revoke the interim RMCL. The EPA, in response, promised to rule on the issue when its studies were complete. South Carolina sued again in 1984, seeking faster action from the EPA, and this led to issuance of a consent decree in January 1985.41
Eventually the EPA settled this seemingly irresolvable issue by ducking underneath it. Concluding after its studies that dental fluorosis in the United States was a cosmetic defect rather than a health problem, the EPA proposed an RMCL for F of 4.0 ppm F, on the grounds that this level was sufficiently low to protect against crippling skeletal fluorosis.42 By late 1986, this RMCL became the maximum contaminant level for 4.0 ppm F, meaning that the EPA now had a standard to enforce. The original level of 2.0 ppm F became a secondary standard; that is, it was a nonenforceable recommended maximum, in effect a guideline. This secondary standard was justified on the grounds that “2 mg/L would prevent the majority of cases of water-related cosmetically objectionable dental fluorosis while still allowing for the beneficial effects of F (prevention of dental caries).”43
Although some aspects of this debate resembled a Gilbert and Sullivan operetta, it raised the serious question of whether control of dental fluorosis should be a subject for national standards or whether the issue should be left to states or localities to handle. State dental directors have to carry much of the regulatory load, and many are unhappy with the requirement that local communities must be notified when their F levels are between 2 and 4 ppm, especially since the EPA mandates that the word contaminant (again!) must appear in the letters of notification.44
Standards of this sort quite properly need reexamination from time to time. In 1992, the EPA requested the National Research Council to review the issue of primary and secondary standards for F in drinking water. An expert committee whose members had a variety of backgrounds (most were from outside dentistry) worked for more than a year and concluded that there was no current evidence to justify a change in the standards.90 The committee recommended that the issue of the relationship of F exposure to health be revisited at regular intervals because new evidence was appearing continuously. Following this report, the EPA decided in late 1993 not to change what was then called the maximum contaminant level goal of 4.0 ppm F.45 This standard still holds.46
CARIES REDUCTIONS FROM FLUORIDATION
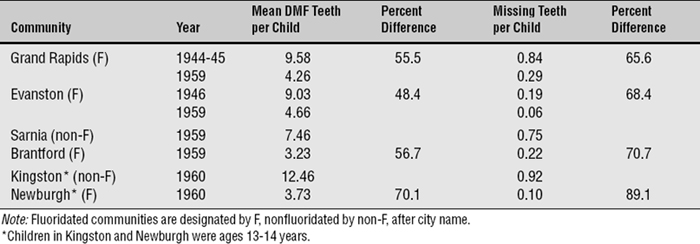
For many years, the statement that “water fluoridation reduces dental caries experience by half” was hardly questioned within dentistry. At a time when drinking water was the only significant source of F, that statement was probably true enough. Its basis was Dean’s 21 cities epidemiologic study of naturally fluoridated areas,29,31 supplemented by the results of the initial four controlled fluoridation projects begun in 1945-46. A summary of the results of these four pioneering studies is presented in Table 25-3. The table shows that after 13-15 years of fluoridation, DMF (decayed, missing, and filled) scores in 12- to 14-year-old permanent-resident children favored fluoridation by 48% to 70%. In absolute terms, average DMF levels in the fluoridated communities dropped from 7-9 teeth at the start of the studies to 3-4 teeth per child after 13-15 years.
Table 25-3 Decayed, missing, and filled (DMF) teeth per child ages 12-14 years and missing teeth per child at the end of the study term in four pioneer fluoridation communities5
Since those studies, exposure to F from toothpaste, other dental products, and food and drink has become universal. As a result, water fluoridation has moved from being the sole F exposure, as it was in those early days, to one of a number of F exposures. Caries status overall has continued to improve, and overall F exposure has to take much of the credit for that. Another reason for the inability to attribute 50% reductions in caries to water fluoridation today is that the effects of F in drinking water diffuse into surrounding communities and raise the baseline. Nonetheless, 12-year-old children living in states where more than half of the communities have fluoridated water have 26% fewer decayed tooth surfaces per year than 12-year-old children living in states where less than one quarter of the communities are fluoridated.61 A rigorous systematic review in Britain, carried out by an expert group at the University of York, concluded that the median increase in the proportion of persons with DMFT score (number of decayed, missing, and filled permanent teeth) of 0 attributable to water fluoridation was 15%.85
Stay updated, free dental videos. Join our Telegram channel
VIDEdental - Online dental courses


