24 Fluoride: Human Health and Caries Prevention
A CLASSIC EPIDEMIOLOGIC STUDY
In his travels over the next few years, McKay found that the condition was highly prevalent in the Colorado Springs area. It was found only in long-term residents, individuals who had been born there or who had come to the area as babies. Because the stain was difficult to polish off, McKay reasoned that it must be caused by an environmental agent that was active during the period of enamel formation. To ensure that his findings attracted some attention, McKay was shrewd enough to enlist the collaboration of G. V. Black, a major figure in dental history, in writing the first description of what then came to be called mottled enamel.15 This detailed report, in the elegant prose of the time, is a tribute to McKay’s investigative thoroughness.
McKay found that mottled enamel was endemic in many other communities along the Continental Divide and the plains to the east. It was most prevalent where deep artesian wells were the source of drinking water, and within any community the persons affected had almost invariably been users of the same water supply. By the 1920s McKay had reached the conclusion that the etiologic agent had to be a constituent of some community water supplies, despite the fact that chemical analyses all failed to identify likely constituents. In communities such as Andover and Britton, South Dakota, where he found severe mottling, he advised mothers to obtain their children’s drinking water from sources other than the community supply. In Oakley, Idaho, McKay found that children living on the outskirts of the city, using water from a private spring, were free of mottling. He advised the citizens of Oakley to abandon their old supply and tap this spring for a new source, which the community did in 1925. McKay was right, for children born in Oakley subsequent to the change were free of mottled enamel.128
By 1930 new methods of spectrographic analysis of water had been developed. In 1931 McKay sent several samples of suspected water to an Alcoa Company chemist named Churchill, who was using these new methods. Churchill identified F in each of the samples, in amounts ranging up to 14 parts per million (ppm).26 At around the same time, similar findings were reported by investigators at the University of Arizona161 and by a veterinary group in Morocco, then still a French colony, that was studying le darmous, the local name given to an extreme degree of mottled enamel found in Moroccan sheep.174
Amidst this flurry of concern, however, McKay had also noted some benefits that seemed to accompany mottled enamel. In 1928, 3 years before F was identified in drinking water, he was confident enough to publish his view that caries experience was reduced by the same waters that produced mottled enamel.127 A similar observation was made shortly afterward in England by Ainsworth,2 who like McKay was an observant dentist with an inquiring mind. Although McKay was not the first to make this suggestion, none of the earlier observers took the idea any further. McKay, and Dean as well, are good examples of history’s putting the right people in the right place at the right time.
The task of defining the relationship of F to mottled enamel now passed to Dean. His first job was to map out the prevalence of mottled enamel in the United States. Dean began like an investigative reporter, writing extensively to dental societies all around the country to ask for their experiences. He received a good response and published his first map on the distribution of mottled enamel in 1933.32 His next step was to develop a seven-point ordinal-scale index to classify the full range of mottled enamel he had seen, from the finest of lacy markings to the stained and highly friable enamel seen with extreme hypomineralization.33
Dean began using the term fluorosis to replace mottled enamel in the mid-1930s.39 He patiently surveyed children in many parts of the country, using his original fluorosis index, and built up a substantial body of information (what today we would call a database) for analysis. He devised his Community Fluorosis index based on his original seven grades of severity.38 Studies through the mid-1930s analyzed many drinking water samples for minerals and other chemical constituents, but none apart from F could be related to fluorosis.39,41 Dean chose his words carefully to define a desirable F concentration as follows:
For public health purposes, we have arbitrarily defined the minimal threshold of fluoride concentration in a domestic water supply as the highest concentration of fluoride incapable of producing a definite degree of mottled enamel in as much as 10 percent of the group examined.39
By the mid-1930s, Dean had concluded that this “minimal threshold” level was 1 ppm F,34 and that fluorosis seen in communities with water below 1 ppm F was “of no public health significance.”40 Soon afterward he defined 1 ppm F as “the permissible maximum.”45 Later in that decade of the Great Depression, Dean condensed his original 1934 fluorosis index to one using a six-point ordinal scale (see Chapter 17) by combining the categories of “moderately severe” and “severe.”42 He then added numerical values to the categories to permit quantitative comparisons among populations. By 1942 Dean had documented the prevalence of fluorosis for most of the United States.36
Although he still documented fluorosis in his studies, the main theme of Dean’s research from then on was the F-caries relationship. In the mid-1930s Dean matched his fluorosis data for children in parts of South Dakota, Colorado, and Wisconsin with the caries data from an earlier 26-state survey in what today would be called an ecologic study (see Chapter 13). Although he could hardly have failed to notice the low caries experience in communities with F-bearing water during his early surveys, this was his first report in which he commented on the inverse relationship between fluorosis and caries.35
Encouraged by these preliminary data, Dean chose four cities in central Illinois as study sites in which to test the hypothesis that consumption of F-containing water was associated with a reduced prevalence of caries. Galesburg and Monmouth, where Dean had already studied fluorosis,40 used water from deep wells that averaged 1.8 and 1.7 ppm F. Macomb and Quincy used surface water averaging 0.2 ppm F. Clinical examinations of children ages 12-14 years, all with lifetime residence in their respective cities, showed that more than twice as many children in Galesburg and Monmouth were free of detectable caries than in the two cities with low-F water, and the mean number of permanent teeth affected by caries in Galesburg and Monmouth was half of that in the two cities with low-F water.44 The evidence to support the F-caries hypothesis was now stronger.
[It is] obvious that whatever effect the waters with relatively high fluoride content (over 2.0 ppm of F) have on dental caries is largely one of academic interest; the resultant permanent disfigurement of many of the users far outweighs any advantage that might accrue from the standpoint of partial control of dental caries. On the other hand, the demonstration of such marked dental caries differences as were observed at Galesburg and Quincy made advisable a quantitative study of the influence on dental caries of waters with lower ranges of fluoride concentration. If marked inhibitory influences were operative at concentration levels as low as the minimal threshold of endemic fluorosis (1.0 ppm), the findings would be of considerable import.43
The next logical step was therefore to define the lowest F level at which caries was clearly inhibited. This was done through a series of investigations that have become known collectively as the 21 cities study and that are rightly considered a landmark in dental research. The first part consisted of the results of clinical examinations of children ages 12-14 with lifetime residence in eight suburban Chicago communities with various but stable mean F levels in their domestic water.43 The project was later expanded by adding data from 13 additional cities in Illinois, Colorado, Ohio, and Indiana.37 The collective findings of the 21 cities study are depicted graphically in Figs. 24-1 and 24-2. Fig. 24-1 shows that dental caries experience in different communities dropped sharply as F concentration rose toward 1 ppm, then leveled off. Fig. 24-2 shows the dental fluorosis experience that Dean found among the 12- to 14-year-olds in the 21 cities. Dean’s practice was to show questionable fluorosis separately in his reports, as we have done in Fig. 24-2. The data in Fig. 24-2 suggest that, had “questionable” fluorosis been included in the prevalence figures, then the level for “acceptable” fluorosis might have been set at concentrations lower than 1 ppm F.
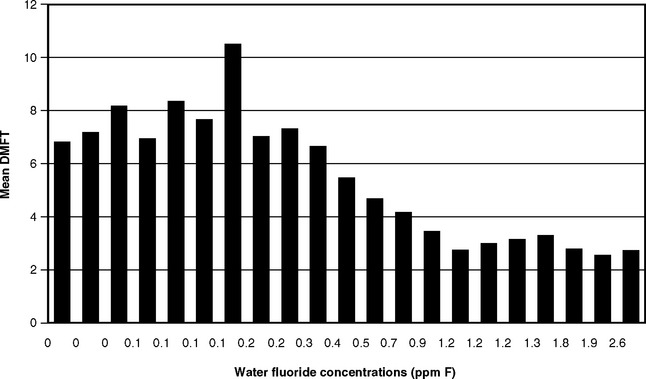
Fig. 24-1 Decayed, missing, and filled permanent teeth (DMFT) in children ages 12-14 in 21 cities in the late 1930s, related to the fluoride concentration.37,43
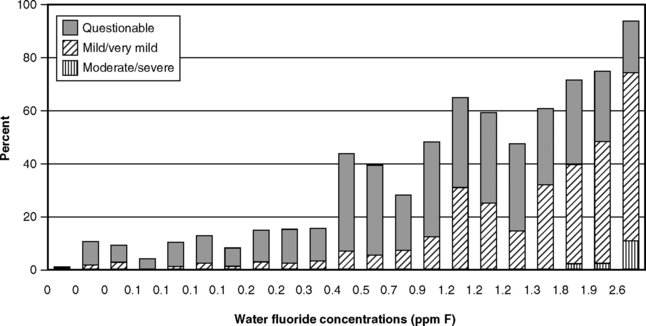
Fig. 24-2 Fluorosis experience of children ages 12-14 in 21 cities in the late 1930s, related to the fluoride concentration of drinking water.37,43
Because the 21 cities study had a cross-sectional design, the results confirmed the association but could not by themselves establish the cause-and-effect relationship between fluoridated water and reduced caries prevalence. But the data in Figs. 24-1 and 24-2 did lead to the adoption of 1.0-1.2 ppm as the appropriate concentration of F in drinking water in temperate climates, a standard that remains in place today in the United States. These results also set the stage for a prospective test of the F-caries hypothesis, first suggested in 1943.8 The years of study of people using water with F levels much higher than the proposed 1 ppm (detailed later in this chapter) were sufficient to convince public authorities that the prospective tests could be carried out in safety. These first prospective studies are described in Chapter 25.
ENVIRONMENTAL FLUORIDE
Fluorine is one of the most reactive elements and therefore is never found naturally in its elemental form. The F ion, however, is abundant in nature and occurs almost universally in soils and waters in varying, but generally low, concentrations. Seawater contains 1.2-1.4 ppm F.181 Fresh surface water generally has very low concentrations, 0.2 ppm F or less, whereas concentrations of up to 29.5 ppm F have been recorded in deep well water in Arizona120 and concentrations of over 40 ppm in boreholes in Kenya.112 F’s ubiquity in soil and water means that all plants and animals contain F to some extent. Given this environmental omnipresence, it seems likely that all forms of life have evolved to thrive with continuous exposure to small amounts of F.
SOURCES AND AMOUNTS OF FLUORIDE INTAKE
Humans absorb F from air, food, and water. F intake from air is usually negligible, around 0.04 mg F/day.180 Exceptions can occur around some industrial plants that work with F-rich material, such as aluminum smelters with inadequate safeguards to prevent the escape of F-containing compounds. Such environmental hazards should be controlled to the extent possible, an issue that has nothing whatever to do with the use of F to control caries.
F’s abundance in soils and plants means that everyone consumes it to some extent. Studies to estimate the average daily intake of F from all sources have provided fairly consistent results, despite both the variability of the human diet and methodologic difficulties inherent in analyzing such minute amounts. Estimates for an adult North American male in an area with fluoridated water fall within the range of 1-3 mg F/day from food and beverages,30,60,102,141,159,160,165 decreasing to 1 mg F/day or less in an area without fluoridation.30,102,141,159,160 “Market basket” analyses indicated that 6-month-old infants ingested 0.21-0.54 mg F/day in four American cities with different F concentrations in the drinking water. For 2-year-olds in the same cities, the range was 0.41-0.61 mg F/day.139,140
F ingestion in infancy is a matter of some concern because of the risk of dental fluorosis. Methodical estimates of F intake by infants have come from the Iowa F studies, initiated in the 1990s, which showed that F exposure among infants is extensive and variable. The Iowa studies documented the F exposures of newborn infants at periodic intervals through extensive interviews about F exposure from drinking water, toothpaste, and dietary supplements. During the first 3 years of life, F ingestion from these sources averaged 0.37-0.45 mg daily from birth to 3 months, 0.5 mg at 6-9 months, 0.36 mg at 12 and 16 months, and 0.5-0.63 mg from 16 to 36 months.107 Although mean intakes in Iowa were similar to those estimated in the earlier market basket surveys, there was a considerable range of intakes, with 90th percentile values well above the means and medians. When values were expressed as F intake per kilogram of body weight, nearly half of the children up to 6 months of age were found to be exceeding the desirable limits, although this proportion dropped considerably at later ages. The upper limit of intake for 12-month-old children, beyond which fluorosis risk is greatly increased, has been estimated at 0.43 mg F/day.20 The 12-month-old children in the Iowa studies averaged 0.36 mg F/day,107 but more than 25% of them were ingesting F above that upper limit.
The principal overall finding of the Iowa studies is the great variability of F intake during infancy, which is to be expected given the range of dietary choices for infants and the range of F concentrations in drinking waters. Despite the difficulty in conducting studies like these, the results are similar to those found in the market basket surveys described earlier and in studies from other countries.70,115
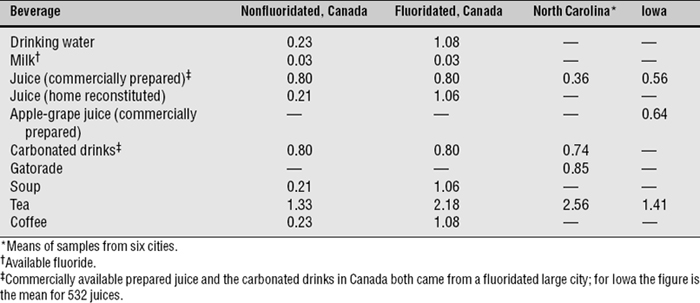
For most people, water and other beverages provide some 75% of F intake, whether or not the drinking water is fluoridated.160 This may occur because many soft drinks and fruit juices are processed in cities with fluoridated water, or it may reflect variable F content of the ingredients. One brand of grape juice in North Carolina, for example, was found to contain more than 1.6 ppm F, even when reconstituted with deionized water.143 Even in soft drinks of the same brand, F levels can vary considerably due to production at different sites.76 Another source of high F intake for infants is powdered infant formula reconstituted with fluoridated drinking water.22 The F content of some tested beverages is shown in Table 24-1.
FLUORIDE PHYSIOLOGY
Absorption, Retention, and Excretion
Ingested F is absorbed mainly from the upper gastrointestinal tract, and some 95% of ingested F is absorbed. Absorbed F is transported in the plasma and is either excreted or deposited in the calcified tissues. Most absorbed F is excreted in the urine; a single ingestion of 5 mg F by an adult is absorbed and cleared from the blood in 8-9 hours.180 F ingested on an empty stomach produces a peak plasma level within 30 minutes. The time of the plasma peak is extended, and the level of the peak reduced, if the F is taken with food. This is probably because of the binding of some F with calcium and other divalent and trivalent cations. When F absorption is inhibited in this way, fecal excretion of F increases.50
Studies of what is called the body burden of F, meaning the amount that can be safely absorbed and the point at which F absorption become a health concern, have relied mostly on urinary volumes and plasma concentrations as the primary measures. Samples of both are relatively simple to obtain, although both measures reflect only recent F intake (i.e., during the previous 3-4 weeks) rather than lifetime intakes. Urinary concentrations can vary considerably with fluid intake during the period of F exposure,49 and a 24-hour sample is required for accuracy. Accurate monitoring of plasma levels in individuals also requires frequent measurement because of normal hour-to-hour fluctuations. Plasma F concentrations are more closely correlated with urinary flow rates than with urinary F concentrations.51 Although there is no absolute measure of lifetime F intake, even theoretically, the closest measure of long-term F intake would be based on bone F content. However, for research purposes, this is a theoretical concept only; people do not volunteer to give bone samples!
Plasma F is found in ionic and nonionic forms. The biologic significance of the nonionic form has not yet been determined, and its concentration is independent of F intake. Absorbed F is transported by plasma as ionic F. It is the level of this ionic F that rises temporarily after F ingestion and then drops rapidly; ionic F levels are not homeostatically regulated. In a healthy adult male living in an area with fluoridated water, plasma F levels are around 0.019 ppm (1 μmol/L), although this level fluctuates throughout the day.50 Plasma levels are generally higher in persons living in fluoridated communities than in those living in nonfluoridated communities. Plasma F levels in persons with chronic kidney failure can rise to 0.05-0.09 ppm F (2.6-4.7 μmol/L) without affecting health.90 Nephrotoxic plasma F values in healthy individuals have been estimated at 0.95 ppm F (50 μmol/L).
F has an affinity for calcified tissues, that is, bone and developing teeth. F that is not excreted is deposited in these hard tissues, although storage is dynamic rather than inert. Bone F levels (from postmortem assays) range from 800 to 10,000 ppm, depending on many factors, including age and F intake. F levels in the outer few microns of dental enamel range from 400 to 3000 ppm and decrease rapidly with greater enamel depth. F concentrations in soft tissue rise or fall in parallel with plasma F levels, but because healthy excretion and deposition mechanisms operate so rapidly, there is negligible retention of F in the fluids of soft tissues other than the kidney.180 Some F has been found in the aorta, associated with calcification of that blood vessel. Deposition in the placenta is also associated with islets of calcified tissue.55 A greater proportion of ingested F is excreted in older persons than in the young because the growing skeleton in young people absorbs more F175,182 and probably because children have lower renal clearance rates than adults.164
Because of the importance of the kidneys in maintaining F balance, the only disease condition that requires medical consideration with regard to F ingestion is chronic kidney failure. Patients who receive renal dialysis for long periods with F-free water have maintained plasma levels of 0.06 ppm F, whereas in some inadvertently receiving dialysis with fluoridated water (definitely not a recommended procedure) levels as high as 0.24 ppm F have been recorded. Although a plasma level of around 0.09 ppm F had been suggested as the upper limit before a kidney patient undergoing dialysis should reduce F intake, evidence for this recommendation has come from only a few case studies.90 With today’s standards for dialysate fluid, current medical opinion is that even persons with severe renal impairment can consume fluoridated water without ill effects as long as they are receiving regular dialysis treatment.
Aluminum, iron, and other minerals create greater technical problems for the renal dialysis process than does F. The standard for dialysate water set by the Association for the Advancement of Medical Instrumentation is that the F content should not exceed 0.2 ppm.94 Water used in renal dialysis should first be treated by reverse osmosis, which is superior to the older process of deionization in that it removes F and other minerals almost entirely.166
Optimal Fluoride Intake
Frank McClure, a biochemist with the U.S. Public Health Service, estimated in 1943 that the “average daily diet” contained 1.0-1.5 mg F, or about 0.05 mg F/kg body weight per day in children up to 12 years of age.118 McClure’s estimate somehow came to be interpreted as the lower limit of the range of “optimal” F intake. A widely quoted 1974 report56 suggested that 0.06 mg F/kg body weight per day was optimal, although this estimate was based only on a number of personal opinions. The intake range of 0.05-0.07 mg F/kg body weight per day was suggested as optimal in 1980139; this is equivalent to 3.5-4.9 mg F/day for a 70-kg (154-lb) man. For a 10-kg infant (22 lb; i.e., a 12- to 18-month-old child), this optimal intake is equivalent to 0.45-0.64 mg F/day. (By comparison, in the Iowa studies described earlier, the 90th percentile of daily F ingestion for 16-month-old children was found to be 0.775 mg.)
The National Research Council, the body that establishes recommended dietary allowances for the United States, classified F as a “beneficial element for humans” because of its positive impact on dental health.134 The council at one time considered F an essential nutrient,133 but it backed away from that position because an essential role for F in human growth studies could not be confirmed and because the physiologic mechanism by which F would influence growth was unknown. Available evidence did not justify classifying F as an essential element by accepted standards.134 Nutritional requirements became recorded as dietary reference intakes in the late 1990s, with an “adequate intake” level for F set at 0.01 mg/day for children 0-6 months. For all ages above 6 months the adequate intake was set at 0.05 mg F/kg/day, so the absolute intake amount increases with increasing weight to a maximum for adults age 19 or older of 4 mg/day for males and 3 mg/day for females.85,86 It was not clear on what these intake levels were based.
The discussions about “optimal” intake are vague about what this intake is optimal for. The implication is that this degree of ingestion is optimal for caries resistance, but as will be described later in this chapter, ingested F plays only a minor role in caries control relative to intra-oral F. It is also worth noting that McClure’s 1943 comment was observational, although it somehow was turned into a recommendation over time. Empirical evidence suggests that F intake of 0.05-0.07 mg/F/kg/day in childhood is a broad upper limit if unesthetic fluorosis is to be avoided.20 There is no evidence to link this range of F ingestion with caries inhibition, so we suggest that the term optimal intake be dropped from common usage.
FLUORIDE AND HUMAN HEALTH
Early Studies
Quite a lot was known about F at the time of Dean’s appointment to the NIH Hygiene Unit in 1933,117 but details of a safe range of F intake for humans were sketchy. The first study relating bone fracture experience to the F concentration in home water supplies (a subject revisited in the 1990s) concluded that there was no relationship.119 McClure then demonstrated the close relationship between urinary F concentrations and the F levels of domestic water.121 His balance studies during World War II, in which young men lived in rooms maintained at varying temperatures and humidity levels and received varying amounts of F in food and water, led to the conclusion that the elimination of absorbed F via urine and perspiration is almost complete when the quantity absorbed does not exceed 4-5 mg daily.125 McClure suggested that this may be the limit of F that could be ingested without “appreciable hazard” of excessive F storage in the body.
Higher F intakes were likely in communities such as Bartlett, Texas, however, where community water carried about 8 ppm F. A long-term study of the residents of Bartlett, conducted by a U.S. Public Health Service team, began in 1943. Apart from severe dental fluorosis, the study found no adverse effects of long-term ingestion of this high-F water,105 although postmortem bone F concentrations were high. Numerous animal studies in the early years of water fluoridation104,109,116,122,124,186/>
Stay updated, free dental videos. Join our Telegram channel
VIDEdental - Online dental courses


