20 Dental Caries
Dental caries is an ancient disease, dating back to at least the time that agriculture replaced hunting and gathering as the principal source of food. Examination of skulls in Britain suggests that the moderate caries experience found in the Anglo-Saxon period (fifth to seventh centuries) had changed little by the end of the Middle Ages, approximately the year 1500.154,155 Dental attrition in this period was extensive and occurred early in life; some lesions in young persons seem to have begun in the occlusal fissures but developed no further because attrition progressed faster than caries. Most lesions found in human remains from this period were cervical or root caries; coronal caries was relatively uncommon. The modern pattern of caries in the high-income nations, with lesions beginning in fissured surfaces and developing later on proximal surfaces, was not evident in Britain until the sixteenth century.156
Dietary changes that began during the eighteenth century, principally increased refinement of foods and greater availability of sugar, are considered chiefly responsible for the development of the modern pattern of caries. Import duties on sugar in Britain were relaxed in 1845 and completely removed by 1875, a period during which the severity of caries greatly increased.51,119 By the end of the nineteenth century, dental caries was well established as an endemic disease of massive proportions in most developed countries.35
GLOBAL DISTRIBUTION OF CARIES
Although some of the historic patterns of high attrition, little coronal caries, and moderate prevalence of root caries could still be found in remote places in the twentieth century,184–186 they are fast disappearing as once-isolated populations become infected with cariogenic bacteria and increasingly adopt the cariogenic diets and lifestyles of the developed world.
For most of the twentieth century, caries was seen as a disease of the high-income countries, with low prevalence in poorer countries. The most obvious reason for this pattern is diet. The high level of consumption of refined carbohydrates in the wealthier countries led to selective proliferation of cariogenic bacteria.52 Poorer societies, on the other hand, survived by hunting and subsistence farming, both of which provided diets low in fermentable carbohydrates.
By the late twentieth century, there were signs of change in this traditional pattern. First, there was some evidence that caries experience in some low-income countries had risen sharply in the years after World War II (1939-45).151 However, this change was by no means universal, and caries incidence in many such countries, especially those in Africa, remains relatively low.12,50,144,158–160 The second change is the marked reduction in caries experience among children and young adults in high-income countries, a trend that first became evident in the late 1970s.35 This change, which has already had a marked impact on dental practice, will affect oral conditions among the whole population in due course as today’s younger cohorts progress through the life span.
The World Health Organization (WHO) maintains the Global Oral Health Data Bank, a collection of surveillance data from almost all countries in the world. The most extensive data set in the data bank is for DMFT values (number of decayed, missing, or filled permanent teeth) for 12-year-olds, a response to the global goal set by WHO in 1982 (see Chapter 5). Table 20-1 shows the trends in these values in 11 high-income countries over a recent period of some 10-20 years. In most of these countries the decline in caries levels has been substantial, even spectacular in some cases. It is not universal, however, because both Korea and Kuwait have seen a rise in DMFT scores. This could be because preventive measures have lagged behind growing affluence in these two countries, whereas preventive measures have become established, at least to some extent, in the other nine.
Table 20-1 Trends in dental caries experience, as measured by mean DMFT values in 12-year-old children, in 11 high-income countries* in the late twentieth century233
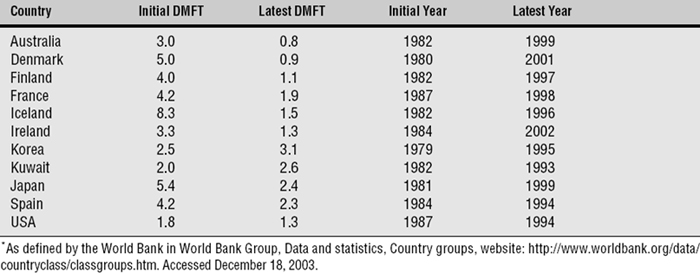
Table 20-2 shows the same trends for middle-income countries, those without the resources of the countries in the previous table, and here the pattern is different. Only Cuba, which has had a school dental service for years, and Estonia, where caries levels were very high, have shown a substantial drop in caries levels over the same 10-20 years. Of the others, four have shown a minor decline, and four have had an increase. These countries are arbitrarily chosen from many in WHO’s Global Oral Data Bank, but they do show a picture that is fairly representative—nations with better-developed public health prevention generally have shown most success in caries prevention. However, among countries of all income levels there are distinct differences in caries experience from one country to another, and from region to region within a country. Intercountry differences are illustrated by the results of the first International Collaborative Study (ICS I), promoted by WHO with funding and cooperation from the U.S. Public Health Service and the participating countries. These data were collected during the mid-1970s,9 and the mean DMFT values for children ages 13-14 in the first seven participating countries are shown in Fig. 20-1. These data were not from nationally representative population samples but rather from selected communities. The data for the United States, for instance, came from the metropolitan area of Baltimore, a city with fluoridated water since 1952. The areas chosen for examination in Australia (Sydney) and Canada (Ontario) also had had fluoridated water for some years.
Table 20-2 Trends in dental caries experience, as measured by mean DMFT values in 12-year-old children, in 11 lower-middle- and upper-middle-income countries* in the late twentieth century233
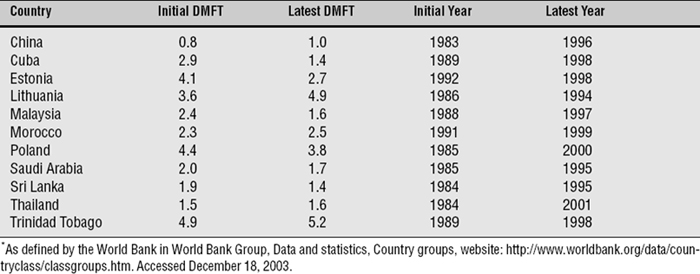
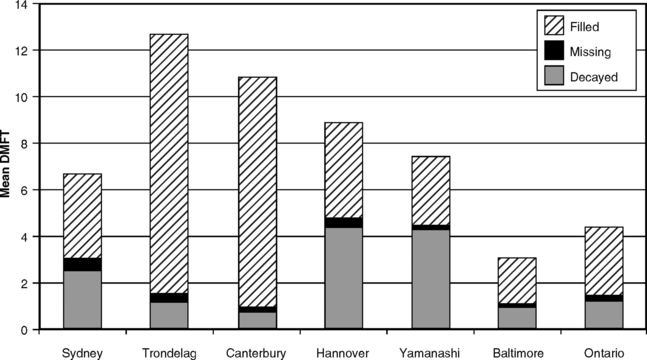
Fig. 20-1 Decayed, missing, and filled permanent teeth in children ages 13-14 in seven countries.
Data from the first International Collaborative Study, 1973-75.15,25,67
The data in Fig. 20-1 provide some food for thought regarding both caries treatment and its measurement. The two highest mean DMF values are found in Norway (Trøndelag) and New Zealand (Canterbury), both countries with extensive school dental services. The same two countries, it will be noticed, have the lowest mean D values, virtually no tooth loss, and by far the highest mean F values. As noted in the discussion of the DMF index in Chapter 15, data such as those in Fig. 20-1 reflect dental treatment as much as disease.
SECULAR VARIATIONS IN CARIES EXPERIENCE
When caries was more prevalent and severe than at present, affected teeth were attacked within 2-4 years after eruption. By the early 1980s, there were reports from local surveys to suggest that the average prevalence and severity of caries among children in the United States was declining from its previously high levels.34,72,87,200 Similar information from other high-income countries around the same time7,88,89,143,182 indicated that this reduction in caries experience was widespread.
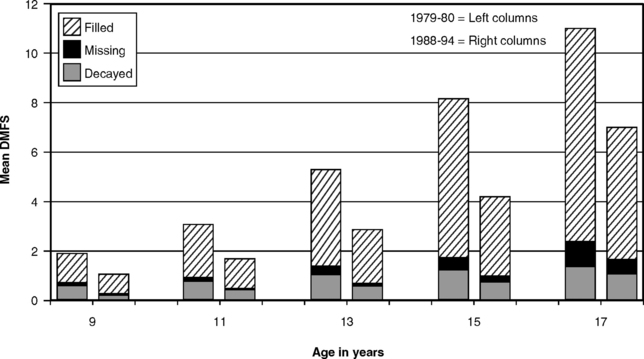
The decline in caries experience among children was confirmed for the United States by results of the National Dental Caries Prevalence Survey of U.S. schoolchildren in 1979-80.219 This survey showed that mean DMF scores among children ages 5 to17 years were some 32% lower than those found in the first National Health and Nutrition Examination Survey (NHANES I) of 1971-74.217 The next national survey of U.S. schoolchildren in 1986-87 found that the decline was continuing,221 with mean DMF scores for 5- to 17-year-olds again 36% lower than those from 7 years earlier, and further decline was seen in the third National Health and Nutrition Examination Survey (NHANES III) of 1988-94.213 Mean DMFS scores (number of decayed, missing, or filled permanent tooth surfaces) for schoolchildren ages 9-17 in 1979-80 and 1988-94 are shown in Fig. 20-2, and the reduction in caries experience is obvious. In the 1988-94 data there were few missing teeth, and the highest mean value for decayed surfaces was 1.14 for the 17-year-olds. The index bars for 1988-94 data in Fig. 20-2 are made up predominantly of the F component. The decline has also been documented in primary teeth: mean dfs scores (number of decayed or filled primary tooth surfaces) for 6-year-olds in the 1979-80 survey was 4.76;219 this was down to 3.73 in 1986-87.221
The seemingly sudden caries decline among children in high-income nations was documented at a conference in Boston in 1982, the proceedings of which were published in a special issue of the Journal of Dental Research in November 1982. The caries decline in the permanent dentition among children of high-income nations has continued since then,10,23,37,47,56,117,140,195,211 although caries experience in the primary dentition may have leveled out by the early 1990s.33,37,79,98,140,194,211 Although the downward trend in caries experience (permanent teeth) among American and Canadian children was continuing through the 1990s, the rate of decrease must get slower as overall caries experience approaches an irreducible minimum level. The main caries problem in the United States and some other countries today is not so much overall caries levels as the disparities in disease experience and treatment between different socioeconomic and racial- ethnic groups.
The reduction in caries has not occurred evenly for all kinds of tooth surfaces; it has been proportionately greater for free smooth surfaces and proximal surfaces than for pit- and-fissure surfaces.24,110,196 An unexpected outcome in a 3-year longitudinal study in Michigan in the early 1980s was that 81% of all new lesions were on pit- and-fissure surfaces. No lesions at all were found on free smooth surfaces.38
As caries prevalence falls, the least susceptible sites (proximal and smooth surfaces) reduce by the greatest proportion, while the most susceptible sites (occlusal) reduce by the smallest proportion.142
The net result is that, although the total number of new carious lesions has been declining, an increasing proportion of them is made up of pit- and-fissure lesions. This trend has enhanced the attractiveness of fissure sealants as a preventive measure (see Chapter 27).
History has many examples of diseases that have waxed and waned without precise knowledge of why, and the caries decline is one of these. No clear reasons for the caries decline have been identified, although most researchers view the various uses of fluoride as the main cause.30 Sugar consumption in the United States has increased (see Chapter 28) rather than diminished, and it is difficult to ascribe the decline to better oral hygiene or to changes in the bacterial ecology of the oral cavity, whereas an influential role for fluoride is hard to reject.36 Even the effect of widespread use of pediatric antibiotics on oral bacteria has been suggested as a contributory factor.128 However, as with other diseases that show a cyclical nature over time, it is quite likely that factors are operating that have not been identified.
UNEVEN DISTRIBUTION OF CARIES
For many years, the results of surveys and even research studies were presented only as mean DMF values, usually with only a standard deviation to indicate the distribution. Although means are useful, they compress extreme values (i.e., absence of caries and caries in many teeth in the same mouth) into an average figure that sometimes can be misleading. A landmark break from this convention came with the results of the National Preventive Dentistry Demonstration Program (NPDDP) in the mid-1980s. The NPDDP studied the effects of a series of preventive procedures in children in grades 1, 2, and 5 in five cities with and five cities without fluoridated water. The NPDDP drew attention to the fact that, although average caries experience in children was lower than the researchers had originally expected, there was still a significant minority with severe caries.74 This type of distribution is illustrated in Fig. 20-3, which provides data from the national surveys of schoolchildren in 1979-80 and 1988-94. Whereas Fig. 20-2 illustrates the decline in mean DMFS scores that occurred between the two surveys, Fig. 20-3 shows the distributional changes. It is evident that in the more recent survey the proportion of “caries-free” children (Box 20-1) had increased, whereas the proportion with severe caries had decreased. Even so, the shape of the distribution remained much the same: highly skewed toward zero or few DMFS teeth, but with a persistent “tail,” meaning that there were still children at the severe end of the scale.
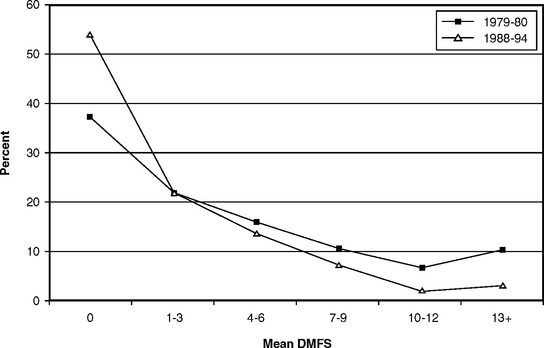
Fig. 20-3 Distribution of mean DMFS values in U.S. schoolchildren ages 5-17, 1979-80 and 1988-94.213
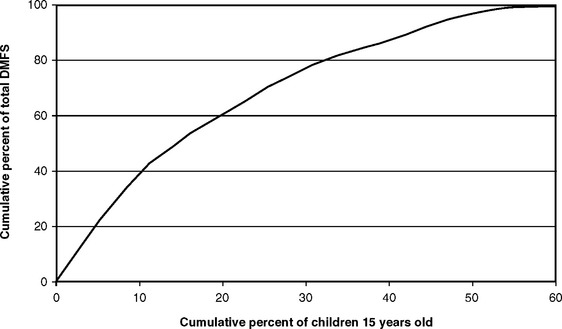
Fig. 20-4 is a cumulative frequency curve demonstrating that most caries occurs in a relatively small number of children. This figure is restricted to children of the same age (in this case, 15 years) so that the curve does not reflect age differences. When the values in Fig. 20-4 are read off, it can be seen that 60% of all affected teeth are found in about 20% of children, and three fourths of all affected teeth are found in about one fourth of the children. This concentration of disease in relatively few children has led to the concept of targeting public health prevention programs toward that highly affected minority, and it has stimulated research into methods of predicting which children are likely to be in the 20% or so that is most affected (see Chapter 14).
REGIONAL VARIATIONS IN CARIES DISTRIBUTION IN THE UNITED STATES
Regional variations in caries experience within the United States were first documented with the examination of young men in the armed forces during World War II.104,164,188,190 It is of interest to note that regional differences in caries prevalence among different tribes of Native Americans were demonstrated in the early 1930s,106 with more severe disease among tribes in the Northwest than among those in the Southwest. This regional pattern is still seen today in the general American population.
The World War II surveys were in general agreement that the most severe caries experience was seen in recruits from New England, the Pacific Northwest, and the Great Lakes area, with distinctly less caries in young men from the South, the Southwest, and the mountain states. In the years since World War II, some of these differences have been obscured by the spread of water fluoridation, but they were still apparent in the late 1960s.130 The regional differences in a representative sample of youths ages 12-17 years in a national survey conducted in 1966-70 are illustrated for whites and African-Americans in Fig. 20-5.
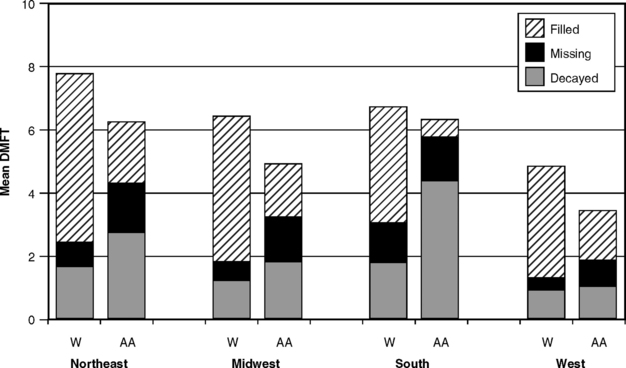
Fig. 20-5 Decayed, missing, and filled permanent teeth in white (W) and African-American (AA) children ages 12-17 in four geographic areas of the United States, 1966-70.216
Regional differences in caries experience are not unique to the United States, for just about every country exhibits similar variations. For example, in Britain, despite an overall decline in caries experience that parallels that seen in the United States, children’s oral health is still poorer in Scotland and northern England than in southern England.170,171
CARIES DISTRIBUTION: DEMOGRAPHIC RISK FACTORS
Age
Mean DMF scores increase with age, as shown in Fig. 20-2 for schoolchildren and Fig. 20-6 for adults. It can be seen that the increase with age for the children’s’ cohorts comes largely from an increase in numbers of restored teeth, whereas for the adults (see Fig. 20-6) most of the increase with age comes from missing teeth. Both figures are from cross-sectional data, so as younger cohorts replace today’s older people, the M component will decrease (see Chapter 19). With fewer restorations now also being placed in younger people,60 the overall DMF values in older people are also likely to decline with time. The impact of the caries decline naturally takes longer to become evident in adults than in children, because many of those who were adults when the data in Fig. 20-6 were collected had already experienced much of their caries activity before the modern age of prevention.
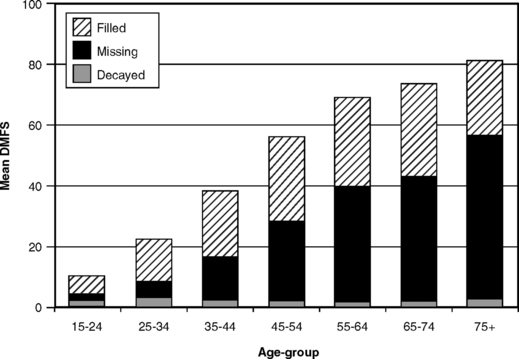
Caries used to be considered a childhood disease, a perception that arose in days of high caries severity when most susceptible surfaces were usually affected by adulthood. With younger people now reaching adulthood with many surfaces free of caries, the carious attack is spread out more throughout life. Adults of all ages can develop new coronal lesions,57,77 and caries has to be viewed as a lifetime disease. Even the disease distribution seen in youth—that is, the clustering of most disease in a relatively small number of people (see Fig. 20-4)—is seen in the elderly.145
In populations in which caries experience is severe, the disease starts early in life and is common in the young. A more even occurrence of new lesions throughout life is characteristic of communities with a lower attack rate.
Gender
Females have usually demonstrated higher DMF scores than do males of the same age,215,220,221 although this finding is not universal. When observed in children, the difference has been attributed to the earlier eruption of teeth in females,108,207 but this explanation is hard to support when the differences are seen in older age-groups. In those instances a treatment factor is more likely to be contributing to the differences. In national survey data, males usually have more untreated decayed surfaces than females, and females have more restored teeth. Females visit the dentist more frequently (see Chapter 2), so this observation is perhaps to be expected. In NHANES III, females ages 12-17 years had the same mean number of decayed and missing surfaces as their male counterparts but 25% more filled surfaces.98 We cannot conclude from these figures that females are more susceptible to caries than are males; a combination of earlier tooth eruption plus a treatment factor is a more likely explanation for the observed differences.
Race and Ethnicity
Long-held contentions that certain races enjoy a high degree of resistance to dental caries probably came with early observations that some non-European races, such as those in Africa and India, enjoyed a greater freedom from caries than did Europeans. Today, however, we accept that global variations in caries experience result more from environment than from inherent racial attributes. To illustrate that point, there is evidence that certain racial groups once thought to be resistant to caries quickly developed the disease when they migrated to areas with different cultural and dietary patterns.17,152,179 In the United States, most surveys before the 1970s found that whites had higher DMF scores than African-Americans, although the latter usually had more decayed teeth because of poorer access to care. The National Health Survey of 1960-62 showed that whites had higher DMF scores than did African-American adults of the same age-group, a difference that remained even when the groups were standardized for income and education.214 Fig. 20-5, showing regional differences in caries severity, also illustrates the differences in DMF status between whites and African-Americans in the 1960s. It can be seen in Fig. 20-5 that overall DMF scores are higher among whites, although big differences in dental treatment are obvious. This difference was still evident in NHANES I in 1971-74,217 although other studies from around that time were finding little difference in DMF scores between whites and African-Americans of the same age.13,85
By the time of NHANES III in 1988-94, however, there was little difference in total DMF scores between whites and African-Americans, although whites still had a higher filled component and lower scores for decayed and missing surfaces. Fig. 20-7 shows data for children ages 13, 15, and 17 for illustration. DMF values for Mexican-Americans were in the midrange, and those in the “Other” racial-ethnic category had the highest overall DMF scores of all. This turnaround could indicate improving access to care for African-Americans, although it most likely reflects socioeconomic differences: the caries decline, as previously noted, is sharpest in the higher socioeconomic groups. The summary of relative DMFT scores for 12- and 15-year-old white and African-American children in five national surveys given in Fig. 20-8 illustrates the relative changes down the years.
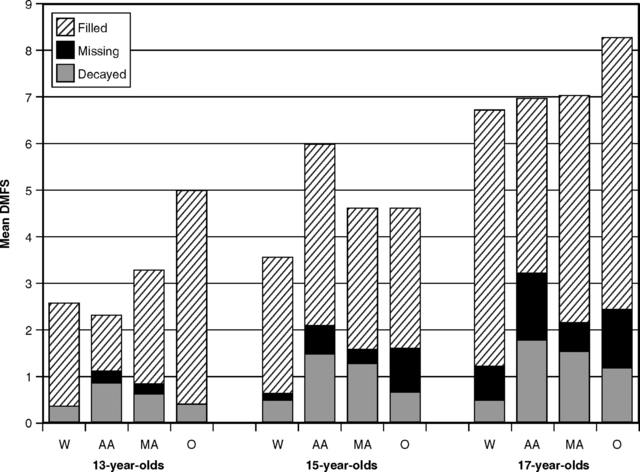
Fig. 20-7 Mean DMFS values for 13-, 15-, and 17-year-old children in white (W), African-American (AA), Mexican-American (MA), and other (O) racial and ethnic groups in the United States, 1988-94.213
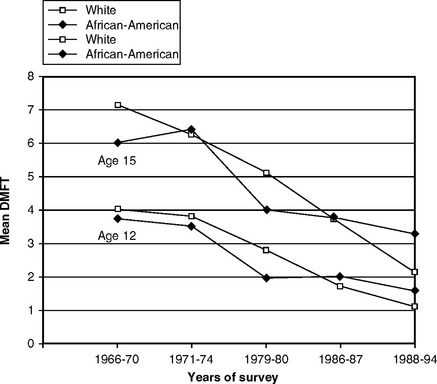
Fig. 20-8 Mean DMFT scores for 12- and 15-year-old white and African-American children in five national surveys in the United States, 1966-70 to 1988-94.213
The caries status of Hispanic Americans has not been as well studied, although valuable information came from the Hispanic Health and Nutrition Examination Survey (HHANES) of 1982-84. Data showed that DMF scores of Mexican-American adults were lower than the national average, but the D component was higher.90 Among children, a similar picture emerged in Mexican-Americans of the Southwest, Cuban communities of Miami, and Puerto Rican groups in New York.92
Socioeconomic Status
Socioeconomic status (SES), called social class in Britain, is a broad recording of an individual’s attitudes and values as measured by such factors as education, income, occupation, and place of residence. Attitudes toward health are often part of the set of values that follow from an individual’s prestige in society and may explain some of the observed differences in health between SES groups. However, obtaining a valid measure of SES is always a problem because of its complexity. In the United States SES is usually measured by annual income or years of education, despite acknowledged shortcomings in these measures.76
SES is inversely related to the incidence of many diseases and to characteristics thought to affect health.136 The reasons seem obvious in many cases, but not all.123 For example, differences in infant mortality by SES can be explained partly by the fact that higher SES women have better access to prenatal care, more ability to afford such care, the time to get it, probably less fatalistic attitudes, and perhaps some other factors.68 However, even after all these likely variables have been factored into explaining the differences, there is still a considerable gap that defies explanation. In dental health, a similar finding was reported in Finland,148 where differences in caries experience between children in the higher and lower social classes still remained after accounting for age, sex, reported frequency of toothbrushing, consumption of sugars, and ingestion of fluoride tablets. Children in Finland also have virtually equal access to publicly funded dental care, regardless of SES, which is not the case in the United States. Measurements used in science cannot always pick up all the subtleties embedded in SES.
As part of his landmark research in caries epidemiology during the 1930s and 1940s, Klein observed that overall DMF values did not differ between SES groups, but aspects of treatment certainly did.109 Lower SES groups had higher values for D and M, and lower values for F. In the first national survey of U.S. children in 1963-65, white children in the higher SES strata actually had higher DMF scores than did white children in the lower strata, but African-American children showed the opposite pattern.215 In both white and African-American children, the mean number of D teeth diminished with increasing SES, and the mean number of M teeth showed little change. In white children, however the F component ballooned so much with increasing SES that it lifted the whole DMF index. By contrast, the F component in the African-American children did not change, with the net result that DMF diminished with increasing SES. As mentioned earlier, these results from 1963-65 showed that a “treatment effect” (see Chapter 15) was artificially inflating the DMF data in the white children, whereas the values for the African-American children were likely to be a more valid measure of the carious attack.
With the lower overall caries experience of today, however, the position has been reversed. The NPDDP showed that the higher SES groups have enjoyed the sharpest decline in caries experience,74 so that the DMF values of children in the higher SES strata are now considerably below those of children in the lower SES strata. This is illustrated in Fig. 20-9, which graphs the components of the DMFS index for 15-year-old children in low, medium, and high SES groups as measured in NHANES III in 1988-94. Fig. 20-10 shows the same components for adults in three age-groups, and the same patterns can be seen relative to SES. Among the older adults, those in the higher SES groups had fewer missing and more filled surfaces. In the younger group, however, both total DMFS scores and the values of all of its components were lower in the higher SES groups. These data in Fig. 20-10 suggest that there may be a treatment effect in older age-groups that grew up before the preventive era, but among the 15- to 24-year-olds the higher SES groups clearly have lower caries experience.
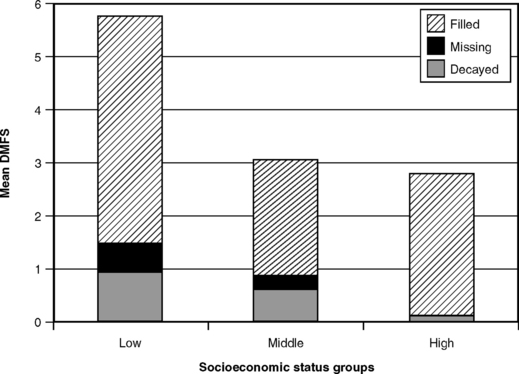
Fig. 20-9 Mean DMFS scores for 15-year-old children at three socioeconomic levels in the United States, 1988-94.213
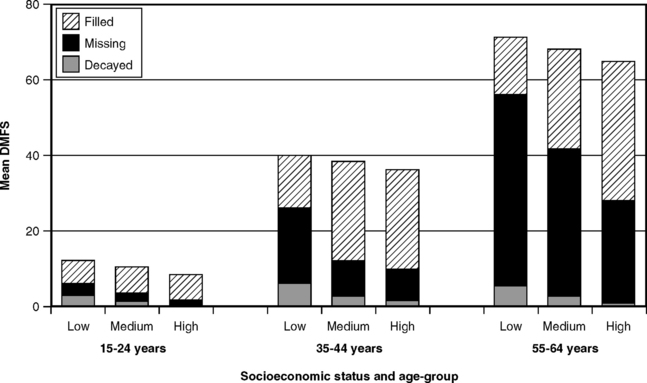
Fig. 20-10 Mean DMFS scores in adults ages 15-24 years, 35-44 years, and 55-64 years at three socioeconomic levels in the United States, 1988-94.213
Relationships between caries status and a broad range of SES measures (e.g., residence in private versus public housing, car ownership, quality of neighborhoods) have also been reported in Britain44-46, 73,166 and elsewhere in Europe.83,141 When measures of social status appropriate for a nonindustrialized society have been used, such patterns have also been observed in Africa.146 The British studies noted that, although fluoridation of water supplies (see Chapter 25) reduces the difference between the social classes, it does not entirely remove it.
These studies collectively demonstrate that dental caries today can be looked upon as a disease of poverty or deprivation. The greatest reductions in caries experience have been enjoyed by the upper social groups, whereas reductions in the lower social groups have been more modest. When treatment programs are planned, caries experience can be expected to be more extensive and severe among lower SES populations.
Familial and Genetic Patterns
Familial tendencies (“bad teeth run in families”) are noted by many dentists and have been clearly demonstrated.70,107,111,174 However, these studies do not pin down whether such tendencies have a genetic basis or whether they stem from bacterial transmission or continuing familial dietary or behavioral traits. Husband-wife similarities clearly have no genetic origin, and intrafamilial transmission of cariogenic flora, especially from mother to infant, is accepted as a primary way for cariogenic bacteria to become established in children.113,114,175 The lack of a genetic influence by race, discussed earlier, weakens the case for genetic inheritance of a susceptibility or resistance to caries, although Klein concluded that the similarities within families involved “strong familial vectors which very likely have a genetic basis, perhaps sex-linked.”105 Studies of identical twins have concluded that, although genetic factors could have affected caries experience to some extent, the influence of environmental variables was stronger.135
Stay updated, free dental videos. Join our Telegram channel
VIDEdental - Online dental courses


