Growth and Pubertal Development
Anders Juul, Sven Kreiborg, and Katharina M. Main
The evaluation of growth charts and pubertal development in children and adolescents is an important tool for any clinician in the assessment of health status. Optimal thriving and height attainment in accordance with family potential can only be achieved in an environment providing optimal socioeconomic conditions, health care, and psychosocial support. Thus, failure to thrive or to grow may be the first indication of an underlying problem that may need attention. In turn, treatment of children may need to consider the specific growth and developmental windows in order not to disturb this delicate balance.
Measurement of growth in different phases of life
The current concept of prenatal and postnatal growth suggests that there are distinct growth phases, which should be considered separately.
Prenatal growth
Prenatal growth is divided into three trimesters (by convention). The first trimester is characterized by organogenesis and tissue differentiation, whereas the second and third trimesters are characterized by rapid growth and maturation of the fetus. Fetal growth can be assessed by serial ultrasonography in the second and third trimesters. Abdominal circumference, head circumference, and femoral length of the fetus can be determined, and from these parameters fetal weight can be estimated using different algorithms [1]. The fetal weight estimate should be related to normative data. Some reference curves for fetal growth are based on children born prematurely [2], and hence such curves tend to underestimate normal fetal weights from healthy pregnancies. Alternatively, reference curves based on ultrasound studies of normal healthy infants exist [1] and should preferably be used. Based on the changes in fetal weight estimates over time, the fetus can be considered as having a normal fetal growth rate, or alternatively as experiencing intrauterine growth restriction (IUGR) [3]. Children born at term (gestational age 37–42 weeks) are considered mature. Children born before 37 weeks of gestation are premature, and children born after 42 weeks of gestation are postmature. At birth, weight and length can be measured and compared to normative data correcting for gestational age at birth. Based on these comparisons, a newborn child can be classified as either appropriate for gestational age (AGA), small for gestational age (SGA), or large for gestational age (LGA).
IUGR fetuses will often end up being SGA at birth, but not necessarily so. Thus, IUGR infants may end up lighter than their genetic potential but remain within normal ranges (i.e., AGA). Therefore, IUGR and SGA are not synonymous entities, although they are often referred to as such in the literature (Figure 2.1). Height velocity in utero is higher than at any time later in life, leading to an average birth length of 50–52 cm and birth weight of 3.5–3.6 kg after 37–42 weeks of gestation. It is therefore not surprising that growth disturbances during this phase may have long‐lasting effects on growth and health later in life. Whereas the first trimester is dominated by tissue differentiation and organ formation, the second and especially third trimesters show a rapid gain first in length and then in weight. Fetal and placental endocrinology is highly complex and hormones such as insulin, leptin, placental growth hormone, insulin‐like growth factor (IGF)‐2, and thyroid hormone are only some of the many growth factors involved in the regulation of fetal growth.
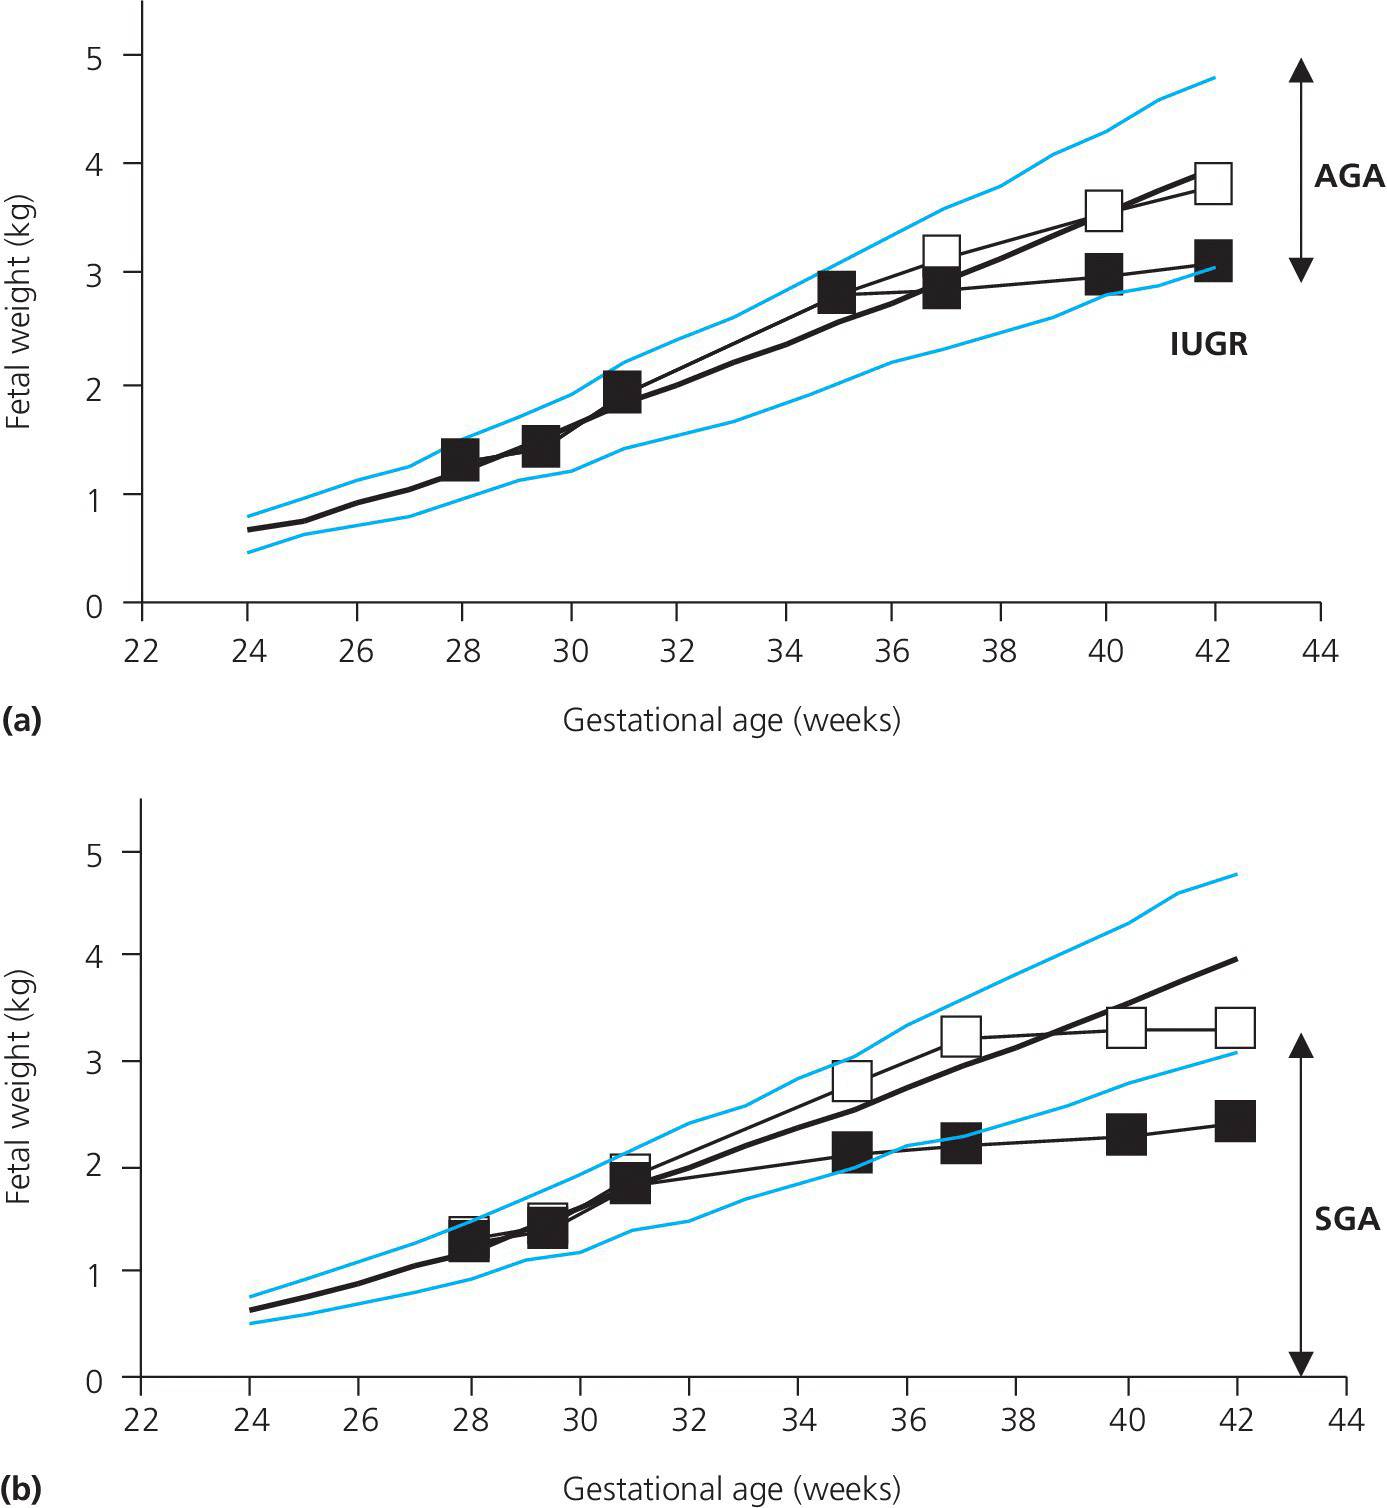
Figure 2.1 Reference ranges for fetal weight according to gestational age during pregnancy denoted by the blue lines (10th, 50th, and 90th percentiles) (8). Panel (a) shows examples of children with normal birth weights at term; a normally growing fetus ending with a birth weight which is appropriate for gestational age (AGA) and (▪) a fetus with third trimester intrauterine growth restriction (IUGR) ending with a birth weight below the genetic potential but within normal limits (AGA). Panel (b) shows examples of fetuses with intrauterine growth retardation (IUGR) ending up AGA (□) or SGA (▪).
Postnatal growth
Postnatally, height can be determined by measuring length in the supine position in the first 2–3 years of life. After 2–3 years of age standing height can be measured, preferably using a wall‐mounted stadiometer. Height is determined without shoes, shoulders towards the wall, arms hanging down, and the face straight forward (Figure 2.2). The eyes should be horizontally aligned with the external ear opening. The means of three measurements are recorded. The stadiometer should be calibrated on a daily basis.
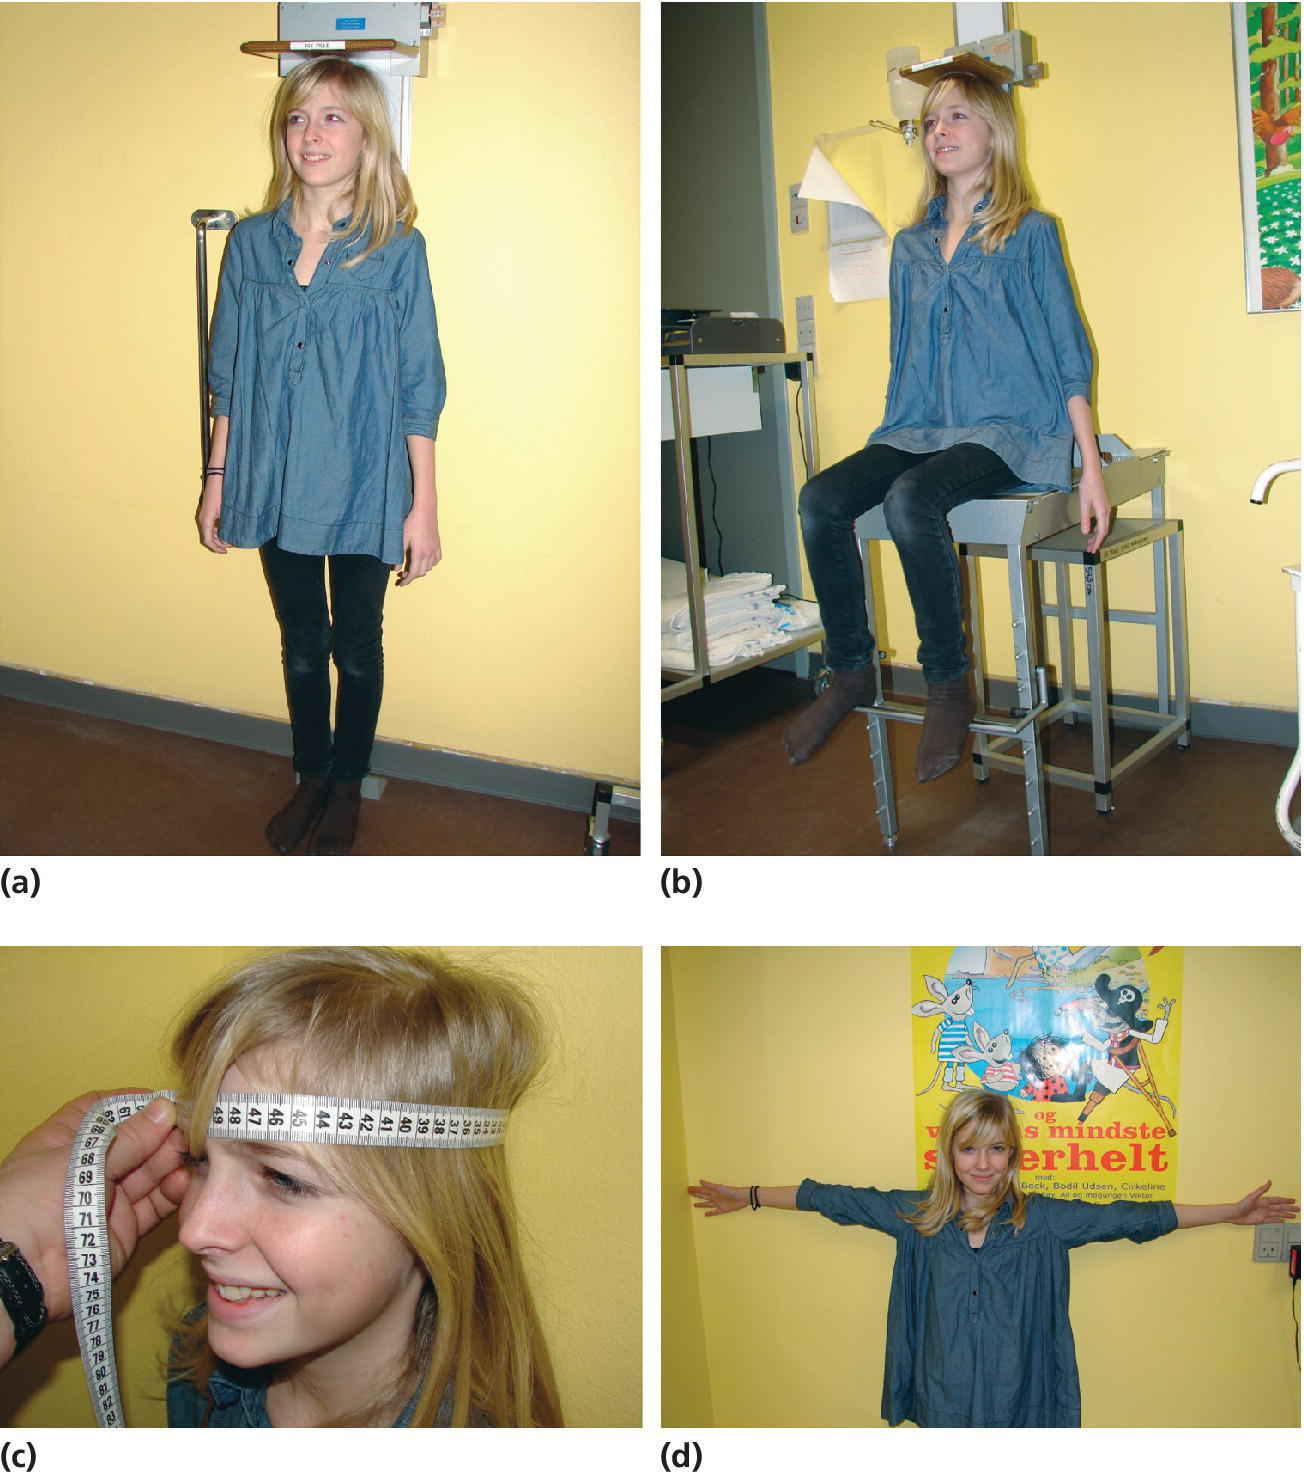
Figure 2.2 Standing height determined by a wall‐mounted stadiometer (a). Height is recorded as the mean of three measurements. Sitting height is determined by a specifically designed chair (b). Head circumference is determined using a measuring tape (c). Arm span is determined by measuring the distance from fingertips to fingertips (d).
Importantly, the body proportions (such as head circumference, facial appearance, sitting height, and arm span) may be helpful in the differential diagnosis of growth disorders (Figure 2.1). This can simply be done by assessing the sitting height with subsequent calculation of the sitting height to standing height ratio. This enables quantification of whether or not a growth failure is proportional or disproportional (such as in hypochondroplasia). Reference ranges for this ratio exist [4].
Changes in height can be separated into infant, childhood, and pubertal growth phases according to the infancy–childhood–puberty (ICP) model described by Karlberg [5]. The majority of children will follow the distinct growth patterns of these phases.
Infancy
After a brief initial weight loss of up to 10% of the birth weight, growth during the first months postnatally follows to a large extent fetal growth rate during the third trimester with 30 g/day and 3.5 cm/month. After that a rapid decline in growth rate occurs, in both weight and height. However, this period still represents a major growth phase during the lifetime with a three‐fold increase in weight over 6 months. Very little is known about the regulatory factors of growth during this period of life, but nutrition and living conditions play a major role. In 2006, the World Health Organization (WHO) published a new growth chart reference for infancy based on breastfed infants from different countries and ethnic origins living under optimal socioeconomic conditions. This chart did not find significant differences in growth patterns between these children, which indicates that genetic differences may first become evident later in life [6].
Childhood
In this phase growth is relatively constant, with a gradual decline in growth velocity over time. From 2 to 4 years children grow approximately 7 cm and 2 kg/year. Beyond 5–6 years of age this rate has decreased to approximately 5 cm/year. This growth phase is highly dependent on growth and thyroid hormones.
Puberty
During the pubertal growth spurt, which typically stretches over 4–5 years, total height gain is on average 20–25 cm for girls and 25–30 cm for boys with large interindividual variations. There is some tendency that early maturers obtain a higher peak height velocity compared to late maturers (Figure 2.3). Sex steroids increase the pulsatile growth hormone secretion, which in turn increases IGF‐1. Weight gain is highly individual and may occur both before and after peak height velocity.
Figure 2.3 (a) Three examples for height curves and (b) height velocity curves from children with early puberty (●), normally timed puberty (□) and delayed puberty (▲). Note that final height is almost the same (a) and that peak height velocity is higher in earlier puberty (b).
Final height has increased over the past century in developed countries due to major improvements of socioeconomic status and health care, a phenomenon which is now predominantly observed in developing countries. However, earlier onset of pubertal development and increased prevalence of childhood obesity has influenced the trajectory of childhood growth within the last one or two generations, and recently, new Danish reference charts for height, weight, and body mass index have been established [7].
In girls, the onset of the growth spurt is early and may even precede the development of secondary sexual characteristics in some. Typically, breast buds appear before pubic hair at 10–11 years of age, but occasionally this succession may be reversed [1]. Both breast development and pubic hair attainment are graded into five stages (B1–B5 and PH1–PH5) according to Tanner and Whitehouse [8]. The first menstruation, menarche, is a sign of adult‐level estradiol production and follicle maturation and occurs late during the growth spurt at approximately 13 years of age. Height attainment after menarche is small, with 4–8 cm over 1.5–2 years.
In boys, the pubertal growth spurt occurs relatively late during development. Puberty commences with enlargement of testis size from 3 to 4 mL at 11–12 years of age, and this very first sign of pubertal onset is usually not noticed by the boy or even less so by the parents. Pubertal development in boys is graded into five genital stages (G1–G5) according to Tanner and Whitehouse [8]. Testis growth continues and within 6–12 months pubic hair can be seen. Testicular volume can be determined by the use of an orchidometer to which the size of the testes is compared. Maximum height velocity often occurs at a testis size of 10–12 mL at around 14 years of age, at the time when the voice breaks and facial hair appearance occurs. Thus, boys are already relatively virilized at the time of the adolescent growth spurt [9]. In midpuberty, many boys develop physiological gynecomastia, which usually disappears within 6–12 months.
The onset of puberty is approximately a year earlier in girls than boys, which consequently results in earlier growth arrest in girls than boys (14–15 versus 16–17 years of age). The timing of puberty may also differ by 1–2 years according to ethnicity and nationality. Over the past couple of decades a decline in the age of onset of puberty has been observed in many countries [10,11] suggesting that environmental factors and modern lifestyle may affect maturation in addition to hereditary factors.
Growing pains
A significant number of children and adolescents intermittently experience pains, localized to the shins or legs when going to bed after a physically active day. The etiology of this phenomenon is unknown, but local warmth, gentle massage, and mild pain medication, if the child is in real discomfort, can normally ameliorate the problem, which resolves spontaneously.
Evaluation of growth charts
Growth evaluation should be based on observations over time by applying longitudinal measurements of height and weight on an age‐ and gender‐specific growth chart. These charts are available for many populations and also for a variety of growth disorders and syndromes. Due to the secular trend in height, country‐specific reference ranges should be constructed at regular intervals [12]. Repetitive measures of growth will result in a trajectory of growth, which then can be evaluated against family potential (parental stature, growth of siblings). As some children show considerable seasonal variation in growth, follow‐up periods of 6–12 months may be necessary. In children approaching puberty, pubertal staging [8] will additionally be necessary for adequate assessment.
Growth charts are usually based on cross‐sectional data from children and adolescents, covering 95% of the population (±2 standard deviations). Charts may depict centiles or standard deviation lines. Per definition, 2.5% of the population will be below or above the outer limits (Figure 2.4). In contrast, height velocity curves are based on longitudinal follow‐up studies of healthy children (Figure 2.5).
Figure 2.4 Normal (Gaussian) distribution of heights illustrating the 95% reference interval by percentiles or standard deviations (SDs).
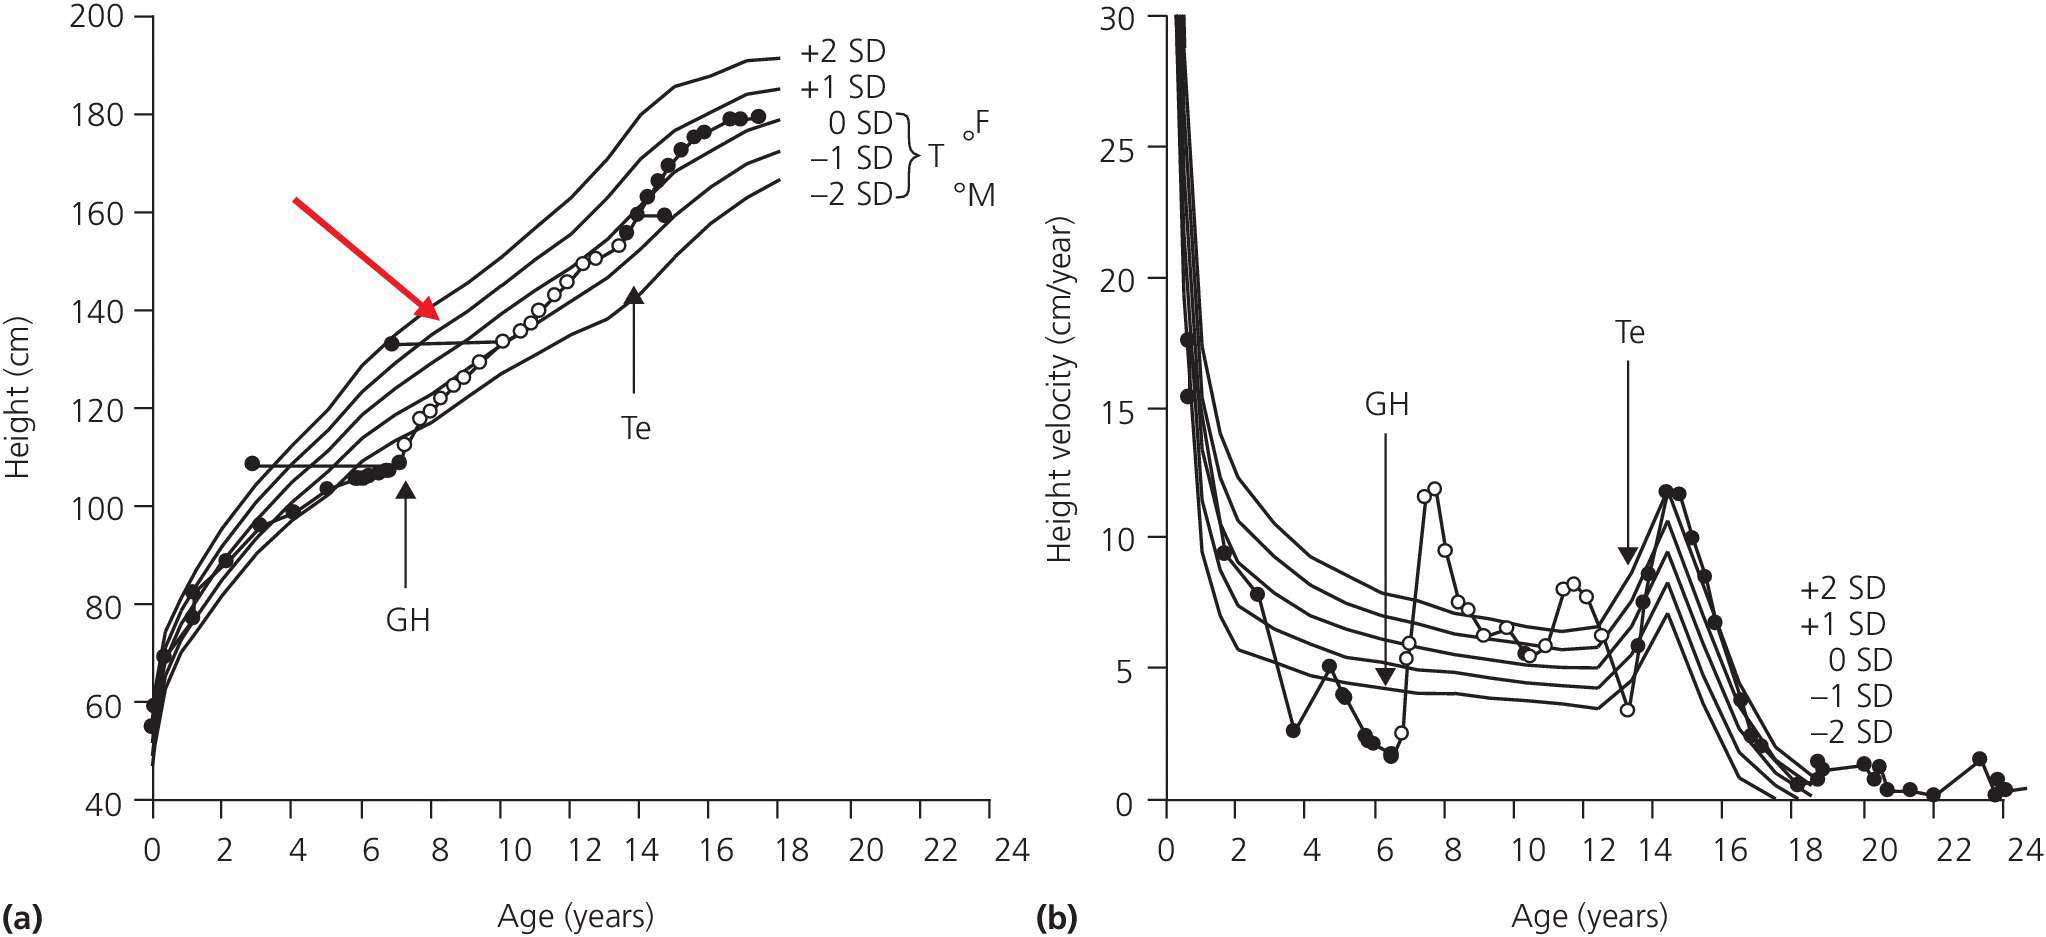
Figure 2.5 Normal height curve (a) based on healthy children. Lines denote mean ±1 standard deviation (SD) and ±2SD. One individual patient is depicted on the curve (●) before and after operation for a pituitary tumor (craniopharyngeoma) resulting in growth hormone deficiency. A typical deceleration is seen prior to diagnosis. Horizontal lines (red arrow) denote bone age. Following operation the child suffers from pituitary insufficiency and is substituted with L‐thyroxine, hydrocortisone growth hormone, (GH) (arrow), and testosterone (Te) (arrow). This results in a final height well within target height. T = target height range, F = father’s, and M = mother’s height expressed as SDs. (b) Normal height velocity curve based on Tanner’s longitudinal study of healthy children. The same child (●) is depicted on this curve illustrating the marked growth acceleration following GH therapy, as well as the acceleration when puberty is initiated.
In the evaluation, both the position within the growth chart in relation to the parental potential and the trend of the individual growth curve are important. Deviations from the expected may represent two separate pathologic conditions. In populations with a significant secular trend in height attainment due to recently improved socioeconomic conditions, the growth of siblings in comparison to the patient may be helpful as well. The simplest method to determine the family growth potential is based on calculation of midparental height (Box 2.1).
VIDEdental - Online dental courses


