Chapter 14
Diabetes Mellitus
Background and Definitions
Diabetes mellitus is a group of metabolic diseases characterized by high blood glucose levels (hyperglycemia) and the inability to produce and/or use insulin. The disease is defined by abnormal blood glucose levels and utilization and is classified by the American Diabetes Association into four general types (< ?xml:namespace prefix = "mbp" />

Box 14-1
Current Classification of Diabetes
Data from American Diabetes Association: Standards of Care—2011, Diabetes Care 34(Suppl 1):S11-S61, 2011.

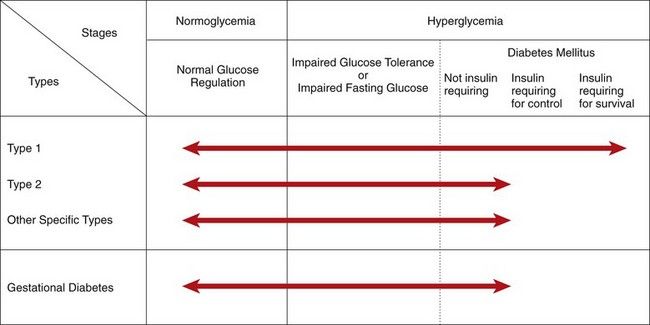
FIGURE 14-1 Disorders of glycemia: etiologic types, stages, and requirements for insulin. Range of glycemic control are indicated by arrows.
(From the American Diabetes Association: Diagnosis and classification of diabetes mellitus, Diabetes Care 34(Suppl 1):S62-69, 2011.)
Type 1 diabetes is primarily the result of pancreatic beta cell destruction and is characterized by insulin deficiency. Type 2 diabetes is characterized by insulin resistance and relative insulin deficiency. The broad category of other specific types (see
Diabetes affects persons of all ages and is a chronic condition. Persistent hyperglycemia leads to metabolic and vascular complications as well as a variety of clinical neuropathies that are costly to manage.
Diabetes mellitus is of great importance to dentists, because dentists are in a position as members of a health care team to detect many new cases of this disease. Also, dentists must be able to render care to patients already under medical management for their disease without endangering their well-being. A crucial aspect of care of the dental patient who has diabetes is determination of the level of disease severity and the level of glycemic control, as well as the presence of complications from diabetes, so that appropriate dental treatment can be provided. Essential to this determination is knowledge of the patient’s blood glucose level at the time that dental treatment is provided.
Incidence and Prevalence
More than 240 million persons worldwide have diabetes mellitus, and health officials estimate that this figure will exceed 300 million within the next 10 years.
Type 2 disease is the most prevalent type of diabetes mellitus. Of patients with diabetes in the United States, 90% to 95% have type 2 disease. The incidence of type 2 diabetes increases with age, and is primarily an adult disease. In contrast, type 1 diabetes occurs in 0.3% of Americans but is more than four times more prevalent than type 2 diabetes in persons younger than 20 years of age. Currently, there are about 23 million persons with type 2 disease (90%), 2.6 million with type 1 disease (10%), 79 million who have prediabetes, and approximately 12% of the general population in the United States who have impaired glucose tolerance. It is estimated that about 210,000 people younger than 20 years of age have diabetes (0.26% of all people in this age group). The vast majority of undiagnosed cases of diabetes are of the type 2 variety.
The prevalence of diabetes mellitus has increased more than six-fold in the United States over the past several decades. The major reason for the dramatic increase is the obesity epidemic—especially in relation to type 2 diabetes. Recent reports indicate that more than 60% of patients with type 2 diabetes are obese at the time of diagnosis, and more than two thirds of U.S. adults are overweight or obese. Obesity is a major factor in the continual rise in the number of cases of diabetes in the United States.
Etiology
Diabetes results from several pathogenic processes ranging from autoimmune destruction of pancreatic beta cells in type 1 diabetes to abnormalities that cause insulin resistance (type 2 diabetes). Type 1 diabetes is thought to be the result of genetic, autoimmune, and environmental factors. The genetic component is demonstrated by data showing concordance rates of 30% to 40% amongst identical twins. HLA genes on chromosome 6 are linked to type 1 diabetes. Autoantibodies against beta cell constituents are present in 85% to 90% of patients with type 1 diabetes, and destruction of beta cells is modulated by T cells. Viral infections (mumps, rubella, and coxsackievirus infection) are suggested environmental factors that could trigger the autoimmune response associated with type 1 disease. About 10% to 15% of cases of type 1 diabetes are of unknown etiology (i.e., idiopathic).
Type 2 diabetes has genetic, environmental, and aging components. Positive family history confers a lifetime risk of 38% to the offspring if one parent is affected, and 60% if both parents are affected.
Other specific types of diabetes can be caused by specific gene defects, endocrine conditions such as primary destruction of islet cells through inflammation, cancer, surgery, hyperpituitarism, or hyperthyroidism. Iatrogenic disease that occurs after steroid administration is a known cause.
Gestational diabetes mellitus occurs in 5% to 7% of pregnant women during pregnancy. Obesity during pregnancy is a known risk factor for the condition. After childbirth, the mother’s glycemic control usually returns to normal, but these women have an increased risk of developing diabetes within 5 to 10 years. Gestational diabetes enhances the risk for loss of the fetus and is associated with increased size of surviving fetuses. Insulin resistance is the suggested underlying etiopathogenic mechanism. A genetic basis may play a role; however, the underlying genetic factors have not yet been identified.
Pathophysiology and Complications
Persistent elevated blood glucose levels put persons at risk for diabetes. In fact, about 11% of people with prediabetes who were followed annually developed overt diabetes each year during the average 3 years of follow-up.
Glucose is rapidly taken up by the pancreatic beta cell and serves as the most important stimulus for insulin secretion. Insulin remains in circulation for only several minutes (half-life [t1/2], 4 to 8 minutes); it then interacts with target tissues (e.g., muscle, liver, fat cells) and binds with cell surface insulin receptors. Secondary intracellular messengers are activated and interact with cellular effector systems, including enzymes and glucose transport proteins. Lack of insulin or deficient action of insulin leads to abnormalities in carbohydrate, fat, and protein metabolism (i.e, increased production of glucose from glycogen, fat, and protein). This combination of underutilization and overproduction of glucose attained through glycogenolysis and fat metabolism results in glucose accumulation in the tissue fluids and in blood
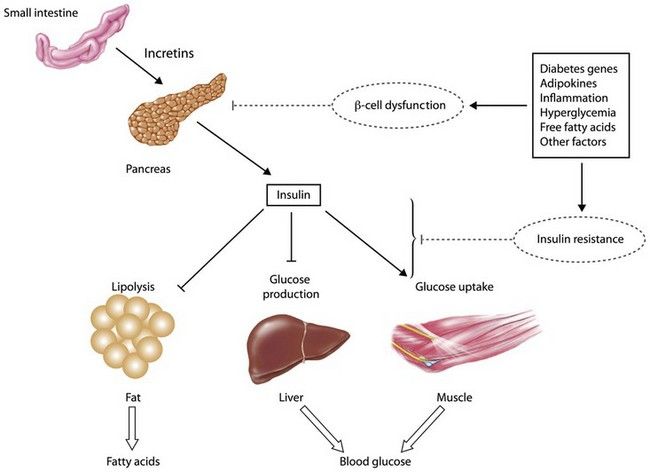
FIGURE 14-2 Pathophysiology of hyperglycemia and target tissues.
(Courtesy Mary Lous Cahal, University of Kentucky.)
Hyperglycemia leads to glucose excretion in the urine, which results in increased urinary volume. The increase in fluid lost through urine may lead to dehydration and loss of electrolytes. With type 2 diabetes, prolonged hyperglycemia can lead to significant losses of fluid in the urine. When this type of severe dehydration occurs, urinary output drops, and a hyperosmolar nonketotic coma may result. This condition is seen most often in elderly persons with type 2 diabetes.
Lack of glucose utilization by many cells of the body leads to cellular starvation. The patient often increases intake of food but in many cases still loses weight. If these events continue to progress, the person with type 1 diabetes develops metabolic acidosis. For a time, the body may be able to maintain the pH at nearly normal levels, but as the buffer system and respiratory and renal regulators fail to compensate, body fluids become more acidic (i.e., pH falls). Severe acidosis will lead to coma and death if it is not identified and treated. The primary manifestations of diabetes—hyperglycemia, ketoacidosis, and vascular wall disease—contribute to the inability of patients with uncontrolled diabetes to fight infection and to characteristic poor wound healing. The end results of these effects, as well as others yet to be identified, are that the patient with uncontrolled diabetes is rendered much more susceptible to infection, the patient’s ability to deal with an infection once it has been established is reduced, and healing of traumatic and surgical wounds is delayed.
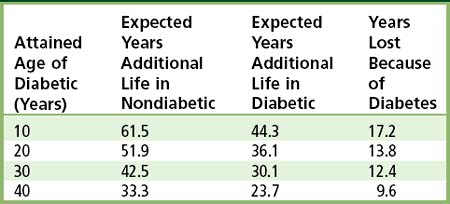
Patients with diabetes demonstrate significant effects of the disease on long-term survival, which is affected by the type of diabetes, age at diagnosis, and compliance with therapy (
TABLE 14-1 Expected Years of Additional Life in Persons with and without Diabetes Compared With Given-Age Cohorts
Complications of diabetes are related to the level of hyperglycemia and pathologic changes that occur within the vascular system and the peripheral nervous system (

Box 14-2
Complications of Diabetes Mellitus (DM)
Metabolic disturbances: ketoacidosis and hyperosmolar nonketotic coma (type 2 diabetes)
Cardiovascular: accelerated atherosclerosis (coronary heart disease
Eyes: retinopathy, cataracts; DM is leading cause of new cases of blindness among adults
Kidney: diabetic nephropathy; DM is leading cause of renal failure
Extremities: ulceration and gangrene of feet; DM is leading cause of non–accident-related leg and foot amputations
Diabetic neuropathy: dysphagia, gastric distention, diarrhea, impotence, muscle weakness or cramps, numbness, tingling, deep burning pain
Early death: DM is the seventh leading cause of death in the United States, most commonly due to cardiovascular disease
Data from Centers for Disease Control and Prevention. National diabetes fact sheet: national estimates and general information on diabetes and prediabetes in the United States, 2011. Atlanta, GA: U.S. Department of Health and Human Services, Centers for Disease Control and Prevention, 2011.

Retinopathy occurs in all forms of diabetes. It consists of nonproliferative changes (microaneurysms, retinal hemorrhages, retinal edema, and retinal exudates) and proliferative changes (neovascularization, glial proliferation, and vitreoretinal traction) and is the leading cause of blindness in the United States. The incidence of blindness in all persons with diabetes is 0.2% per year; it is 0.6% per year for diabetic patients with retinopathy. Proliferative retinopathy is most common among patients with type 1 diabetes; a much lower incidence is seen among those with type 2 diabetes. Cataracts occur at an earlier age and with greater frequency in those with type 1 diabetes. The typical cataract, senile cataract, is identified in 59% of persons with diabetes aged 35 to 55 years but in only 12% of those without the disease. Young people with diabetes are prone to the development of metabolic cataracts. The risk that a person with diabetes will become blind is 20 times greater than that for the general population.
Diabetics are 25 times more likely to acquire end-stage renal disease than persons without diabetes.
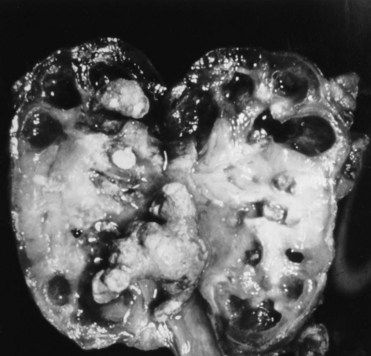
FIGURE 14-3 Diabetic nephropathy: cross section of kidney.
(Courtesy Richard Estensen, MD, Minneapolis, Minnesota.)
Macrovascular disease (atherosclerosis) occurs earlier and is more widespread and more severe in persons with diabetes. In patients with type 1 diabetes, atherosclerosis seems to develop independent of microvascular disease (microangiopathy). Hyperglycemia plays a role in the evolution of atherosclerotic plaques. Persons with uncontrolled diabetes have increased levels of low-density lipoprotein (LDL) cholesterol and reduced levels of high-density lipoprotein (HDL) cholesterol. Attainment of normal glycemia often improves the LDL-to-HDL ratio.
A major determinant of the morbidity associated with poor glycemic control in diabetes is accelerated atherosclerosis. Atherosclerosis increases the risks of ulceration and gangrene of the feet (
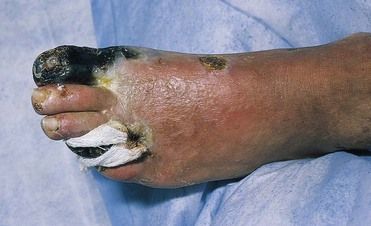
FIGURE 14-4 Diabetic gangrene of the feet.
(From Swartz MH: Textbook of physical diagnosis: history and examination, ed 6, Philadelphia, 2010, Saunders.)
In the extremities, diabetic neuropathy may lead to muscle weakness, muscle cramps, a deep burning pain, tingling sensations, and numbness. In addition, tendon reflexes, two-point discrimination, and position sense may be lost. Some cases of oral paresthesia and burning tongue are caused by this complication.
Diabetic neuropathy also may involve the autonomic nervous system. Esophageal dysfunction may cause dysphagia, stomach involvement may cause a loss of motility with massive gastric distention, and involvement of the small intestine may result in nocturnal diabetic diarrhea. Sexual impotence and bladder dysfunction also may occur. Diabetic neuropathy is common with type 1 and type 2 diabetes and may occur in more than 50% of patients. Neuropathy progresses over time in type 2 diabetes, and this increase may be greater in patients with hypoinsulinemia.
Diabetes is associated with skin rashes, deposits of fat in the skin (xanthoma diabeticorum), decubitus ulcerations, poor wound healing, and gangrenous extremities. The relative risk that patients with diabetes will require amputation of an extremity because of diabetic complications is more than 40 times that of normal persons. Recent data show that more than 65,000 amputations are performed annually in patients with diabetes mellitus. This number represents more than 60% of all nontraumatic amputations.
The severity of complications of diabetes is largely dependent on the level of glycemic control.
Clinical Presentation
Signs and Symptoms
In patients with type 1 diabetes, the onset of symptoms is sudden and acute, often developing over days or weeks. Typically the diagnosis is made in nonobese children or young adults less than 40 years of age; however it may occur at any age. Signs and symptoms include polydipsia, polyuria, polyphagia, weight loss, loss of strength, marked irritability, recurrence of bed wetting, drowsiness, malaise, and blurred vision. Patients also may present with ketoacidosis, which if severe is accompanied by vomiting, abdominal pain, nausea, tachypnea, paralysis, and loss of consciousness.
Type 2 diabetes generally occurs after age 40 and more often affects obese individuals. The onset of symptoms in type 2 diabetes usually is insidious, and the cardinal manifestations and symptoms (polydipsia, polyuria, polyphagia, weight loss, and loss of strength) are less commonly seen.
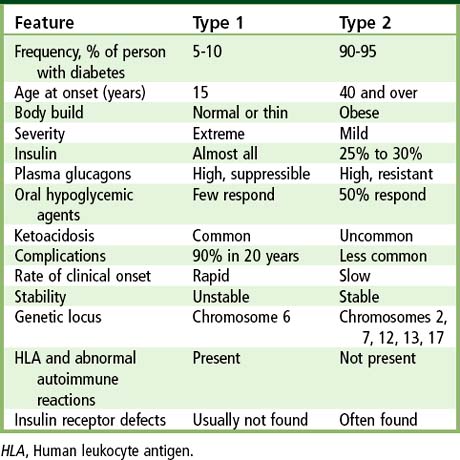
TABLE 14-2 Clinical Features of Type 1 and Type 2 Diabetes
| Feature | Type 1 | Type 2 |
|---|---|---|
| Frequency, % of person with diabetes | 5-10 | 90-95 |
| Age at onset (years) | 15 | 40 and over |
| Body build | Normal or thin | Obese |
| Severity | Extreme | Mild |
| Insulin | Almost all | 25% to 30% |
| Plasma glucagons | High, suppressible | High, resistant |
| Oral hypoglycemic agents | Few respond | 50% respond |
| Ketoacidosis | Common | Uncommon |
| Complications | 90% in 20 years | Less common |
| Rate of clinical onset | Rapid | Slow |
| Stability | Unstable | Stable |
| Genetic locus | Chromosome 6 | Chromosomes 2, 7, 12, 13, 17 |
| HLA and abnormal autoimmune reactions | Present | Not present |
| Insulin receptor defects | Usually not found | Often found |
HLA, Human leukocyte antigen.

Box 14-3 Early Clinical Manifestations of Diabetes
Type 2
• Cardinal signs/symptoms (much less common): polydipsia, polyuria, polyphagia, weight loss, loss of strength
• Frequent signs/symptoms: slight weight loss or gain, gastrointestinal upset, nausea, urination at night, vulvar pruritus, blurred vision, decreased vision, paresthesias, dry flushed skin, loss of sensation, impotence, postural hypotension

Other signs and symptoms related to the complications of diabetes include skin lesions, cataracts, blindness, hypertension, chest pain, and anemia. The rapid onset of myopia in an adult is highly suggestive of diabetes mellitus.
Laboratory Findings
The American Diabetes Association recommends screening tests for diabetes mellitus for all persons who are 45 years of age and older, and for persons with risk factors such as obesity, family history, belonging to an ethnic or minority group at risk for diabetes, the combination of low HDL cholesterol and high triglycerides, high blood pressure, or gestational diabetes, and for women who have delivered large babies (weighing more than 9 lb at birth) or who have had spontaneous abortions or stillbirths, or have signs and symptoms of diabetes or its complications. For persons older than age 45, screening should occur routinely at 3-year intervals. Most screenings for diabetes involve evaluation for undiagnosed type 2 diabetes.
The diagnostic criteria for diabetes relies on the plasma glucose level, either (1) at a random sampling, (2) after fasting, or (3) after a 75-g glucose test (oral glucose tolerance test, OGGT). Alternatively, the glycosylated hemoglobin test can be used. The American Diabetes Association criteria for diabetes are presented in
TABLE 14-3 Diagnostic Criteria for Diabetes Mellitus
|
1 FPG ≥126 mg/dL (7.0 mmol/L) on two occasions. Fasting is defined as no caloric intake for at least 8 hours. This fasting glucose value is consistently associated with the risk for retinopathy. 2 Symptoms and signs of diabetes plus casual (random) plasma glucose concentration ≥200 mg/dL (11.1 mmol/L). Casual is defined as obtained at any time of day without regard to time since last meal. Many patients do not have obvious symptoms. The cardinal manifestations of diabetes include polyuria, polydipsia, and unexplained weight loss. 3 2-hour postload glucose ≥200 mg/dL (11.1 mmol/L) during an OGTT. The test should be performed as described by the WHO, using a glucose load containing the equivalent of 75 g anhydrous glucose dissolved in water. |
FPG, Fasting plasma glucose; OGTT, Oral glucose tolerance test.; WHO, World Health Organization.
* Oral glucose tolerance testng generally is not recommended in clinical practice.
Data from Executive summary: standards of medical care in diabetes—2010: current criteria for the diagnosis of diabetes, Diabetes Care 33:S4-S10, 2010; Diagnosis and classification of diabetes mellitus, Diabetes Care 33(Suppl 1):S62-S69, 2010; International Expert Committee Report on the Role of the A1C Assay in the Diagnosis of Diabetes, Diabetes Care 32:1327-1334, 2009.
The primary diagnostic criterion for impaired fasting glucose is fasting plasma glucose levels of 100 to 125 mg/dL and for impaired glucose tolerance (IGT) is 140 to 199 mg/dL at 2 hours in the OGTT (
Blood Glucose Determination
Measurements of glucose are critical to the diagnosis and management of diabetes. Most glucose assays use enzymatic methods, based on either glucose dehydrogenase, glucose oxidase (coupled to ferricyanide) or glucose hexokinase. Of note, levels of blood glucose are influenced by the source of blood (venous versus capillary), the age of the patient, the nature of the diet, the physical activity level of the patient, and the method used to measure the amount of sugar present in the blood sample. Abnormalities in diet (e.g., diet poor in carbohydrate for several days) can lead to misdiagnoses. To minimize this possibility, the diet should contain at least 250 to 300 g of carbohydrate on each of the 3 days before testing. Patients whose blood glucose level is going to be assessed should not participate in excessive physical activity, because exercise tends to lower blood glucose levels.
Oral Glucose Tolerance Test
The OGTT reflects how quickly glucose is cleared from the blood—taking in consideration the rate of absorption, uptake by tissues, and excretion in urine. Glucose load is usually given as Glucola, which contains 75 g of glucose in a 7–fl oz bottle. Venous blood samples are drawn from the arm just before and most often at 2 hours after ingestion of the glucose. Urine samples also are collected at each interval. The most characteristic alterations seen in diabetes are an increased fasting blood glucose (126 mg/100 mL or higher), an increased peak value (200 mg/100 mL or higher), and a delayed return to normal in the 2-hour sample. Hypoglycemia may develop in persons with early, mild diabetes 3 to 5 hours after ingestion of glucose. For this reason, some physicians extend the glucose tolerance test period to 5 hours for some patients. Urine samples should not contain glucose at any point during the test.
Glycohemoglobin
The extent of glycosylation of hemoglobin A (a nonenzymatic addition of glucose) that results in formation of HbA1c (i.e., glycated hemoglobin) in red blood cells is used to detect and assess the long-term level (and control) of hyperglycemia in patients with diabetes (
TABLE 14-5 Goals for Risk Factor Management in Patients with Diabetes
| Risk Factor | Goal of Therapy | Recommending Body(ies) |
|---|---|---|
| Nutrition and obesity | Monitored carbohydrate intake; restrict alcohol, sodium, protein intake Weight loss to achieve ideal body weight |
ADA, AHA, and NHLBI’s ATP III, OEI, JNC VI, OEI (NHLBI) |
| Physical inactivity | Exercise prescription depending on patient’s status | ADA |
| Cigarette smoking | Complete cessation | ADA |
| Blood pressure | <130/85 mm Hg | JNC VI (NHLBI) |
| <130/80 mm Hg | ADA | |
| LDL cholesterol level | <100 mg/dL | ATP III (NHLBI), ADA |
| Triglyceride level 200-499 mg/dL | Non-HDL cholesterol level <130 mg/dL | ATP III (NHLBI) |
| HDL cholesterol level <40 mg/dL | Raise HDL (no set goal) | ATP III (NHLBI) |
Stay updated, free dental videos. Join our Telegram channel
VIDEdental - Online dental courses


