CHAPTER 12 Nutritional Considerations for the Pediatric Dental Patient
When the leading causes of death in the United States are tabulated (Table 12-1), the list is headed by heart disease and cancer, with stroke a distant third. However, when evaluating the underlying causes of these diseases, three major lifestyle factors can be identified: tobacco use, a sedentary lifestyle, and inappropriate dietary choices. It has become increasingly apparent that what we eat (and do not eat) is an important factor influencing both the quantity and quality of our lives. The basis of our dietary choices, and thus our nutritional status, is established early in life. It follows that food choices and dietary patterns initiated in childhood can affect our health and well-being at every stage of life. There are many ways in which health professionals can promote the health of their patients. One major way is to educate them regarding the importance of following sound nutritional principles. This chapter focuses on those nutritional factors that have the greatest potential to influence the systemic and oral health of the pediatric dental patient.
Table 12-1 Leading Causes of Death in the United States (Final 2005 Data)
| Cause | Number of Deaths |
|---|---|
| Heart disease | 652,091 |
| Cancer | 559,312 |
| Stroke | 143,579 |
| Chronic lower respiratory disease | 130,933 |
| Accidents | 117,809 |
| Diabetes | 75,119 |
| Alzheimer’s disease | 71,599 |
| Influenza/pneumonia | 63,001 |
| Nephritis, nephritic syndrome, and nephrosis | 43,901 |
| Septicemia | 34,136 |
From US Department of Health and Human Services, Centers for Disease Control and Prevention. Natl Vital Stat Rep 2008;56(10).
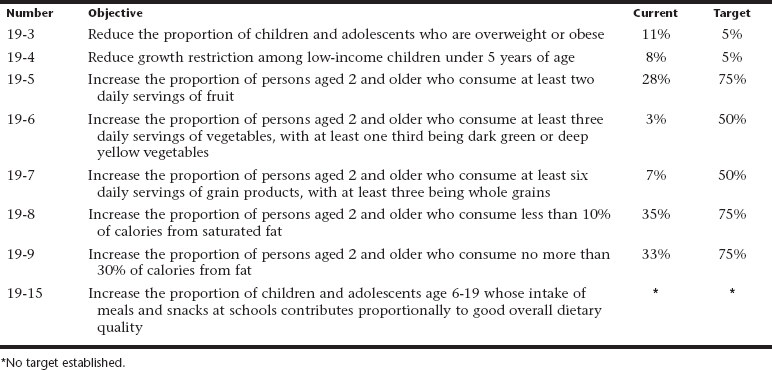
It was recognized several decades ago that our health is profoundly affected by our dietary choices; since then, an evolution has occurred in efforts to promote healthy food choices in the United States. In 1977, the Senate Select Committee on Nutrition and Human Needs first published the Dietary Goals for the United States. This was followed in 1979 by Healthy People: The Surgeon General’s Report on Health Promotion and Disease Prevention and in 1988 with The Surgeon General’s Report on Nutrition and Health. This latter document concluded that, of the 10 leading causes of death in the United States, half were related to poor dietary choices. In 1990, the U.S. Department of Health and Human Services released Healthy People 2000, which outlined goals, including those concerning nutrition, for increasing life span, reducing health disparities, and achieving better access to preventive services for all Americans over the following decade. In January 2000, Healthy People 2010 was released. Its overall nutritional focus is to promote health and to reduce chronic disease associated with diet and weight. Chapter 19 of this report discusses a number of these objectives, many of which are related to pediatric nutrition and are summarized in Table 12-2. The table includes both the initial target level for each objective and the progress made toward reaching each of these targets after a mid-decade review. Other nutrition-related objectives for children include reducing sodium consumption, increasing calcium intake, and reducing iron-deficiency anemia. The Midcourse Review noted that none of the objectives related to nutrition and overweight met or exceeded their targets. However, objectives concerning food security (19-18) and iron deficiency (19-12) made progress toward their targets. No significant progress was noted on some objectives, whereas others, such as prevalence of overweight and obesity among children and adolescents, actually moved further away from their targets.
The Healthy People 2020 document, which is intended to build on the objectives and goals set in Healthy People 2010, is currently being developed. The Healthy People 2020 objectives will be released in January 2010 along with guidance for achieving new 10-year targets that reflect assessments of major health risks, public health priorities, and emerging technologies affecting disease prevention and health preparedness in the United States.1
MYPYRAMID FOOD GUIDANCE SYSTEM
The MyPyramid Food Guidance System is a pictorial representation of the USDA’s Daily Food and Physical Activity recommendations. Released in 2005, MyPyramid replaced the nation’s previously well-known nutrition education tool, the Food Guide Pyramid (1992). In MyPyramid, daily physical activity is represented by the stairs on the left side of the pyramid. Food groups are represented by the vertical bands, which comprise the body of the pyramid. Bandwidth indicates portion size; the wider the band, the more foods from that group should be consumed. Examples of portions, or serving sizes, are further delineated for each food group. However, in most cases, the serving sizes used in MyPyramid are considerably smaller than the exaggerated portion sizes that many Americans have become accustomed to. In MyPyramid, foods are organized into five major groups and one miscellaneous category. The latter category includes fats, oils, and sweets, all of which should be consumed sparingly. An individualized nutrition plan based on personal factors such as age, gender, and physical activity, can be developed using the online tools, such as the MyPyramid Menu Planner and the MyPyramid Tracker (http://www.MyPyramid.gov). This website, which contains a host of useful nutrition information for the public and health professionals, also offers a number of food guidance pyramids for special populations, such as pregnant women, vegetarians, and children. The child-friendly version of MyPyramid, called MyPyramid for Kids, is designed to educate children ages 6 to 11 years old about nutrition and to assist them in making appropriate dietary choices (Fig. 12-1).

DIETARY PATTERNS
Myriad national surveys measuring nutritional status and dietary patterns of children and adolescents were conducted from the 1970s through the 1990s. These studies revealed some intriguing trends regarding caloric intake, beverage consumption, dining out, portion sizes, meal patterns and frequency, and school meal participation. Over the past quarter century, the total caloric intake of American children has increased and the dietary patterns of children are reflective of changes seen in the U.S. diet overall.2 In comparing food intake trends among children ages 6 to 11 years old, over approximately a 20-year period from 1977 through 1998, Enns and colleagues reported increases in consumption of soft drinks, grain products as a whole, grain mixtures (crackers, popcorn, pretzels, corn chips), fried potatoes, noncitrus juices and nectars, cheese, candy, and fruit drinks and ades.3 Decreases were noted in the intake of milk in general, and whole milk, various vegetables and legumes, beef, pork, and eggs. For any given pyramid group, less than one half of the children consumed the recommended number of servings, and their intakes of discretionary fat and added sugar were much higher than recommended.
Similar findings were reported by Cullen and colleagues, who evaluated the intake of soft drinks, fruitflavored beverages, and fruits and vegetables by children in grades 4 through 6.4 Lower parental education level was associated with higher consumption of soft drinks and sweetened beverages, and students who had a high consumption of sweetened beverages reported low fruit and high calorie intakes. Troiano and associates have also reported that beverages contribute 20% to 24% of energy intake among youth aged 2 to 19 years and that soft drinks provide 8% of energy intake among adolescents.5
However, recent studies have been inconsistent as to whether the increase in soft drinks and other sweetened beverages has increased obesity risk in children. For example, O’Connor and colleagues found no correlation between body mass index (BMI) of preschool children and their consumption of such beverages. They also found that, although nearly 83% of preschoolers consumed milk, consumption was at levels below recommended amounts. Only 8.3% of the children drank low-fat milk, which is recommended by Dietary Guidelines for Americans for children older than 2 years of age.6
Additional trends include an increase in eating out as well as expanded portion sizes in the U.S. marketplace. In examining the changes in dietary intake patterns between 1977 and 1996, Guthrie and colleagues reported that food prepared away from home increased from 18% to 32% of total calories consumed.7 Both meals and snacks prepared away from home contained more calories per eating event. Food eaten outside the home was also higher in both total and saturated fat on a percentage basis, and contained less dietary fiber, calcium, and iron per calorie. In 2001, Gillis and Bar-Or compared dietary patterns of obese and non-obese youth aged 4 to 16 years in relation to meals eaten away from home. They found a significant correlation between obesity and increased frequency of eating out.8 Further complicating the situation is that most marketplace portions of foods exceed standard serving sizes by at least a factor of 2 (e.g., bagels and sodas) and sometimes by a factor of 8 (e.g., cookies).9 Fast-food chains offer larger sizes of hamburgers, sodas, and French fries. The current serving sizes are often two to five times larger than the size originally marketed. These changes in dietary patterns parallel the progressive increase in obesity rates seen in the United States. Based on this information, eating away from home is associated with a compromised quality of nutritional intake and may increase risk for chronic diseases.
Meal patterns and meal frequency have also changed in the last few decades. Breakfast consumption, which has been shown to be important to cognition, school performance, and attendance, has declined significantly in U.S. children and adolescents. Although it is estimated that 10% to 30% of youth skip breakfast, of those who do consume breakfast, about equal numbers eat at home as at school.10,11 More youth are participating in school meals, such as the School Breakfast Program (SBP) and the National School Lunch Program (NSLP). In 2006, for example, more than 30 million youth in the United States participated in the NSLP daily. These federally funded programs evolved as efforts to assist children in low-income households.
Children from households with incomes at or below the poverty level are eligible for free meals; those with higher incomes may be eligible for reduced price meals.12 Because school meal programs can have a significant impact on children’s health, their ability to meet nutritional quality standards is important. As such, the Physicians Committee for Responsible Medicine (PCRM) evaluates meals served in the NSLP every year and documents changes, improvements, or the lack thereof in the foods offered by schools. They have found that compliance with established nutrition standards varies considerably among school districts countrywide. Many schools continue to offer less than healthful choices, such as hot dogs, cheeseburgers, and other foods high in fat and cholesterol. However, since the PCRM began issuing its “report card” style evaluations of school lunches in 2001, there has been a concerted effort at all levels to improve the nutritional quality of the meals provided by these programs. A 2007 study of NSLP participants in three high schools found that when the program promoted a broad selection of both healthy and less healthy choices, consumption of nutritious foods increased; however, consumption of foods with minimal nutritional value increased even more. The investigators concluded that the sale of less nutritious foods should be closely regulated.13
Cullen and colleagues examined the effect of the implementation of a public nutrition policy in Texas on the lunches of middle school children. Improvements in dietary intake after the policy change led investigators to conclude that statewide nutrition policy changes can have a positive impact on school lunch programs.14 Despite the quality issues surrounding the national school meal programs, the American Dietetic Association reported that children who participated in the School Breakfast Program had higher intakes of many vitamins and minerals compared to those who consumed breakfast at home or skip breakfast entirely.15,16
Meal frequency, primarily via snacking, has also increased significantly among U.S. children. Jahns and colleagues examined the prevalence of snacking from 1977 to 1996 in individuals 2 to 18 years of age. They found that snacking, which now accounts for a significant portion of total calories and macronutrients consumed relative to 30 years ago, increased amongst all age groups. Compared with that of regular meals, the nutritional content of snacks decreased in calcium and increased in energy density and fat calories.17 Sebastian and associates assessed the impact of snacking on nutrient intake and the ability to meet MyPyramid recommendations in a population of 12- to 19-year-olds. Results demonstrated that, as snacking frequency increased, total energy increased, primarily due to the amount of refined carbohydrates. One third of all oil was consumed in snacks; chips were a major contributor. Snacking improved intakes of vitamins C, A, and E, and increased fruit consumption, which improved the likelihood of meeting fruit recommendations. Less healthful outcomes were increased intakes of discretionary calories and added sugars, primarily via soft drinks, via fruit drinks and ades.18 Some snacks can be purchased at school, for example, from vending machines; these offerings usually contain little nutritional value and are highly cariogenic. The widespread use of vending contracts that permit the targeted marketing of soft drinks and other nonnutritious foods to children and teens has come under scrutiny in recent years by many health organizations, including the American Dental Association.
MALNUTRITION AND FOOD INSECURITY
It is estimated that more than 13 million children in the United States are living below the poverty level, and some estimates indicate that approximately 10% suffer to some degree from clinical malnutrition.19 Knol and colleagues evaluated the dietary patterns of low-income children 2 to 3 years of age and 4 to 8 years of age and found that the predominant eating patterns in both groups were not indicative of a balanced diet as described by national recommendations. Rather, the diets mimicked those of older adults with high intakes of added sugars and discretionary fats as a percentage of daily calories.20 Thus children of low socioeconomic status are at risk for the long-term consequences of malnutrition.
The concept of food security evolved in the 1990s to better define and measure access to foods by individuals and households. Food security implies the ready availability of adequate and safe foods, whereas food insecurity is having “limited or uncertain availability of nutritionally adequate and safe foods or limited or uncertain ability to acquire acceptable foods in socially acceptable ways.” Hunger refers to the “uneasy or painful sensation caused by lack of food.” Thus while food insecurity is a household level social and economic condition, hunger is an individual-level physiological condition that may be a consequence of food insecurity. Likewise, malnutrition is a potential, but not inevitable, result of food insecurity.21–23
The USDA reported that in 2006, 89.1% of U.S. households were food secure; however, 6.9 % of households reported low and 4% reported very low food security. Thus although nearly 11% of U.S. households are affected, this represents a decrease from the 16.1% of households reported to be food insecure in 2001.24 Prevalence of food insecurity was greater in metropolitan areas, southern and southwestern states, poor households, households with children headed by a single woman, and African-American and Hispanic households. In 2006, 35.5 million people, including 12.6 million children, lived in food-insecure households.25
Because food insecure households are eligible to receive assistance from federally funded programs such as the Food Stamp Program, research has been ongoing to understand the impact these programs have on food insecurity and nutrition. In addition, studies seek to clarify the relationships between food insecurity and nutritional status, health risks, and reduced quality of life, especially in children. Rose and Oliveira found that in adult women and older adults, food insecurity was associated with reduced intake of calories and nutrients; however, household food insufficiency was not significantly associated with low intakes among preschoolers.26 Likewise, a USDA Economic Research Service report noted that even in conditions of very low food insecurity, children are usually shielded from substantial reductions in food. It is believed that this occurs as a result of the adults sacrificing their own food intake for that of the children in the household.24 Nevertheless, research has linked food insecurity with increased developmental risk and poor health outcomes; however, an explanation for the so-called “obesity paradox” remains elusive.27,28 This phenomenon, which describes an association between hunger and obesity, was first proposed by Dietz in 1995.29 One hypothesis for this finding of some studies is that individuals overeat when food is available to compensate for times when food is scarce. The scientific literature is inconsistent in finding a clear association between food insecurity and overweight in children and adolescents.30–33 Clearly, more research is needed in this area to improve understanding of these relationships.
PEDIATRIC UNDERNUTRITION
Infants and young children whose weight curve has fallen 20% below the ideal weight for their height from a previously established growth rate are described as failure to thrive. Typically, in mild chronic undernutrition, weight loss with normal height and head circumference is observed. If the situation becomes chronic, growth will slow, and head circumference and height will be below age- and gender-related standards. Severe lack of caloric intake results in a wasting condition known as marasmus. Consumption of adequate calories without sufficient protein can produce kwashiorkor, a condition often characterized by the onset of infections and edema. There are numerous causes of pediatric undernutrition; however, the most common is inadequate dietary intake. Some cases may be secondary to poor socioeconomic status, lack of knowledge, perceived allergies/food intolerances, or neglect and abuse. Iron and zinc are two micronutrients commonly found to be at marginal levels in youth with poor nutrition. In addition, other nutrients such as vitamin D, calcium, and vitamin B12 are difficult to obtain at recommended levels in child and adolescent cases of undernutrition.34
IRON
As a component of blood hemoglobin and muscle myoglobin, iron fulfills its primary role in the body, which is to provide cells with a constant supply of oxygen. In addition, iron functions as cofactor for many enzymatic reactions in the body and is important to proper functioning of the immune system. Although the prevalence of iron deficiency has declined in recent years, it remains an important pediatric public health problem in the United States. Many of the adverse consequences of iron deficiency are associated with its most severe form, irondeficiency anemia.35–37 However, iron deficiency without anemia is associated with poor cognition and lower scholastic achievement in children and adolescents.38,39 Typically, the high iron needs for growth, when combined with a low dietary intake, produce a low iron status in children. Iron deficiency early in life appears related to behavioral problems in infants who score significantly lower on various tests measuring intellectual and motor functioning. It has long been recognized that toddlers and adolescent females are among the most susceptible groups.40 An assessment of iron deficiency prevalence in U.S. children 1 to 3 years of age during the period 1976-2002 showed no significant changes, with overall prevalence ranging from 8% to 10%. Iron deficiency prevalence decreased from 22% to 9% in toddlers in low-income households, but remained at 7% in toddlers from households above the poverty level. During this 26-year period, iron deficiency prevalence in African-American toddlers decreased from 16% to 6%, but remained unchanged in both Hispanic and white children at 13% and 6%, respectively.41 Prolonged bottle feeding of up to 48 months of age was positively correlated with increased prevalence of iron deficiency and may account for the higher prevalence seen in Hispanic toddlers.42
Compared with normal weight or underweight peers, iron deficiency prevalence was significantly higher in overweight toddlers.41 Similar findings have been reported in older children and adolescents. Possible explanations for the association between overweight and iron deficiency include high-calorie, low-iron diets, altered iron metabolism, genetic influences, and physical inactivity, which would lead to decreased myoglobin breakdown and therefore decreased blood iron. Also, overweight girls may grow faster and mature earlier than normal weight peers, making it more difficult to meet their iron requirements.43 To prevent iron deficiency, vulnerable populations should be encouraged to eat iron-rich foods and breast-feed or use iron-fortified formula for infants. Iron is found primarily in meat, poultry, and fish. However, other foods such as beans, lentils, fortified cereal grain products, and certain vegetables can also contribute to dietary intake of iron.
ZINC
Briefel and colleagues assessed zinc intakes from food and supplements in the U.S. population between 1988 and 1994 using National Health and Nutrition Examination Survey (NHANES III) data. Results indicated that in children younger than 10 years, boys and girls had similar zinc intakes, but in children older than age 10 years, boys’ intakes exceeded that of the girls. Eighty-one percent of 1- to 3-year-olds and 48% of 4- to 6-year-olds had inadequate zinc intake, defined as less than 77% of the 1989 Recommended Dietary Allowance. In addition, roughly 61% of adolescent girls had inadequate intake compared with 38% of adolescent boys.44
In a 2002 feeding study of infants and toddlers ages 4 to 24 months, vitamin and mineral intakes of children taking supplements were compared with intakes of children not consuming supplements. Investigators noted that excessive intake (i.e., above the Tolerable Upper Intake level) was found in both groups for several nutrients including zinc, leading them to conclude that healthy infants and toddlers can achieve the recommended intake levels from food alone.45 Similarly, Arsenault and Brown found that the zinc intake of U.S. preschool children increased appreciably from 1994 to 1998. In 1998, zinc intake exceeded the new Dietary Reference Intakes for zinc in 99% of children 5 years of age and younger. In this study, milk and fortified ready-to-eat breakfast cereals were the highest contributors of zinc for children aged 1 to 2 and 4 to 5 years, respectively.46 These studies suggest that, as a result of the new dietary recommendations for zinc, increases in the consumption of zinc-fortified foods, and supplement use, excess zinc intakes may be more commonplace than zinc inadequacy in the youngest populations of U.S. children. Further research is needed to monitor patterns of zinc intake in children and adolescents as well any adverse health effects produced by these changes.
CALCIUM
Achieving a high peak bone mass is the first line of defense against osteoporosis. Low calcium intake, particularly in combination with low levels of physical activity, may compromise the attainment of optimal peak bone mass. This is a particularly important consideration for adolescent girls, because almost half of the adult skeletal mass is formed during the second decade of life and calcium accumulation normally triples during the pubertal growth spurt.47 Unfortunately, this is the very age group that is at highest risk for low calcium intakes. Only 30% of adolescent girls reach 75% of the recommended daily allowance for calcium, and calcium intake appears to be declining among 6- to 11-year-olds.48 This problem may be alleviated by educating youth to select more calcium-rich foods (e.g., cheese, yogurt, fortified breakfast cereals, fortified orange juice concentrates) or to consider using calcium supplements. Calcium carbonate has a good absorption rate and has been characterized as a relatively inexpensive supplement containing a high percentage level of calcium.49 The concept that dental alveolar bone height loss is associated with osteoporosis is supported by research; therefore strategies for reducing osteoporosis risk also may help retard alveolar bone loss. Dental professionals can help improve both the oral and systemic health of their pediatric patients/>
Stay updated, free dental videos. Join our Telegram channel
VIDEdental - Online dental courses


