Structure of ceramics
Introduction
Ceramics are compounds of metallic elements and non-metallic substances such as oxides, nitrides and silicates. Ceramics can appear as either crystalline or amorphous solids, the latter group being called glasses.
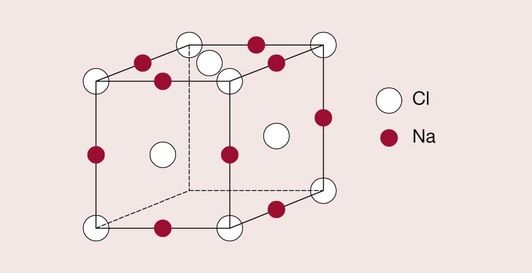
In ceramics, the negatively charged ions (anions) are often significantly different in size from the positively charged ions (cations). An example already considered is that of sodium chloride, which has a face-centred cubic structure.
The chlorine ions take up positions at the lattice points of the FCC arrangement, with the sodium ions adopting positions between the chlorine ions, in what are called interstitial positions. The sodium ions are able to do this because they are considerably smaller than the chlorine ions, and fit into the free space left between them. The exact lattice structure is shown in Figure 1.3.1. Another example of this type of structure is zinc oxide, which is widely used in dentistry. There are many other applications of ceramics in dentistry; they are used as fillers for composite resins, in glass–ionomer cements, and in investments and porcelains.
Ceramic raw materials
Silica (SiO2) forms the basis of many ceramics. Although it has a simple chemical formula, it is a versatile material and can exist in many different forms.
Silica occurs as a crystalline material in the forms of quartz, crystobalite and tridymite, or as a glass as in the example of fused silica. This ability of a compound such as silica to exist in different forms with distinctly different characteristics is known as polymorphism.
Silica is used as the basis for the formation of many complex ceramic formulations, particularly in combination with aluminium oxide with which it forms alumino-silicate glasses as used in glass–ionomer cements. Similarly, feldspathic glasses are used in ceramic restorations, and are compounds containing oxides of aluminium and silicon in combination with potassium, sodium or calcium (e.g. NaAlSi3O8).
Crystalline and amorphous ceramics
Crystal transitions
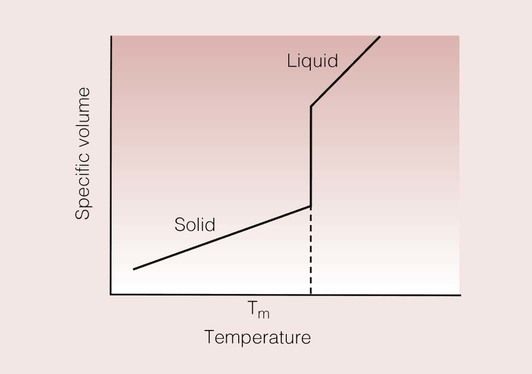
When a solid is heated, it can undergo a number of transformations, the most easily recognizable of which is when the solid melts. This change of a crystal from solid to liquid is known as the crystal melting transition, and is accompanied by a change in the volume of the material. The volume change can be monitored to allow such transformations to be detected.
A simple means of representing this change is to plot the specific volume of the material (i.e. the volume of a unit mass of the material) against the temperature. A curve such as that shown in Figure 1.3.2 results, and at the melting point of the crystal, there is a discrete (i.e. at a specific temperature) discontinuity in the specific volume.
The specific volume is effectively the inverse of the density. This specific volume–temperature curve shows that one effect of the melting of the crystal is an increase in the volume. This is not surprising when one thinks that this transition is one from an ordered crystalline structure to that of a disordered liquid; the packing density of the atoms in the liquid will be considerably less than that in the crystalline solid.
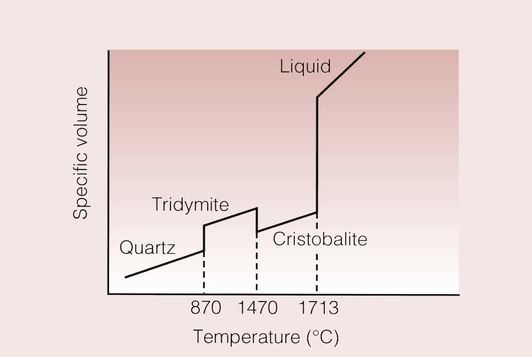
The specific volume–temperature curve for crystalline silica is as shown in Figure 1.3.3. In this example, there are a number of solid–solid transitions, as well as the usual transition from solid to liquid. Silica is in the form of quartz at room temperature, which changes into tridymite at 870°C. A further transformation takes place at 1471°C, where tridymite changes to crystobalite and the crystobalite finally melts at 1713°C. Thus, it is possible to detect both solid–solid and solid–liquid transitions in crystalline silica.
Stay updated, free dental videos. Join our Telegram channel

VIDEdental - Online dental courses


