Introduction
The objective of this study was to determine whether dental calcification can be used as a first-level diagnostic tool for assessment of skeletal maturity.
Methods
A total of 150 healthy subjects (79 boys, 71 girls; mean age, 12.19 ± 2.03 years; range, 8-16 years) were enrolled in the study. Dental maturity was assessed through the calcification stages from panoramic radiographs of the mandibular canine, the first and second premolars, and the second molar. Determination of skeletal maturity was according to the modified middle phalanx of third finger (MP3) stages method on digital radiographs.
Results
Diagnostic ability was evaluated according to the dental maturation stages for each tooth for identification of the MP3 stages and the growth phases (prepubertal, pubertal, postpubertal) using positive likelihood ratios. Dental maturation stage E of the first premolars and the combination of canine stage F, first premolar stage E, second premolar stage E, and second molar stage D (FEED) gave the highest values for identification of the prepubertal growth phase, and stage H of the second molar had the highest value for identification of the postpubertal growth phase.
Conclusions
Dental maturation assessment is only useful for diagnosis of the prepubertal and postpubertal growth phases.
Treatment timing has a significant role in the outcome of all dentofacial orthopedic treatments for dentoskeletal disharmonies in growing patients. Prior knowledge of the amount of growth remaining would be extremely useful for forecasting treatment outcome, taking advantage of growth when necessary and trying to minimize growth when undesirable. For growth modification to be successful, it is absolutely essential that it start at the right time. Optimal timing for treatment is different in various malocclusions. According to Bacetti et al, treatment protocols aimed to enhance or restrain maxillary growth take advantage of treatment performed before the adolescent growth spurt, whereas treatment regimens aimed to enhance or restrain mandibular growth produce greater effects when the pubertal growth spurt is included in the treatment interval.
The relationship between dental and skeletal maturity has been investigated. Tooth emergence as a marker of skeletal maturity has been shown to be poorly correlated with skeletal maturity. However, dental calcification stages detected through radiographic methods appear to be highly correlated to skeletal maturity.
Dental maturity assessment has the advantage of being a simple procedure that can be carried out on panoramic radiographs that are routinely used for various purposes and on intraoral radiographs that can be taken with minimal irradiation to the patient.
A high correlation coefficient does not provide information about whether the dental maturation stage is satisfactory for diagnostic identification of the skeletal maturation stage on an individual basis. Perinetti et al analyzed the diagnostic ability of the dental maturation phases for the skeletal maturation phases using the cervical vertebral maturation stages and concluded that although dental and skeletal maturity are highly correlated, their diagnostic ability is limited.
In a pediatric patient, the use of a thyroid collar is mandatory while taking cephalometric radiographs. However, Wiechmann et al and Sansare et al concluded that the thyroid collar masks landmarks mainly used for analysis of skeletal maturity. Madhu et al studied the correlation between the developmental stages of the middle phalanx of the third finger (MP3) as seen on an intraoral periapical radiograph and cervical vertebral stages, and they concluded that the MP3 can be used as the sole indicator for skeletal maturity.
Rajagopal and Kansal and Ozer et al correlated the cervical vertebral maturation stages with modified MP3 stages and concluded that the MP3 stages can be used to assess a subject’s skeletal maturation. Rajagopal and Kansal showed that recording the modified MP3 stages using periapical x-ray films can be an accurate, simple, practical, and economical growth indicator for making decisions on treatment planning.
Hence, the aim of this study was to determine whether dental calcification can be used as a first-level diagnostic tool for assessment of skeletal maturity with the MP3 stages.
Material and methods
This study has a cross sectional design. With a 95% confidence interval (CI) and 80% test power, a sample size of 150 was calculated. We enrolled 79 boys and 71 girls in the age group of 8 to 16 years (mean age, 12.19 ± 2.03 years). Informed consent was obtained from all the subjects, and the study protocol was approved by the ethical committee of Meenakshi Ammal Dental College, Chennai, Tamil Nadu, India. The subjects had no history of congenital, developmental, or hormonal disturbances that could affect their growth. They had no impacted teeth, transposed teeth, or history of trauma or injury to the face and hand and wrist regions.
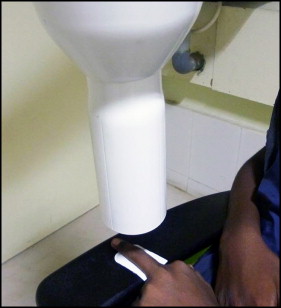
The subjects were scheduled for enrollment at their first clinical examination, when digital dental panoramic radiographs were taken. Digital radiographs of the MP3 region were taken using the procedure described by Abdel-Kader ( Fig 1 ).
Assessment of dental maturity was carried out through the calcification stages according to the method of Demirjian et al from the panoramic radiographs of the left mandibular posterior teeth. Briefly, these stages are defined as follows.
Stage D is when (1) crown formation is complete down to the cementoenamel junction; (2) the superior border of the pulp chamber in uniradicular teeth has a definite curved form and is concave toward the cervical region, and the projection of the pulp horns, if present, gives an outline shaped like the top of an umbrella; and (3) the beginning of root formation is seen in the form of a spicule.
Stage E is when (1) the walls of the pulp chamber form straight lines, the continuity of which is broken by the pulp horns, which are larger than in the previous stage; and (2) the root length is less than the crown height.
Stage F is when (1) the walls of the pulp chamber form a more or less isosceles triangle, with the apex ending in a funnel shape; and (2) the root length is equal to or greater than the crown height.
Stage G is when the walls of the root canal are parallel and its apical end is still partially open.
Stage H is when (1) the apical end of the root canal is completely closed, and (2) the periodontal membrane has a uniform width around the root and the apex.
A trained postgraduate dental student (S.M.), who was blinded to the skeletal maturation stages, assessed the dental maturity of the mandibular canine, the first and second premolars, and the second molars.
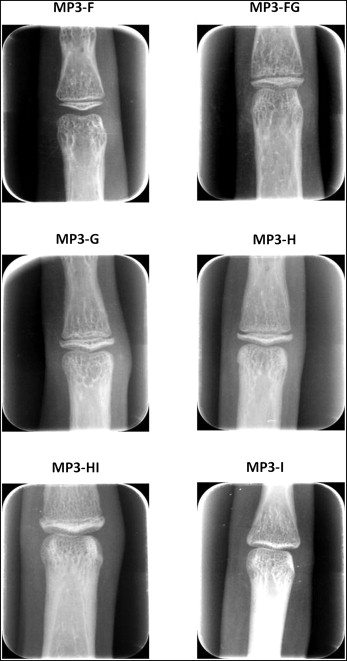
Assessment of skeletal maturity was carried out with the modified MP3 method described by Rajagopal and Kansal ( Fig 2 ) from the digital radiographs. This method comprises 6 stages, defined as follows.
- 1.
MP3-F stage is the start of the curve of pubertal growth spurt: the epiphysis is as wide as the metaphysis; the ends of the epiphysis are tapered and rounded; the metaphysis shows no undulation; and the radiolucent gap (representing the cartilaginous epiphyseal growth plate) between the epiphysis and the metaphysis is wide.
- 2.
MP3-FG stage is the acceleration of the curve of the pubertal growth spurt: the epiphysis is as wide as the metaphysis; a distinct medial and lateral border of the epiphysis forms a line of demarcation at a right angle to the distal border; the metaphysis begins to show a slight undulation; and the radiolucent gap between the metaphysis and the epiphysis is wide.
- 3.
MP3-G stage is the maximum point of the pubertal growth spurt: the sides of the epiphysis have thickened and cap its metaphysis, forming a sharp distal edge on at least 1 side; marked undulations in the metaphysis give it a “Cupid’s bow” appearance; and the radiolucent gap between the epiphysis and the metaphysis is moderate.
- 4.
MP3-H stage is the deceleration of the curve of the pubertal growth spurt: fusion of the epiphysis and the metaphysis begins; at least 1 side of the epiphysis forms an obtuse angle to the distal border; the epiphysis is beginning to narrow; a slight convexity is seen under the central part of the metaphysis; the typical “Cupid’s bow” appearance of the metaphysic is absent but a slight undulation is distinctly present; and the radiolucent gap between the epiphysis and the metaphysis is narrower.
- 5.
MP3-HI stage is the maturation of the curve of the pubertal growth spurt: the superior surface of the epiphysis has a smooth concavity; the metaphysis shows a smooth, convex surface, almost fitting into the reciprocal concavity of the epiphysis; there is no undulation in the metaphysis; and the radiolucent gap between the epiphysis and the metaphysis is insignificant.
- 6.
MP3-I stage is the end of the pubertal growth spurt: fusion of the epiphysis and the metaphysis is complete; there is no radiolucent gap between the metaphysis and the epiphysis; and a dense, radiopaque epiphyseal line forms an integral part of the proximal portion of the middle phalanx.
A trained postgraduate dental student (M.S.), who was blinded to the dental maturation stages, assessed the subjects’ skeletal maturity.
The postgraduate student was trained in the calibration process before the study. The student was given 10 radiographs for the first week; in the second, third, and fourth weeks, another 10 radiographs were given for staging each week. Then the student was given a week’s interval before staging the final set of 10 radiographs. A 90% agreement had to be achieved, meaning that at least 9 of 10 radiographs had to be staged correctly. This training was overseen by an experienced orthodontist (E.T.). If 90% agreement was not achieved, the cycle was repeated. Once the examiner was trained and after intraexaminer reliability was assessed, the study began.
Statistical analysis
For each tooth under investigation and within each dental maturation stage, the prevalence of the MP3 stages was calculated. To determine the degree of correlation between the 2 maturational indexes, the Spearman rank correlation coefficient was used. Moreover, to establish the diagnostic ability of each dental maturation stage and also its combinations to identify each MP3 stage, positive likelihood ratios were calculated (Greenhalgh ). These positive likelihood ratios provide estimates of how much a given dental maturation stage changes the odds of having a given MP3 stage. A threshold of a positive likelihood ratio of 10 or more (Deeks and Altman ) was considered for the assessment of satisfactory reliability of any dental maturation stage for the identification of an MP3 stage. Moreover, in these cases (positive likelihood ratios of 10 or more), only comprehensive diagnostic ability analyses were performed (Greenhalgh), which included sensitivities, specificities, and positive predictive values. These analyses were performed for the whole sample and for each sex separately.
The percentages of agreement and kappa statistics were calculated to evaluate intraexaminer agreement. For appraisal of the phases of dentition and the MP3 stages, the kappa coefficients ranged from 0.77 to 1.0, which are reliable.
SPSS software (version 15.0; SPSS, Chicago, Ill) was used for the statistical analyses. A P value less than 0.05 was used for rejection of the null hypothesis.
Results
The analysis carried out in each sex yielded similar results, and the data are therefore presented here as 1 sample (n = 150).
The distributions of the dental maturation stages according to the skeletal maturation phases are shown in Table I . The Spearman rank correlation coefficients for the dental maturation stages with the MP3 stages ranged from 0.802 to 0.765 for the canine and the second molar, respectively. The correlation coefficients for the dental maturation stages with the 3 growth phases were also similar and ranged from 0.761 to 0.703 for the canine and the second molar, respectively. All correlation coefficients were statistically significant, at P <0.001.
| Tooth | Dental maturation stage | n | Skeletal maturation stage (%) | Correlation coefficient | ||||||
|---|---|---|---|---|---|---|---|---|---|---|
| MP3-F | MP3-FG | MP3-G | MP3-H | MP3-HI | MP3-I | Across MP3 stages | Across growth phases | |||
| Canine | D | – | – | – | – | – | – | – | 0.802 ∗ | 0.761 ∗ |
| E | 3 | 100.0 | – | – | – | – | – | |||
| F | 22 | 77.3 | 22.7 | – | – | – | – | |||
| G | 48 | 8.3 | 50 | 31.3 | 10.4 | – | – | |||
| H | 77 | – | 7.8 | 16.8 | 28.6 | 7.8 | 39 | |||
| First premolar | D | 3 | 100 | – | – | – | – | – | 0.769 ∗ | 0.737 ∗ |
| E | 13 | 92.3 | 7.7 | – | – | – | – | |||
| F | 34 | 20.6 | 52.9 | 20.6 | 5.9 | – | – | |||
| G | 42 | 4.8 | 35.7 | 23.8 | 21.4 | – | 14.3 | |||
| H | 58 | – | 1.7 | 19 | 27.6 | 10.3 | 41.4 | |||
| Second premolar | D | 8 | 100 | – | – | – | – | – | 0.772 ∗ | 0.719 ∗ |
| E | 19 | 57.9 | 42.1 | – | – | – | – | |||
| F | 26 | 15.4 | 53.8 | 23.1 | 7.7 | – | – | |||
| G | 50 | 2 | 24 | 24 | 34 | – | 16 | |||
| H | 47 | – | 2.1 | 21.3 | 17 | 12.8 | 46.8 | |||
| Second molar | D | 20 | 75 | 25 | – | – | – | – | 0.765 ∗ | 0.703 ∗ |
| E | 36 | 22.2 | 44.4 | 22.2 | 8.3 | – | 2.9 | |||
| F | 20 | – | 30 | 40 | 30 | – | – | |||
| G | 58 | 1.7 | 13.8 | 20.7 | 29.3 | 6.9 | 27.6 | |||
| H | 16 | – | – | – | 6.3 | 12.5 | 81.2 | |||
The positive likelihood ratios for each dental maturation stage for the identification of each MP3 stage are shown in Table II , and the different combinations to assess each MP3 stage are shown in Table III . Most of these positive likelihood ratios were less than 3, with values greater than 10 seen only for the identification of MP3-F for the canine (stage F, positive likelihood ratio of 17.9) and the second molar (stage D, positive likelihood ratio of 15.8). The highest positive likelihood ratios was for the first premolar (63, stage E), again for the identification of MP3-F. Second molar stage H showed a positive likelihood ratio of 17.3 for the MP3-I stage. However, when using combinations of stages ( Table III ) for the identification of the MP3-F stage, a likelihood ratio of 31.5 was seen with the combination of canine stage F, first premolar stage E, second premolar stage E, and second molar stage D (FEED); for the MP3-FG stage, a likelihood ratio of 9.9 was seen with the combination of canine stage G, first premolar stage G, second premolar stage F, and second molar stage E (GGFE); for stage MP3-H, a likelihood ratio of 10.6 was seen with the combination of canine stage H, first premolar stage H, second premolar stage G, and second molar stage G (HHGG); and for MP3-I stage, the combination of stage H for all 4 teeth (HHHH) showed a likelihood ratio of 17.3.
| Tooth | Dental maturation stage | Skeletal maturation stage positive LHR | |||||
|---|---|---|---|---|---|---|---|
| MP3-F | MP3-FG | MP3-G | MP3-H | MP3-HI | MP3-I | ||
| Canine | D | – | – | – | – | – | – |
| E | – | – | – | – | – | – | |
| F | 17.9 ∗ | 1.0 | – | – | – | – | |
| G | 0.5 | 3.3 | 2.0 | 0.5 | – | – | |
| H | – | 0.3 | 0.9 | 1.8 | 2 | 2.6 | |
| First premolar | D | – | – | – | – | – | – |
| E | 63.0 ∗ | 0.3 | 0 | – | – | – | |
| F | 1.4 | 3.7 | 1.1 | 0.3 | – | – | |
| G | 0.3 | 1.8 | 1.4 | 1.2 | – | 0.7 | |
| H | – | 0.1 | 1.0 | 1.7 | 2.8 | 2.8 | |
| Second premolar | D | – | – | – | – | – | – |
| E | 7.2 | 2.4 | – | – | – | – | |
| F | 1.0 | 3.8 | 1.3 | 0.4 | – | – | |
| G | 0.1 | 1.0 | 1.4 | 2.3 | – | 0.8 | |
| H | – | 0.1 | 1.2 | 0.9 | 3.5 | 3.5 | |
| Second molar | D | 15.8 ∗ | 1.1 | – | – | – | – |
| E | 1.5 | 2.6 | 1.2 | 0.4 | – | 0.1 | |
| F | – | 1.4 | 2.9 | 2.0 | – | – | |
| G | 0.1 | 0.5 | 1.1 | 1.9 | 1.8 | 1.5 | |
| H | – | – | – | 0.3 | 3.4 | 17.3 ∗ | |
Stay updated, free dental videos. Join our Telegram channel
VIDEdental - Online dental courses


