Introduction
The aim of this study was to assess the influence of curing time and power on the degree of conversion and surface microhardness of 3 orthodontic composites.
Methods
One hundred eighty discs, 6 mm in diameter, were divided into 3 groups of 60 samples according to the composite used—Transbond XT (3M Unitek, Monrovia, Calif), Opal Bond MV (Ultradent, South Jordan, Utah), and Transbond Plus Color Change (3M Unitek)— and each group was further divided into 3 subgroups (n = 20). Five samples were used to measure conversion, and 15 were used to measure microhardness. A light-emitting diode curing unit with multiwavelength emission of broad light was used for curing at 3 power levels (530, 760, and 1520 mW) and 3 times (8.5, 6, and 3 seconds), always totaling 4.56 joules. Five specimens from each subgroup were ground and mixed with potassium bromide to produce 8-mm tablets to be compared with 5 others made similarly with the respective noncured composite. These were placed into a spectrometer, and software was used for analysis. A microhardness tester was used to take Knoop hardness (KHN) measurements in 15 discs of each subgroup. The data were analyzed with 2 analysis of variance tests at 2 levels.
Results
Differences were found in the conversion degree of the composites cured at different times and powers ( P <0.01). The composites showed similar degrees of conversion when light cured at 8.5 seconds (80.7%) and 6 seconds (79.0%), but not at 3 seconds (75.0%). The conversion degrees of the composites were different, with group 3 (87.2%) higher than group 2 (83.5%), which was higher than group 1 (64.0%). Differences in microhardness were also found ( P <0.01), with lower microhardness at 8.5 seconds (35.2 KHN), but no difference was observed between 6 seconds (41.6 KHN) and 3 seconds (42.8 KHN). Group 3 had the highest surface microhardness (35.9 KHN) compared with group 2 (33.7 KHN) and group 1 (30.0 KHN).
Conclusions
Curing time can be reduced up to 6 seconds by increasing the power, with a slight decrease in the degree of conversion at 3 seconds; the decrease has a positive effect on the surface microhardness.
The light-curing process of orthodontic composites begins when the initiators in the formula absorb the energy emitted by a light source. These initiators are chemical substances that react with the double bonds between the carbons in the monomers, converting them into polymers during the light-curing process of the composites.
The degree of conversion of a composite determines the amount of carbon double bonds, present in the monomers, broken during the conversion process into polymers, a process called polymerization. Since it is established that the total amount of energy produced by a light source (from the light’s source power and irradiation time) is related to the degree of conversion, product manufacturers have developed high-power light sources to reduce the irradiation time. This seemed to be advantageous, since the bonding procedures would require less chair time. However, the relationship between irradiation time and light source power on the physical and chemical properties of composites is not well established, because there is also some controversy in the literature. Although it had been demonstrated that a higher degree of conversion can be achieved with a shorter curing time and a higher power, some studies have shown that reduction of the curing time does not increase the conversion degree when shorter curing times and higher powers are used. Such a discrepancy occurs because most studies have compared different light sources and different levels of energy, confusing the results.
Another overlooked aspect regarding orthodontic composites is their surface microhardness. Because these composites remain in the oral cavity for a long time, they should possess good adhesiveness. It has been established that there is a positive correlation between hardness and mechanical resistance to inorganic load content, and composites with a high level of inorganic load seem to provide greater bond strength. Therefore, high surface hardness could be a secondary indicator of high inorganic load content and bond strength.
Each composite, on the other hand, responds differently to the light-curing process, even when the same energy is used from different combinations of irradiation time and power. Since this happens because of different chemical compositions, which could influence the initial rate of curing, each composite should have its curing process evaluated individually.
Therefore, the aim of this study was to analyze the influence of the light-curing times and power variations on the conversion degree and surface hardness of 3 orthodontic composites light cured using the same energy level and the same light source.
Material and methods
One hundred eighty composite discs (diameter, 6 mm; thickness, 1 mm) were prepared and divided into 3 groups of 60 samples according to the composite used: Transbond XT (3M Unitek, Monrovia, Calif; group 1), Opal Bond MV (Ultradent, South Jordan, Utah; group 2), and Transbond Plus Color Change (3M Unitek; group 3) ( Table I ).
| Group | Composite | Manufacturer | Number |
|---|---|---|---|
| 1 | Transbond XT | 3M Unitek, Monrovia, Calif | N182301 |
| 2 | Opal Bond MV | Ultradent, South Jordan, Utah | C013 |
| 3 | Transbond Plus Color Change | 3M Unitek, Monrovia, Calif | N130353 |
The discs were made by inserting the composites into a metallic mold, which was placed over a 10-mm-thick glass slide and polyester tape. The upper surface of the disc was also covered with polyester tape, and a 1-mm-thick glass slide was placed over it. Curing was performed with the light-curing unit tip in contact with the glass slide, standardizing the incidence of the light perpendicular to the surface of the disc.
Each group (n = 60) was further divided into 3 subgroups (n = 20). Five samples were used for measurement of the conversion, and 15 were used for measurement of microhardness.
A third-generation light-emitting diode curing unit with multiwavelength emission of broad light spectrum (VALO LED curing light, Ultradent) was used for curing the samples. This device operates at a wavelength range of 380 to 510 nm, with 2 emission peaks at 403.87 and 459.11 nm, and 3 power levels: standard, high, and plasma emulation. The 3 power levels were measured with a Fieldmaster laser power meter (Coherent, Santa Clara, Calif), and values of 530, 760, and 1520 mW were found, respectively.
All discs were cured using a similar level of energy, but with variations in curing times and light-source power levels according to the following formula: energy = power × time ( Table II ).
| Subgroup | Composite | Power (mW) | Time (s) | Total energy (J) |
|---|---|---|---|---|
| G1-1 | Transbond XT | (P1) 530 | T1: 8.5 | 4.50 |
| G1-2 | Transbond XT | (P2) 760 | T2: 6 | 4.56 |
| G1-3 | Transbond XT | (P3) 1520 | T3: 3 | 4.56 |
| G2-1 | Opal Bond MV | (P1) 530 | T1: 8.5 | 4.50 |
| G2-2 | Opal Bond MV | (P2) 760 | T2: 6 | 4.56 |
| G2-3 | Opal Bond MV | (P3) 1520 | T3: 3 | 4.56 |
| G3-1 | Transbond Plus CC | (P1) 530 | T1: 8.5 | 4.50 |
| G3-2 | Transbond Plus CC | (P2) 760 | T2: 6 | 4.56 |
| G3-3 | Transbond Plus CC | (P3) 1520 | T3: 3 | 4.56 |
After the curing process, the discs were individually stored in dark vials until sample preparations for conversion degree and hardness evaluation.
For analysis of the conversion degree, 5 composite discs from each group were ground into a fine powder with a mortar and pestle, and 5 mg of the resulting powder was mixed with 10 mg of potassium bromide. The mixture was placed into an 8-mm-diameter metallic mold (PerkinElmer, Waltham, Mass) and then compressed by a pressing machine operating at 10 tons (SKAY, São José do Rio Preto, Brazil) for 60 seconds. These tablets were compared with 5 other ones made in a similar manner, except using the respective uncured composite.
The light-cured and uncured tablets for each group were placed into a spectrometer (Spectrum 2000; PerkinElmer) for spectrum acquisition. The measurements were made in absorbance mode at intervals from 4000 to 400 cm −1 and operating at 32 scans with a resolution of 4 cm −1 . Specific software was used for analysis of the spectra (Spectrum, version 5.3.1 for Windows; PerkinElmer).
The degree of conversion was calculated as a percentage through the analysis of the obtained spectra through the decrease of the intensity of the vinyl double bonds (C=C) in relation to the intensity of the bond of aromatic ring bonds (C-C), which was used as the internal sample standard because it does not change after a light-curing reaction. The formula used is the following:
where DC is degree of conversion, a is the peak height of the C=C bond at 1637 cm −1 for the light-cured resin, b is the peak height of the C-C bond at 1610 cm −1 for the light-cured resin, c is the peak height of the C=C bond at 1637 cm −1 for the uncured resin, and d is the peak height of the C-C bond at 1610 cm −1 for the uncured resin.
For analysis of the Knoop hardness (KHN), a microhardness tester (Micromet S103; Buehler, Lake Bluff, Ill) was used on 15 discs of each subgroup at a load of 30 gf for 15 seconds. Eight measurements were taken on the surface opposed to the light application (bottom surface) for each disc, and their respective mean values were calculated.
The values obtained were normally distributed, and 2 separate 2-way analysis of variance (ANOVA) tests were performed ( P = 0.05) using SPSS software (version 16.0; SPSS, Chicago, Ill). One was used to assess the influences of curing times and composites on the conversion degree, and the other was used to assess the same effects on the surface microhardness. The post hoc Tukey test was applied for comparison between the groups when a significant difference was found.
Results
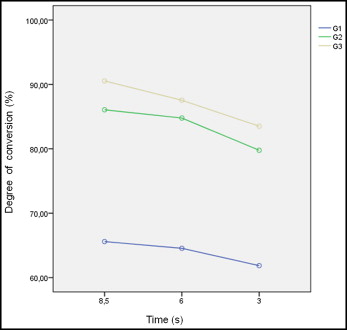
A difference was found in the conversion degree of the composites cured at different times but with the same level of energy ( P <0.001) ( Table III ). A similar degree of conversion was found when the composites were cured at 8.5 seconds (80.7%) and 6 seconds (79.0%), but it was lower at 3 seconds (75.0%) ( Table III , Fig 1 ). A difference in the conversion degree of the composites was also found ( P <0.001) ( Table III ). Group 3 showed the highest value of conversion (87.2%), followed by group 2 (83.5%) and group 1 (64.0%) ( Table III ). No interaction was found between curing times and composites for conversion degree ( Table III ).
| Degree of conversion (%) | SD | P | |
|---|---|---|---|
| Time (s) | <0.001 | ||
| T1: 8.5 | 80.7 A | 11.2 | |
| T2: 6 | 79.0 A | 10.8 | |
| T3: 3 | 75.0 B | 10.08 | |
| Composite | <0.001 | ||
| G1 | 64.0 C | 0.66 | |
| G2 | 83.5 B | 1.45 | |
| G3 | 87.2 A | 0.51 | |
| Time × composite | 0.424 |
A difference was found in the surface microhardness of the composites cured for different times but with the same level of energy ( P <0.001) ( Table IV ). The composites showed lower values of microhardness when cured at 8.5 seconds (35.2 KHN), but no difference was found between 6 seconds (41.6 KHN) and 3 seconds (42.8 KHN) ( Table IV , Fig 2 ). Microhardness values were also different among the composites tested ( P <0.001) ( Table IV ). Group 3 showed a higher surface microhardness (53.6 KHN) compared with group 2 (35.7 KHN) and group 1 (30.0 KHN) ( Table IV ). A significant interaction was found between composites and curing times on microhardness ( P <0.001) ( Table IV ).


