Introduction
The aims of this study were to analyze 3-dimensional skeletal changes in subjects with Class II malocclusion treated with the Herbst appliance and to compare these changes with treated Class II controls using 3-dimensional superimposition techniques.
Methods
Seven consecutive Herbst patients and 7 Class II controls treated with Class II elastics who met the inclusion criteria had cone-beam computed tomographs taken before treatment, and either after Herbst removal or at posttreatment for the control subjects. Three-dimensional models were generated from the cone-beam computed tomography images, registered on the anterior cranial bases, and analyzed using color maps and point-to-point measurements.
Results
The Herbst patients demonstrated anterior translation of the glenoid fossae and condyles (right anterior fossa, 1.69 ± 0.62 mm; left anterior fossa, 1.43 ± 0.71 mm; right anterior condyle, 1.20 ± 0.41 mm; left anterior condyle, 1.29 ± 0.57 mm), whereas posterior displacement predominated in the controls (right anterior fossa, −1.51 ± 0.68 mm; left anterior fossa, −1.31 ± 0.61 mm; right anterior condyle, −1.20 ± 0.41 mm; left anterior condyle, −1.29 ± 0.57 mm; P <0.001). There was more anterior projection of B-point in the Herbst patients (2.62 ± 1.08 mm vs 1.49 ± 0.79 mm; P <0.05). Anterior displacement of A-point was more predominant in the controls when compared with the Herbst patients (1.20 ± 0.53 mm vs −1.22 ± 0.43 mm; P <0.001).
Conclusions
Class II patients treated with the Herbst appliance demonstrated anterior displacement of the condyles and glenoid fossae along with maxillary restraint when compared with the treated Class II controls; this might result in more anterior mandibular projection.
Treatment of Class II malocclusions is a common challenge for orthodontists in the United States. Approximately one third of all patients have a Class II Division 1 malocclusion. Mandibular retrognathism is the primary etiologic factor in most of those patients. Functional appliances have been shown to be effective in correcting Class II malocclusions by decreasing overjet and achieving Angle Class I canine and molar relationships. Eliminating patient compliance factors and delivering continuous forces give fixed functional appliances a distinct treatment advantage compared with removable appliances. Many studies have reported the greatest anteroposterior improvements in mandibular projection when using fixed Herbst functional appliances.
Functional appliances, such as the Herbst, have been purported to improve mandibular projection, consequently improving the underlying skeletal discrepancies. However, the available data that examine the extent of skeletal vs dentoalveolar adaptation in Class II correction with functional appliances are controversial. The skeletal component of Class II correction has been reported to be from 13% to 85%. Variations in reported skeletal changes are due to a number of factors ranging from physiologic and anatomic inconsistencies in the study subjects to limitations in the study methodologies.
Studies focusing on patients treated using the Herbst appliance during the peak of pubertal growth exhibit vast inconsistencies in the extent of skeletal vs dentoalveolar adaptation. The differences in treatment timing alone do not account for the ambiguities reported in the literature. Studies suggest that anatomic factors, such as facial type and gonial angle, might have an impact on the extent of skeletal adaptation. However, literature focusing on these factors is limited. Ultimately, it is impossible to accurately assess the extent of skeletal adaptation, let alone examine how anatomic factors affect these adaptations, with the limitations of current methodologies.
Although it has been suggested that translation of the glenoid fossa/condyle complex is the source of skeletal adaptation, previous studies have used condylion or a proxy point for condylion to make these assessments. Poor reliability of identifying this landmark brings to question the accuracy of the findings in these studies. Excitement regarding the possibility of glenoid fossa remodeling using functional jaw orthopedic appliances arises from the findings in animal studies. However, these findings have yet to be definitively extended to human subjects. Even though studies report improved mandibular projection with Herbst treatment, the factors leading to these changes are elusive because of limitations in 2-dimensional (2D) cephalometric imaging.
Two-dimensional imaging is subject to magnification, distortion, and patient positioning errors, and obstruction of critical landmarks by overlapping anatomic structures. Additionally, there is inherent examiner bias in the registration process if the examiners are not blinded. Shortcomings of 2D linear and angular cephalometric measurements do not explain the complex 3-dimensional (3D) process of bone remodeling over time and can also account for discord in the literature regarding the skeletal effects of Herbst therapy. Three-dimensional imaging and superimposition techniques overcome these inadequacies by accurately examining and measuring maxillary and mandibular adaptive and positional changes relative to the anterior cranial base. The 3D superimposition protocol uses a ridged voxel-based registration technique that eliminates examiner bias in the registration process.
Whereas the Herbst appliance is effective in correcting Class II malocclusions by decreasing overjet and correcting to an Angle Class I molar relationship, the extent of skeletal vs dentoalveolar changes producing these effects is controversial and of great interest to the orthodontist. The aims of this study were to use 3D imaging and superimposition techniques to report skeletal changes associated with Class II correction in Herbst patients, and to compare these findings with matched Class II patients treated with elastics. Specifically, maxillary positional changes, differences in mandibular growth, and condylar and glenoid fossa positional changes were evaluated.
Material and methods
Adolescent patients near the pubertal growth spurt (determined by cervical vertebral maturation method stages 3 and 4) with Class II skeletal relationships (ANB, ≥4°) and Class II molar relationships seen at the University of North Carolina Department of Orthodontics were evaluated for Herbst appliance therapy. Seven consecutive patients who met the inclusion criteria were enrolled in this prospective pilot study ( Table I ). Seven Class II control subjects treated with Class II elastics were obtained from the University of Minnesota database. Approvals from the University of North Carolina and the University of Minnesota institutional review boards were obtained for this study.
| Measurement | Herbst mean | SD | Control mean | SD | P value | Significance |
|---|---|---|---|---|---|---|
| Age (y) | 13.00 | 1.00 | 13.40 | 0.98 | 0.43 | NS |
| Observation time (mo) | 13.00 | 0.58 | 18.42 | 3.05 | 0.00 | ∗ |
| ANB (°) | 5.29 | 1.09 | 6.10 | 0.73 | 0.12 | NS |
| A-N perpendicular (°) | 0.89 | 3.42 | 5.15 | 3.19 | 0.04 | ∗ |
| B-N perpendicular (°) | −7.16 | 6.03 | −2.62 | 4.07 | 0.14 | NS |
| U1-SN (°) | 99.37 | 9.55 | 104.08 | 3.06 | 0.25 | NS |
| IMPA (°) | 94.85 | 6.76 | 94.71 | 5.00 | 0.97 | NS |
| MPA (°) | 25.73 | 6.13 | 36.71 | 2.82 | 0.00 | ∗ |
The Herbst appliance design included miniscope telescoping arms with a cantilever from the mandibular first molars and occlusal rests on the second molars and the first premolars (Allesee Orthodontic Appliances, Sturtevant, Wis). The appliance was initially advanced to a Class I molar position. Fixed appliances were placed on the maxillary and mandibular incisors and canines and tied back to the molar crown after alignment was achieved. The Herbst appliance was advanced at 2-mm increments to an overcorrected position (overjet, 0 to −1 mm). The duration of advancement was 6 to 9 months with a 3- to 4-month retention period thereafter. It has been suggested that an extended retention period allows for adequate bone maturation and thus might lead to a more stable result. The average treatment time was 11.42 ± 1.4 months for the Herbst subjects in this study; this was longer than the usual 6- to 8-month treatment durations of other authors.
Cone-beam computed tomography (CBCT) scans were taken before treatment (T1) for both the Herbst and the control patients and immediately after removal of the Herbst appliance (T2) and after treatment for the control patients (T2). The premolars and molars were bonded on all Herbst patients to complete treatment, and CBCT scans were taken after appliance placement. The Herbst patients’ scans were taken using the New Tom 3G (Aperio Services, Sarasota, Fla) with a 12-in field of view. The control subjects’ CBCT scans were taken with an i-Cat machine (Imaging Sciences International, Hatfield, Pa) with a 16 × 22 cm field of view. All patients (control and Herbst) were instructed to bite into maximum intercuspation during scan capture. T1 and T2 scans for both groups were evaluated to make sure that the condyles were seated in the center of the fossa. Patients were excluded from the study if the condyles were postured in either the T1 or T2 scans. The DICOM scans were downsized to 0.5 × 0.5 × 0.5 mm and deidentified using Imagine ( http://www.ia.unc.edu/dev/download/imagine/index.htm ). The scans were downsized to decrease the computational power and time required to compute cranial based registration. Waltrick et al recently evaluated CBCT accuracy when the voxel size of the scan was changed from 0.2 mm to 0.3 mm to 0.4 mm and concluded that there was no statistical difference in error measurements between the different voxel sizes. ITK SNAP ( www.itksnap.org ) was used to construct virtual 3D surface models. Scans at T1 and T2 were registered on the anterior cranial fossa using a fully automated voxel-wise ridged registration technique described by Cevidanes et al. This process uses voxel intensity and shape of the region of interest for the registration. Boundaries for the anterior cranial base registration were defined anteriorly by the inner cortical layer of the frontal bone, posteriorly by the anterior wall of the sella, laterally including the lesser wings of the sphenoid bone, and superiorly including the frontal bone. This region includes the cribriform plate and the superior aspect of the ethmoid bone. These structures are known to complete growth by the age of 7 years and are thus considered stable landmarks.
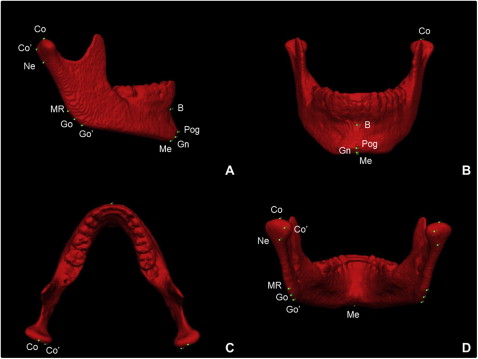
Registered 3D models were then analyzed using Vectra Analysis Model software (Canfield Imaging Systems, Fairfield, NJ). Quantitative evaluations of growth and treatment response were calculated using (1) an iterative closest point method with color map tools and (2) point-to-point landmark identification. Landmarks selected for this study are shown in Figure 1 . Additional landmarks included Co′ and Go′. Co′ is defined by the most superoposterior point of the posterior condylar head identified from the sagittal view. Go′ is defined as the most posterior aspect of the mandibular corpus at the point where it starts to curve from the angle of the mandible, identified from a sagittal view with the functional occlusal plane parallel to the floor. For all measurements, positive values indicated anterior displacements and negative values indicated posterior displacements relative to T1. Cephalometric landmark placement on 3D volumes has been shown to be accurate and reproducible.
Statistical analysis
Data analysis was conducted using the SPSS statistical software package (version 12.0; SPSS, Chicago, Ill). Means, standard deviations, and ranges were calculated for the Herbst and control subjects to describe their skeletal and dental characteristics. Statistical differences were assessed using analysis of variance. The Wilcoxon signed-rank test was used to assess differences in displacement between the Herbst and the control subjects. Repeated measurements were made after 1 week by an examiner (M.L.), and intraexaminer correlation coefficients (ICC) were used to evaluate the reliability of repeated measures. A 1-sample t test was performed on duplicate measurements to test for systematic errors.
Results
Descriptive statistics for the Herbst and control patients are summarized in Table I . The patients were well matched with regard to age, ANB (Herbst, 5.29°; controls, 6.10°), and incisor angulations. The control subjects had a longer observation time of 18.42 ± 3.05 months compared with 13 ± 0.577 months for the Herbst subjects ( P = 0.003) and a larger A-N perpendicular measurement ( P = 0.04). Additionally, the Herbst subjects had a flatter mandibular plane angle with a mean of 25.73° ± 6.13° compared with 36.71° ± 2.82° in the controls ( P = 0.001).
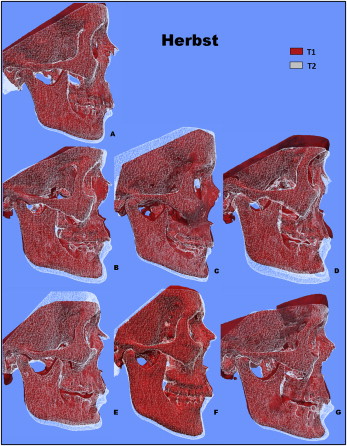
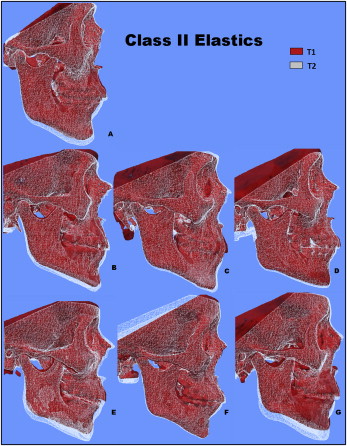
Qualitative assessment of maxillary skeletal changes was conducted using a semitransparent overlay of the superimpositions and an iterative closest point measurement from color maps ( Figs 2 and 3 ). For structures that were obstructed from view, a mesh transparency for T2 allowed for better visualization of the superimpositions. All Herbst patients, except for 1 subject, demonstrated maxillary restraint ( Fig 2 ). Four Herbst subjects displayed the largest maxillary displacements. Retroclination of the maxillary incisors was evident in 2 control subjects, and maxillary restraint was noted only in 1 control subject ( Fig 3 ).
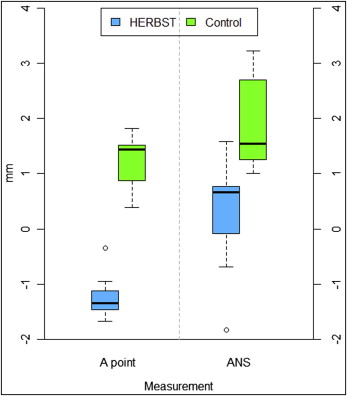
Quantitative assessment of maxillary changes is reported in Table II and Figure 4 . Greater anterior projections of A-point and ANS (1.2 and 1.96 mm, respectively) were shown by the treated controls, when compared with the Herbst subjects (−1.22 and 0.26 mm, respectively; P <0.01).
| Measurement | Herbst mean | SD | Control mean | SD | Difference | P value | Significance |
|---|---|---|---|---|---|---|---|
| Maxillary skeletal | |||||||
| A-point (mm) | −1.22 | 0.43 | 1.20 | 0.53 | 2.42 | 0.00 | ∗ |
| ANS (mm) | 0.26 | 1.09 | 1.96 | 0.87 | 1.70 | 0.01 | ∗ |
| Mandibular skeletal | |||||||
| Pogonion (mm) | 4.36 | 2.38 | 2.82 | 1.78 | 1.53 | 0.21 | NS |
| B-point (mm) | 2.62 | 1.08 | 1.49 | 0.79 | 1.14 | 0.05 | ∗ |
| Co-Gn (right) (mm) | 4.05 | 2.18 | 3.62 | 1.58 | 0.42 | 0.90 | NS |
| Co-Gn (left) (mm) | 4.05 | 1.80 | 3.05 | 2.06 | 1.00 | 0.38 | NS |
| Go-Gn (right) (mm) | 1.90 | 1.30 | 2.45 | 1.13 | 0.55 | 0.41 | NS |
| Go-Gn (left) (mm) | 2.12 | 1.58 | 1.84 | 1.37 | 0.28 | 0.90 | NS |
| Go′-Co (right) (mm) | 4.77 | 1.63 | 2.54 | 1.43 | 2.23 | 0.02 | ∗ |
| Go′-Co (left) (mm) | 3.31 | 2.24 | 2.76 | 1.61 | 0.55 | 0.80 | NS |
| Co-Go-Me (right) (°) | 0.03 | 2.06 | −0.84 | 3.07 | 0.87 | 0.46 | NS |
| Co-Go-Me (left) (°) | −0.15 | 1.56 | −0.37 | 2.03 | 0.21 | 0.71 | NS |
| Co′-Ne-MR (right) (°) | −3.29 | 3.06 | 0.47 | 3.29 | 3.76 | 0.07 | NS |
| Co′-Ne-MR (left) (°) | −0.22 | 10.29 | −3.57 | 6.58 | 3.35 | 0.82 | NS |
| Condyle/glenoid fossa skeletal | |||||||
| Anterior condyle (right) (mm) | 1.32 | 0.56 | −1.20 | 0.41 | 2.52 | 0.00 | ∗ |
| Anterior condyle (left) (mm) | 1.65 | 0.93 | −1.29 | 0.57 | 2.94 | 0.00 | ∗ |
| Co (right) (mm) | 0.38 | 0.59 | −0.88 | 0.71 | 1.26 | 0.01 | ∗ |
| Co (left) (mm) | 0.56 | 0.64 | −1.16 | 0.60 | 1.72 | 0.00 | ∗ |
| Posterior condyle (right) (mm) | 0.44 | 1.19 | −1.31 | 0.47 | 1.74 | 0.03 | ∗ |
| Posterior condyle (left) (mm) | 0.16 | 1.32 | −1.19 | 0.60 | 1.35 | 0.05 | ∗ |
| Anterior fossa (right) (mm) | 1.69 | 0.62 | −1.51 | 0.68 | 3.19 | 0.00 | ∗ |
| Anterior fossa (left) (mm) | 1.43 | 0.70 | −1.31 | 0.61 | 2.74 | 0.00 | ∗ |
| Posterior fossa (right) (mm) | 0.59 | 1.49 | −1.24 | 0.45 | 1.83 | 0.13 | NS |
| Posterior fossa (left) (mm) | 0.79 | 1.34 | −1.41 | 0.55 | 2.20 | 0.01 | ∗ |
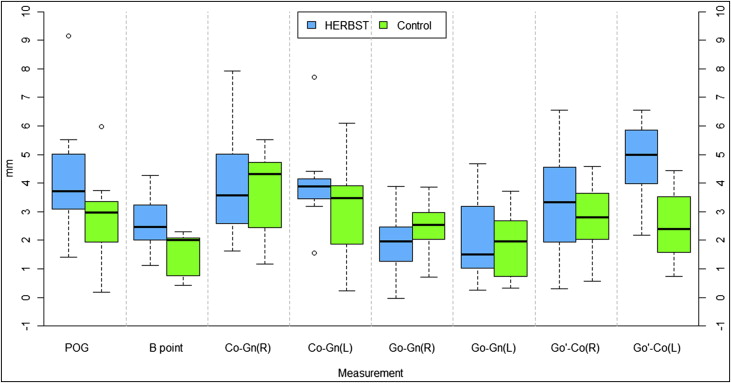
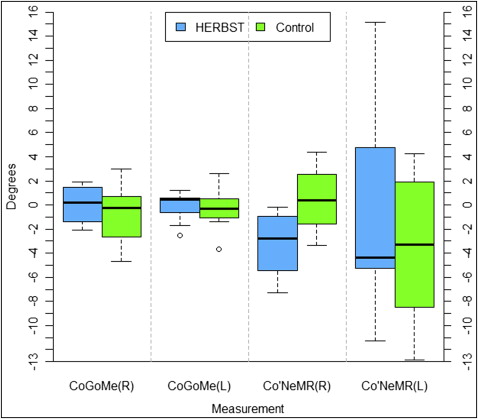
Skeletal changes in the mandible are reported in Table II and Figures 5 and 6 . B-point had average displacements of 2.62 mm in the Herbst subjects and 1.49 mm in the control subjects, showing a statistically significant increase in the anterior projection of B-point in the Herbst patients by 1.14 mm ( P = 0.05). Additionally, a 2.23-mm difference was noted for Go′-Co right ( P = 0.02). All other linear mandibular changes were not statistically significant when comparing the Herbst and the control subjects ( Table II , Fig 5 ). In addition, angular measurements evaluating opening of the gonial angle and condylar flexure showed no statistical differences between the Herbst and the control subjects ( Table II , Fig 6 ).
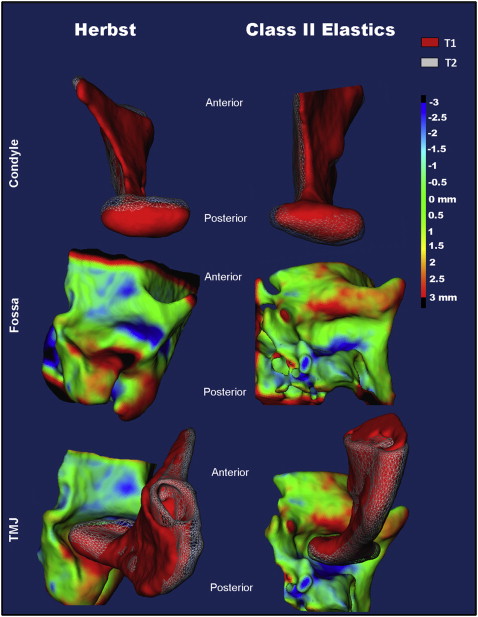
Mean condylar and glenoid fossa displacements are shown in Table II and Figures 7 and 8 . In general, the Herbst patients showed forward displacement of the condyles, whereas the control subjects had posterior displacement. The mean differences in displacement of the condyles between the 2 groups were approximately 2.5 to 2.9 mm when measured from the anterior surface ( P <0.001) and 1.74 to 1.35 mm when measured from the posterior surface of the condyles ( P <0.05).
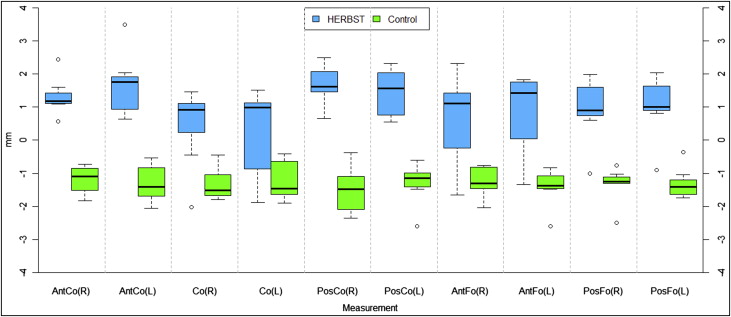
In addition, point-to-point linear changes were evaluated for condylion ( Table II , Fig 8 ). Box plots in Figure 8 depict the net anterior displacement of condylion in the Herbst patients (right, 0.38 mm; left, 0.56 mm). Conversely, a net posterior displacement of condylion was observed in the control group (right, −0.88 mm; left, −1.16 mm). These changes in condylar position were less than those found using the iterative closest point method (right, 1.26 mm; left, 1.72 mm) but were statistically significant ( P >0.01).
Mean changes for fossa remodeling are shown in Table II and Figure 8 . The Herbst patients showed resorption at the anterior wall (right, 1.69 mm; left, 1.43 mm) with deposition at the posterior wall of the glenoid fossa (right, 0.59 mm; left, 0.79 mm) ( Figs 7 and 8 ). Conversely, the control group showed bony apposition on the anterior wall (right, −1.51 mm; left, −1.31 mm) with resorption at the posterior wall (right, −1.24 mm; left, −1.41 mm). This corresponds with the direction of condylar displacement in the groups ( Fig 8 ).
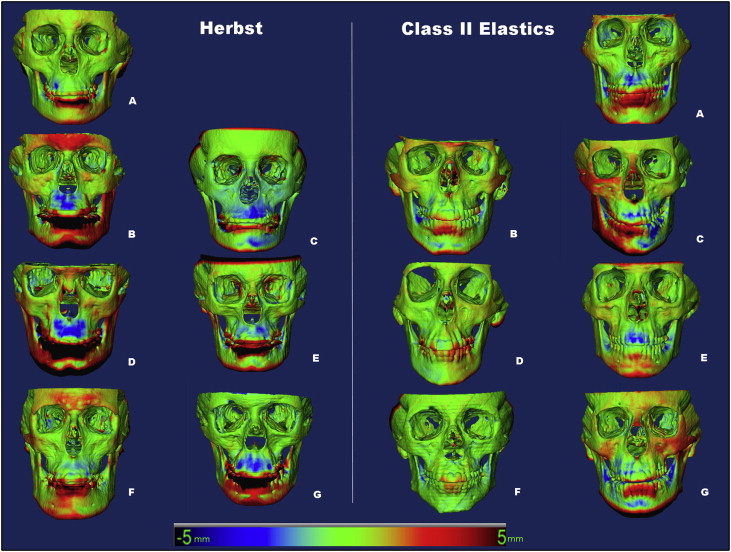
Figure 9 shows the composite of the individual color maps, demonstrating the global changes computed with the iterative closest point algorithms. Although the maxillary, mandibular, condylar, and glenoid fossa positional changes in the Herbst patients showed statistical differences compared with the control subjects, considerable variations in magnitude and direction of these skeletal changes were seen when examining the color maps of each subject ( Fig 9 ).