Introduction
The increasing use of cone-beam computed tomography in orthodontics has been coupled with heightened concern about the long-term risks of x-ray exposure in orthodontic populations. An industry response to this has been to offer low-exposure alternative scanning options in newer cone-beam computed tomography models.
Methods
Effective doses resulting from various combinations of field of view size and field location comparing child and adult anthropomorphic phantoms with the recently introduced i-CAT FLX cone-beam computed tomography unit (Imaging Sciences, Hatfield, Pa) were measured with optical stimulated dosimetry using previously validated protocols. Scan protocols included high resolution (360° rotation, 600 image frames, 120 kV[p], 5 mA, 7.4 seconds), standard (360°, 300 frames, 120 kV[p], 5 mA, 3.7 seconds), QuickScan (180°, 160 frames, 120 kV[p], 5 mA, 2 seconds), and QuickScan+ (180°, 160 frames, 90 kV[p], 3 mA, 2 seconds). Contrast-to-noise ratio was calculated as a quantitative measure of image quality for the various exposure options using the QUART DVT phantom.
Results
Child phantom doses were on average 36% greater than adult phantom doses. QuickScan+ protocols resulted in significantly lower doses than standard protocols for the child ( P = 0.0167) and adult ( P = 0.0055) phantoms. The 13 × 16-cm cephalometric fields of view ranged from 11 to 85 μSv in the adult phantom and 18 to 120 μSv in the child phantom for the QuickScan+ and standard protocols, respectively. The contrast-to-noise ratio was reduced by approximately two thirds when comparing QuickScan+ with standard exposure parameters.
Conclusions
QuickScan+ effective doses are comparable with conventional panoramic examinations. Significant dose reductions are accompanied by significant reductions in image quality. However, this trade-off might be acceptable for certain diagnostic tasks such as interim assessment of treatment results.
The use of cone-beam computed tomography (CBCT) in orthodontics has increased dramatically over the last few years. Because cancer is the principal long-term biologic effect of exposure to x-rays, one of the greatest issues facing use of CBCT in orthodontics is justification of the increased doses of ionizing radiation administered to patients compared with standard 2-dimensional imaging techniques.
A routine medical computed tomography head scan can have an effective dose of approximately 2 mSv. Whereas most CBCT examinations have been reported to impart a much lower dose, CBCT units from different manufacturers vary in their doses by as much as 10-fold for an equivalent field of view (FOV), with some units roughly equivalent in dose to optimized computed tomography scans. Although the risk to a patient from 1 computed tomography or CBCT examination might not by itself be large, millions of examinations are performed each year, making radiation exposure from dental and medical imaging an important public health issue. It has been estimated that 1.5% to 2% of all cancers in the United States can be attributed to computed tomography studies alone. This is especially important for the adolescent and pediatric populations that routinely receive orthodontic treatment and whose cellular growth and organ development are associated with increased radiosensitivity of tissues. In conjunction with a longer life expectancy in which cancer can develop, children are 2 to 5 times more sensitive to radiation carcinogenesis than mature adults.
Image quality in CBCT is observer dependent, subjective, and used to describe how well the desired information can be extracted from an image. Because it is subjective, the measurement and comparison of image quality across CBCT units in diagnostic situations are complex problems. Two elements of subjective image quality that correlate with objective quality measures include contrast and spatial resolution. Image contrast can be objectively measured with the contrast-to-noise ratio, and spatial resolution can be measured by computing a modulation transfer function. The quality of CBCT scans is also an important consideration for users in orthodontics because the selection of image quality for a CBCT scan becomes a decision on dose and vice versa. Image quality technical-factor adjustments that select between “high” and “low” image quality in many CBCT units can cause as much as a 7-fold difference in doses.
The ongoing challenge in the optimization of CBCT is to reduce the dose without drastically decreasing image quality and diagnostic information. One potential means of reducing patient risk from CBCT examinations is to limit the area of exposure using variable FOVs that are sized for the location of the anatomy of interest. However, voxel size is linked to FOV in many CBCT units, and smaller voxel sizes associated with smaller FOVs can actually increase the dose because of increases in exposure that are needed to maintain an adequate contrast-to-noise ratio. Another approach is to reduce exposure for diagnostic tasks that theoretically require lower contrast-to-noise ratios or lower signal modulation transfer functions. An example of this type of task might be checking the angulation of roots. The combination of careful selection of exposure parameters and FOV can result in an optimal dose for specific diagnostic tasks in orthodontic practice.
The purpose of this study was to evaluate doses resulting from various combinations of FOV size, location, and exposure parameters using child and adult phantoms with the i-CAT FLX unit (Imaging Sciences, Hatfield, Pa). A second aim was to measure contrast-to-noise ratio and modulation transfer function as quantitative measurements of image quality for the various exposure options offered by the i-CAT unit. A tertiary aim was to compare phantom sizes and types as well as thermoluminescent dosimetry and optically stimulated luminescent (OSL) dosimetry.
Material and methods
OSL dosimeters (Nanodot; Landauer, Glenwood, Ill) are plastic disks infused with aluminum oxide doped with carbon (Al 2 O 3 :C). The trace amounts of carbon in the aluminum oxide crystal lattice create imperfections that act as traps (F centers) for electrons and positively charged areas called “holes.” After exposure to ionizing radiation, free electrons and holes are generated and trapped at the F centers in proportion to the amount of energy in the exposure. Energy captured by the F centers is reemitted as light when electrons and holes recombine. Recombination occurs when the crystal is optically stimulated with a controlled exposure of 540-nm light from a light-emitting diode. The energy released from the F centers can be distinguished from the stimulating light because it is emitted in the form of 420-nm photons. The intensity or quantity of the emitted photons depends on the dose absorbed by the OSL dosimeter and the controlled intensity of the stimulating light. The intensity of the emitted light is proportional to the stored dose and is recorded by a photomultiplier tube that incorporates a filter that screens out photons from the stimulating light source. Each dosimeter is encased in a light-tight plastic holder measuring approximately 1 × 10 × 10 mm. This case prevents loss of energy through stimulation by ambient light. Dosimeters used in this study were read with a portable reader (MicroStar; Landauer). The reader was calibrated before use. After calibration, photon counts from dosimeters can be recorded with an accuracy of about ±2%. Photon counts are converted to doses using an energy-specific conversion factor. Doses reported by the reader were adjusted for energy response using a third-order polynomial calibration curve derived from side-by-side comparisons of recorded doses from an ion chamber and OSL dosimeters over a range of 80 to 120 kV(p) using an adjustable kilovolt peak source. For this study, the OSL sensitivity at 90 kV(p) was estimated at .94 (mean, 60 kV). OSL sensitivity at 120 kV(p) was estimated at 0.78 (mean, 80 kV).
A software and hardware upgraded model of the i-CAT Next Generation dental CBCT unit (Imaging Sciences) was investigated in this study. It was updated to meet specifications that were named “i-CAT FLX.” Volume scans for this unit ranged from 8 × 8 cm to 23 × 17 cm. The unit operates at 90 or 120 kV(p) and 3 or 5 mA with a pulsed exposure time from 2.0 to 7.4 seconds. The unit rotates through 360° over 8.6 or 26 seconds. A 180° rotation is also available with a rotation time of 4.8 seconds. The scan parameters used for scans of the child and adult phantoms are given in Table I .
| FOV (cm) | ROI | Protocol | Scan angle (°) | Basis image frames (n) | Voxel size (mm) | Adult phantom | Child phantom | kV(p) | mA | Exposure (s) |
|---|---|---|---|---|---|---|---|---|---|---|
| 8 × 8 | Dental | QuickScan+ | 180 | 160 | 0.3 ∗ /0.4 | A | C | 90 | 3 | 2.0 |
| 16 × 6 | Maxilla | QuickScan+ | 180 | 160 | 0.3 ∗ /0.4 | A | C | 90 | 3 | 2.0 |
| 16 × 6 | Mandible | QuickScan+ | 180 | 160 | 0.3 ∗ /0.4 | A | C | 90 | 3 | 2.0 |
| 16 × 8 | Both arches | QuickScan+ | 180 | 160 | 0.3 ∗ /0.4 | A | C | 90 | 3 | 2.0 |
| 16 × 11 | Arches + TMJ | QuickScan+ | 180 | 160 | 0.3 ∗ /0.4 | A | C | 90 | 3 | 2.0 |
| 16 × 13 | Standard ceph | QuickScan+ | 180 | 160 | 0.3 ∗ /0.4 | A | C | 90 | 3 | 2.0 |
| 16 × 6 | Maxilla | QuickScan | 180 | 160 | 0.3 ∗ /0.4 | A | C | 120 | 5 | 2.0 |
| 8 × 8 | Dental | QuickScan | 180 | 160 | 0.3 ∗ /0.4 | A | C | 120 | 5 | 2.0 |
| 16 × 13 | Standard ceph | QuickScan | 180 | 160 | 0.3 ∗ /0.4 | A | C | 120 | 5 | 2.0 |
| 16 × 8 | Both arches | QuickScan | 180 | 160 | 0.3 ∗ /0.4 | A | C | 120 | 5 | 2.0 |
| 16 × 11 | Arches + TMJ | QuickScan | 180 | 160 | 0.3 ∗ /0.4 | A | C | 120 | 5 | 2.0 |
| 16 × 6 | Mandible | QuickScan | 180 | 160 | 0.3 ∗ /0.4 | A | C | 120 | 5 | 2.0 |
| 8 × 8 | Dental | Standard | 360 | 300 | 0.3 ∗ /0.4 | A | C | 120 | 5 | 3.7 |
| 16 × 6 | Maxilla | Standard | 360 | 300 | 0.3 ∗ /0.4 | A | C | 120 | 5 | 3.7 |
| 16 × 6 | Mandible | Standard | 360 | 300 | 0.3 ∗ /0.4 | A | C | 120 | 5 | 3.7 |
| 16 × 8 | Both arches | Standard | 360 | 300 | 0.3 ∗ /0.4 | A | C | 120 | 5 | 3.7 |
| 16 × 11 | Arches + TMJ | Standard | 360 | 300 | 0.3 ∗ /0.4 | A | C | 120 | 5 | 3.7 |
| 16 × 13 | Standard ceph | Standard | 360 | 300 | 0.3 ∗ /0.4 | A | C | 120 | 5 | 3.7 |
| 8 × 8 | Dental | High resolution | 360 | 600 | 0.125 ∗ /0.20/0.25 | A | 120 | 5 | 7.4 | |
| 16 × 6 | Maxilla | High resolution | 360 | 600 | 0.125/0.20 ∗ /0.25 | A | 120 | 5 | 7.4 | |
| 16 × 6 | Mandible | High resolution | 360 | 600 | 0.125/0.20 ∗ /0.25 | A | 120 | 5 | 7.4 | |
| 16 × 8 | Both arches | High resolution | 360 | 600 | 0.125/0.20 ∗ /0.25 | A | 120 | 5 | 7.4 | |
| 16 × 11 | Arches + TMJ | High resolution | 360 | 600 | 0.125/0.20/0.25 ∗ | A | 120 | 5 | 7.4 | |
| 16 × 13 | Standard ceph | High resolution | 360 | 600 | 0.125/0.20 ∗ /0.25 | A | 120 | 5 | 7.4 | |
| 23 × 17 | EFOV | Standard | 360 | 300 | 0.3 ∗ /0.4 | A | 120 | 5 | 3.7 | |
| 23 × 17 | EFOV | Enhanced | 360 | 600 | 0.3 ∗ /0.4 | A | 120 | 5 | 7.4 |
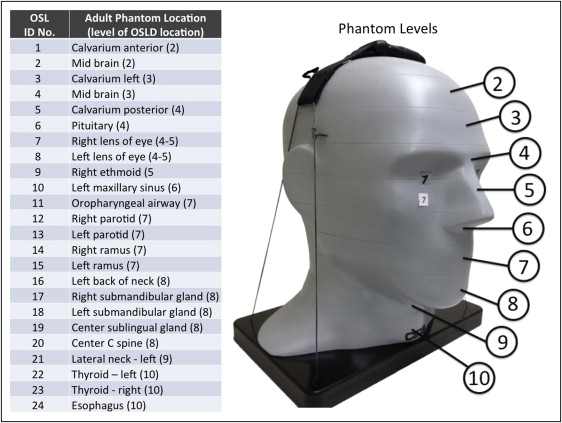
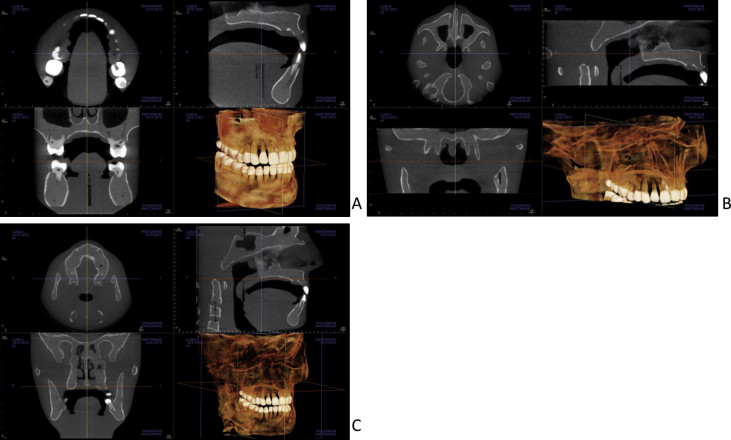
Adult dosimetry was acquired using a tissue-equivalent phantom simulating the anatomy of an average adult male (ATOM Max model 711 HN; CIRS, Norfolk, Va). The phantom includes detailed 3-dimensional anthropomorphic anatomy including brain, bone, larynx, trachea, sinus, nasal cavities, and teeth. The bones contain both cortical and trabecular separations. The phantom was modified by machining slots to accept nanodot dosimeters at sites corresponding to the internal tissues of interest. A skin surface dosimeter in the back of the neck was positioned at the vertical center of the designated slice level and taped in position. Lens of eye dosimeters were centered over and inset in the anatomic location for the lens and taped in position. Internal dosimeters were positioned vertically with the upper edge of the dosimeter slot, flush with the surface of the selected slice level, and held in position by friction of the dosimeter case and the phantom material at the sampled anatomic location. Adult dosimeter anatomic locations and phantom levels are shown in Figure 1 . During scanning, the phantom was oriented with its section planes approximately parallel to the scan rotation plane (horizon). A phantom position simulating the positioning of a patient on the chin rest was used. With the exception of the 13 × 16-cm cephalometric and 6 × 16-cm maxillary FOVs, centered FOVs were positioned to capture approximately 5 mm of soft tissue below the lower cortical border of the chin. The anteroposterior position of the phantom was established to capture approximately 5 mm of soft tissue anterior to the facial surface of the maxillary incisor crowns. For the 6 × 16-cm maxillary views, the lower border of the FOV was positioned approximately 5 mm below the maxillary central incisor edge. For the 13 × 16-cm cephalometric views, the tip of the nose and the lower soft tissue border of the chin were included in the FOV ( Fig 2 ).
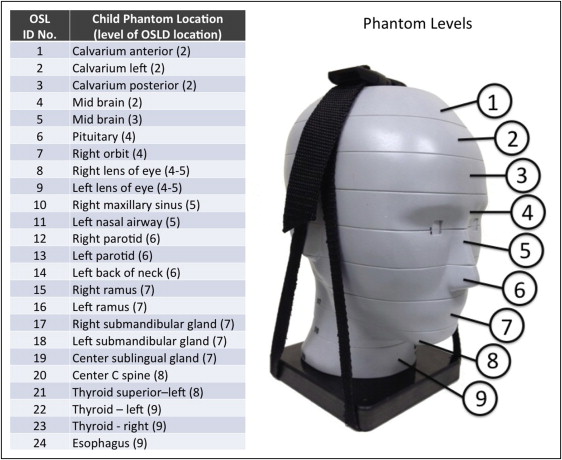
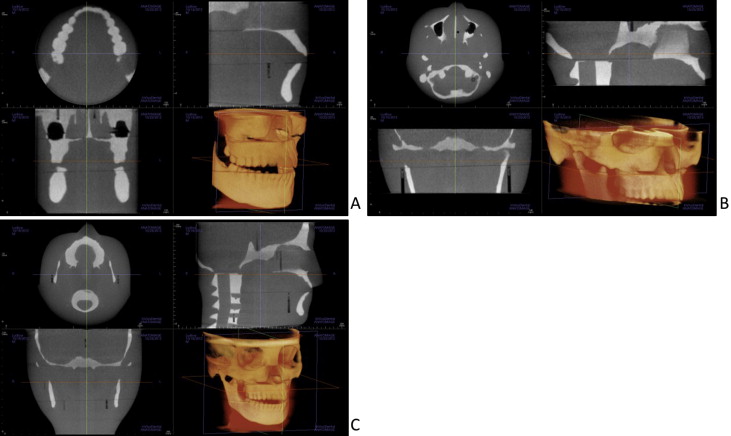
Child dosimetry was acquired using a tissue-equivalent phantom simulating the anatomy of a 10-year-old child (ATOM model 706 HN; CIRS). Tissues simulated in this phantom were average soft tissue, average bone tissue, spinal cord, spinal discs, brain, and sinus. Simulated bone tissue matches age-related density. Dosimeter anatomic locations and child phantom levels are shown in Figure 3 . With the exception of the 11 × 16-cm, 13 × 16-cm, and 6 × 16-cm maxillary FOVs, centered FOVs were positioned to capture approximately 5 mm of soft tissue below the lower cortical border of the chin. The anteroposterior position of the phantom was established to capture approximately 5 mm of soft tissue anterior to the facial surface of the maxillary incisor crown. For the 6 × 16-cm maxillary views, the lower border of the FOV was positioned approximately 5 mm below the maxillary central incisor edge. For the 11 × 16-cm and 13 × 16-cm cephalometric views, the tip of the nose and the lower soft tissue border of the chin were included in the FOV ( Fig 4 ).
Two to 12 exposures were used for each dosimeter run to provide a more reliable measure of radiation in the dosimeters. Smaller FOVs required more exposure repetitions because more dosimeters are outside the field of direct exposure and absorb only small quantities of scatter radiation. For every scan, a scout view was also acquired. Doses recorded by the OSL dosimetry reader were divided by the number of scans to determine the exposure per examination for each dosimeter.
Doses recorded by OSL dosimeters at different positions in a tissue or an organ were averaged to express the average tissue-absorbed dose in micrograys. The products of these values and the percentage of a tissue or an organ irradiated in a radiographic examination ( Table II ) were used to calculate the equivalent dose in microsieverts.
| Fraction irradiated adult (%) | OSL ID ( Fig 1 ) | ICRP 2007 w T | Fraction irradiated child (%) | OSL ID ( Fig 3 ) | |
|---|---|---|---|---|---|
| Bone marrow | 12.2 | 0.12 | 15.4 | ||
| Mandible | 0.8 | 14, 15 | 1.1 | 15, 16 | |
| Calvaria | 7.7 | 1, 3, 5 | 11.6 | 1, 2, 3 | |
| Cervical spine | 3.8 | 20 | 2.7 | 20 | |
| Thyroid | 100 | 22, 23 | 0.04 | 100 | 21, 22, 23 |
| Esophagus | 10 | 24 | 0.04 | 10 | 24 |
| Skin | 5 | 7, 8, 16 | 0.01 | 5 | 8, 9, 14 |
| Bone surface ∗ | 16.5 | 0.01 | 16.5 | ||
| Mandible | 1.3 | 14, 15 | 1.3 | 15, 16 | |
| Calvaria | 11.8 | 1, 3, 5 | 11.8 | 1, 2, 3 | |
| Cervical spine | 3.4 | 20 | 3.4 | 20 | |
| Salivary glands | 100 | 0.01 | 100 | ||
| Parotid | 100 | 12, 13 | 100 | 12, 13 | |
| Submandibular | 100 | 17, 18 | 100 | 17, 18 | |
| Sublingual | 100 | 19 | 100 | 19 | |
| Brain | 100 | 2, 4, 6 | 0.01 | 100 | 4, 5, 6 |
| Remainder | 0.12 | ||||
| Lymphatic nodes | 5 | 11-13, 17-19, 21-24 | 5 | 12-13, 17-19, 21-24 | |
| Muscle | 5 | 11-13, 17-19, 21-24 | 5 | 12-13, 17-19, 21-24 | |
| Extrathoracic region | 100 | 9-13, 17-19, 21-24 | 100 | 10-13, 17-19, 21, 24 | |
| Oral mucosa | 100 | 11-13, 17-19 | 100 | 12-13, 17-19 |
∗ Bone surface dose = bone marrow dose × bone/muscle mass energy absorption coefficient ratio = −0.0618 × 2/3 kV(p) + 6.9406 using data taken from NBS Handbook 85.
For bone, the equivalent dose to the whole-body bone surface was calculated using the summation of the individual equivalent doses to the calvarium, mandible, and cervical spine. The determination of these equivalent doses was based on the distribution of bone throughout the body: the mandible contains 1.3%, the calvaria, 11.8%, and the cervical spine, 3.4%. Distribution of adult bone marrow was calculated using an average of data from Christy for 25- and 40-year-olds. The mandible contains 0.8%, the calvaria, 7.7%, and the cervical spine, 3.8% of the adult marrow distribution. The 10-year-old child’s marrow distribution was calculated as 1.1% for the mandible, 11.6% for the cranium, and 2.7% for the cervical spine, for a total of 15.4% of the total body marrow. With the technique of Underhill et al, 3 locations in the calvarium were averaged to determine the calvarial dose. For bone, a correction factor based on experimentally determined mass energy attenuation coefficients for bone and muscle irradiated with mono-energetic photons was applied. An effective beam energy estimated to be two thirds of the peak beam energy of the x-ray unit was used to determine the bone-to-muscle attenuation ratios. A linear fit (R 2 = 0.996) of ratios from 40 to 80 kV from published data produced the following equation: bone-to-muscle attenuation ratio = −0.0618 × kV(p) × 2/3 + 6.9406. Values calculated from this equation provided bone-to-muscle attenuation ratios of 3.21 at 60 kV (90 kV[p]) and 1.97 at 80 kV (120 kV[p]).
The proportion of skin surface area in the head and neck region directly exposed during maxillofacial CBCT imaging is estimated at 5% of the total body to calculate the radiation-weighted dose to the skin following the procedure Ludlow et al. Similarly, muscle and lymphatic nodes exposures are estimated to represent 5% of the total body complement for these tissues. The proportion of the esophageal tract that is exposed was set at 10%. Other tissues of interest were calculated at 100%.
The effective dose is a calculation that permits comparison of the detriment of different exposures to ionizing radiation to an equivalent detriment produced by a full-body dose of radiation. Effective dose, expressed in microsieverts, is calculated with the equation: E = ∑ w T × H T , where E is the summation of the products of the tissue weighting factor ( w T ), which represents the relative contribution of that organ or tissue to the overall risk, and the radiation weighted dose H T . The whole-body risk is determined by the summation of the radiation-weighted doses to all tissues or organs exposed. International Commission on Radiological Protection weighting factors in Table II were used to calculate the effective doses.
Tissue weighting factors used in the International Commission on Radiological Protection calculation of effective dose include 14 independently weighted tissues and 14 remainder tissues. Because the uterus and the cervix are present only in females, and the prostate only in males, the number used in the weighted averaging of the remainder tissues was 13.
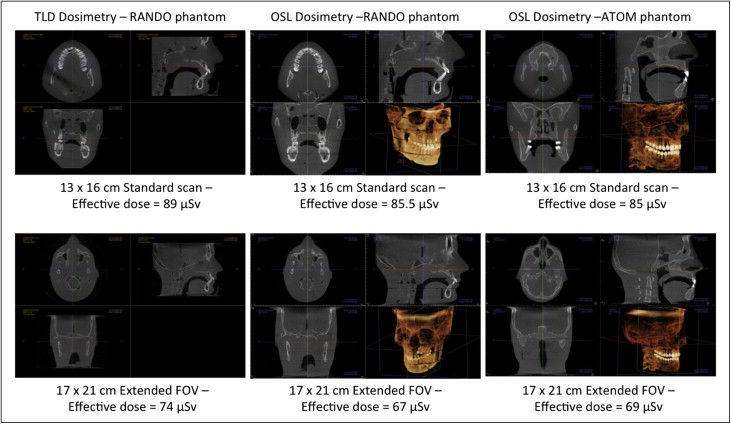
In previous studies, a radiation analog dosimetry system (RANDO) phantom (Nuclear Associates, Hicksville, NY) and thermoluminescent dosimeters (TLDs) have commonly been used for dosimetry. Because each RANDO phantom is formed around an actual human skull, the attenuation characteristics for each RANDO are variable. The precision-manufactured ATOM phantom was selected as a more reproducible model for comparative dosimetry. Effective doses were evaluated for standard and extended-field cephalometric data runs and for previously reported RANDO TLD data runs as well as for unreported OSL runs. These were compared with the adult ATOM phantom results of this study.
Analysis of variance (ANOVA) of effective dose results was used to assess data for significant differences caused by phantom type (adult or child), region of interest (dental, mandible, both arches, arches + temporomandibular joint, standard cephalometrics), and scan protocol (QuickScan+, QuickScan, standard, or high resolution). When significant differences were found, the Tukey HSD test was used to determine which factors were significantly different from other factors. An alpha value of 0.05 was chosen for all tests.
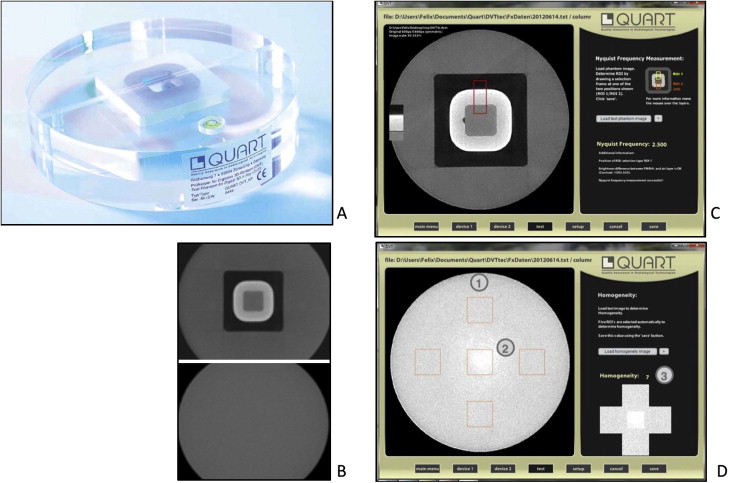
Image quality indicators associated with FOV, scanning angle, kilovolt (peak), and voxel size were acquired using a QUART DVT_AP phantom and QUART DVT_TEC software (QUART, Zorneding, Germany) ( Fig 5 ). The phantom consisted of 16-cm-diameter cylindrical slabs of acrylic plastic with polyvinyl chloride and air elements configured to permit measurements of polymethylmethacrylate voxel, polymethylmethacrylate noise, homogeneity, contrast, contrast-to-noise ratio, modulation transfer function 10%, modulation transfer function 50%, and Nyquist frequency. The measurements were calculated in a user-guided, semiautomatic manner from 2 DICOM slices selected from the volume. Each volume was measured 3 times, and averages and standard deviations of each parameter were calculated.
Results
Volumes produced by ATOM and RANDO adult phantoms for the 13 × 16-cm standard cephalometric and 17 × 23-cm extended FOVs are shown in Figure 6 . An unbiased estimator of difference between pairs ([A-B]/[A+B]/2) demonstrated that OSL dosimeter readings were 1.0% less than thermoluminescent dosimetry readings for standard cephalometric fields and 2.5% less for extended FOV RANDO imaging. The adult ATOM phantom effective doses were 0.2% less than the RANDO doses for the standard cephalometric field and 0.8% less for the extended FOV.
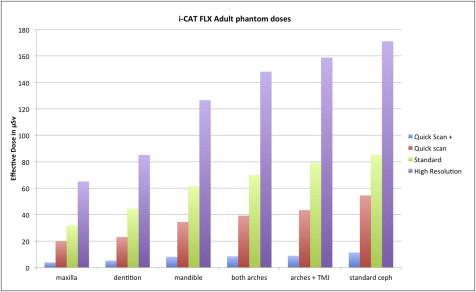
ANOVA of the combined adult and child phantom effective dose data demonstrated significant differences caused by phantom ( P = 0.0026), region of interest ( P <0.0001), and exposure protocol ( P <0.0001). Considering QuickScan+, QuickScan, and standard protocols, child phantom doses were on average 36% greater than adult phantom doses. Table III highlights the effective dose results for the adult phantom. The Tukey HSD test demonstrated that the QuickScan+ protocols resulted in significantly lower doses than the standard or high-resolution protocols but were not statistically different from the QuickScan protocols. The QuickScan protocol also resulted in lower doses than the high-resolution protocols but was not statistically different from the standard protocols. The 13 × 16-cm cephalometric imaging resulted in statistically higher doses than all other FOVs. Similarly, the 6 × 16-cm maxillary imaging resulted in significantly lower doses than all other fields. Results for the 17 × 23-cm extended FOV are not included in Table III because only standard and enhanced modes are available for this field. The effective doses were 69 μSv for the standard extended FOV and 136 μSv for the enhanced extended FOV.
| Maxilla | Dentition | Mandible | Both arches | Arches + TMJ | Standard ceph | Average | ANOVA P = 0.0055, Tukey HSD ∗ | |
|---|---|---|---|---|---|---|---|---|
| QuickScan+ | 4 | 5 | 8 | 8 | 9 | 11 | 8 | C |
| QuickScan | 20 | 23 | 34 | 39 | 43 | 54 | 36 | BC |
| Standard | 32 | 44 | 61 | 70 | 79 | 85 | 62 | B |
| High resolution | 65 | 85 | 127 | 148 | 159 | 171 | 126 | A |
| Average | 30 | 39 | 58 | 66 | 73 | 81 | 58 | |
| ANOVA P <0.0001, Tukey HSD ∗ | C | BC | ABC | ABC | AB | A |
∗ Levels not connected by same letter are significantly different.
Table IV highlights the effective dose results for the child phantom. The Tukey HSD test demonstrated that the each scan protocol was significantly different from the other protocols with increasing doses in order of QuickScan+, QuickScan, and standard protocols. Maxillary FOVs produced statistically lower doses than the arch + temporomandibular joint and the 13 × 16-cm cephalometric views.
| Maxilla | Dental | Mandible | Both arches | Arches + TMJ | Standard ceph | Average | ANOVA P = 0.0167, Tukey HSD ∗ | |
|---|---|---|---|---|---|---|---|---|
| QuickScan+ | 5 | 7 | 9 | 12 | 13 | 18 | 11 | A |
| QuickScan | 23 | 34 | 43 | 50 | 56 | 70 | 46 | B |
| Standard | 39 | 60 | 73 | 85 | 115 | 120 | 82 | C |
| Average | 22 | 34 | 42 | 49 | 61 | 69 | 46 | |
| ANOVA P <0.0001, Tukey HSD ∗ | B | AB | AB | AB | A | A |
∗ Levels not connected by same letter are significantly different.
Figure 7 is a graphic representation of the data in Table III . Figure 8 is a graphic representation of the data in Table IV .
Stay updated, free dental videos. Join our Telegram channel
VIDEdental - Online dental courses


