Introduction
Facial convexity related to bimaxillary protrusion is prevalent in many populations. Underlying skeletal protrusion combined with increased dentoalveolar protrusion contributes to facial muscle imbalance and lip incompetence, which is undesirable for many patients. In this study, we evaluated the relationship between soft-tissue and hard-tissue changes in an orthodontically treated Asian population.
Methods
Twenty-four consecutive adult Asian patients (mean age, 24 years), diagnosed with severe bimaxillary dentoalveolar protrusion, were evaluated using pretreatment and posttreatment cone-beam computed tomography. The patients were treated with 4 first premolar extractions followed by anterior retraction with either skeletal or intraoral anchorage. Serial cone-beam computed tomography radiographs were registered on the entire cranial base and fossa. Soft-tissue and hard-tissue changes were determined through landmark displacement and color mapping.
Results
Upper lip retraction was concentrated between the nasolabial folds and commissures. Lower lip retraction was accompanied by significant redistribution of soft tissues at pogonion. Soft-tissue changes correlated well with regional facial muscle activity. Significant retractions (2-4 mm) of the soft tissues occurred beyond the midsagittal region. Use of skeletal anchorage resulted in 1.5 mm greater lower lip retraction than intraoral anchorage, with greater retraction of the maxillary and mandibular incisor root apices.
Conclusions
Profound soft-tissue changes accompanied retraction of the anterior dentition with both treatment modalities.
Bimaxillary protrusion is a common dentofacial trait particularly prevalent in Asian and African populations and present in almost every ethnic group. Underlying skeletal prognathism and dentoalveolar protrusion produce a convex lower facial profile, procumbent lips, and a protrusive anterior dentition, often resulting in lip incompetence, mentalis strain, and excessive gingival display. This situation is esthetically unacceptable to some patients, and they seek treatment by an orthodontist or oral surgeon. Both orthodontic and surgical treatments can improve facial balance. Orthodontic treatment can correct dentoalveolar protrusion by uprighting and retracting the anterior teeth, typically after the extraction of 4 premolars. Surgical treatment reduces protrusion by repositioning segments of the jaws. Both treatment approaches can reduce facial convexity and improve lip posture significantly.
Improvement of the soft-tissue profile depends on many variables related to the anatomy of the face, including lip thickness, facial muscle activity, and ethnicity. The relationship between dentoalveolar movement and soft-tissue change is complex and contingent on soft-tissue relationships in all 3 planes of space. Previous studies have focused on lip changes only in the midsagittal plane, using superimposed lateral cephalograms and facial photos. However, the 2-dimensional approach fails to consider the complex 3-dimensional (3D) geometry of the human face. In particular, soft-tissue changes in the frontal view are judged more severely by patients but are often overlooked in clinical studies. Computer simulations that predict soft-tissue changes from orthodontic and surgical movement rely on relationships derived from the midsagittal plane. Accurate treatment predictions require data on the 3D relationships between hard-tissue and soft-tissue changes. Advances in 3D imaging with cone-beam computed tomography (CBCT) and 3D photography can be used for global evaluation of these changes.
This study was designed to evaluate the 3D changes in soft tissues resulting from hard-tissue changes produced by orthodontic treatment of bimaxillary protrusion. The goals were to (1) characterize the 3D changes to the face and skeleton resulting from retraction of the anterior teeth, (2) identify and quantify relationships between incisor and lip movement outside the midsagittal plane, and (3) test differences in results using skeletal and nonskeletal anchorage mechanics in the treatment of bimaxillary protrusion.
Material and methods
The study population consisted of 24 consecutive nongrowing Asian patients with bimaxillary dentoalveolar protrusion treated in the orthodontic clinic at the University of California, San Francisco. All were treated with extraction of 4 first premolars and retraction of the anterior dentition using controlled maxillary anchorage. Institutional review board approval for the study was obtained from the University of California before treatment.
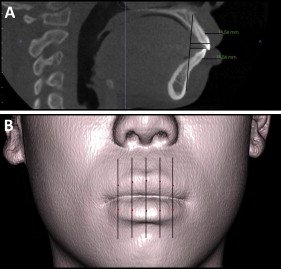
The inclusion criteria for the patients were Class I molar and canine relationships, mild or no crowding, severe dentoalveolar protrusion, and complete pretreatment and posttreatment CBCT radiographs and photos. Only Asian adults were included. The group was mostly female (n = 20), with ages ranging from 20 to 29 years. Initial protrusion was quantified by measuring the distance between the most anterior point on the maxillary and mandibular incisors to the A-point–pogonion along a line parallel to the Frankfort horizontal ( Fig 1 , A ). Lip thickness was measured from the cervical aspect of the maxillary and mandibular incisors to the most anterior point on the upper and lower lips (labrale superius and labrale inferius), respectively ( Fig 1 , A ). All patients had greater than 2 SD of protrusion of the maxillary and mandibular incisors relative to Asian means ( Table I ). The degrees of maxillary and mandibular incisor protrusion, skeletal protrusion (defined by SNA and SNB angles), sagittal jaw relationship (defined by ANB angle), lip thickness, and maxillary and mandibular crowding were similar between the treatment groups ( Table I ). The differences were not statistically significant ( P >0.05).
| Nonskeletal anchorage mean (SD) | Skeletal anchorage mean (SD) | P value | |
|---|---|---|---|
| U1i-A Pg (mm) | 10.67 (2.38) | 11.58 (2.57) | 0.68 |
| L1i-A Pg (mm) | 6.43 (3.19) | 6.81 (3.26) | 0.91 |
| SN/MP (°) | 34.02 (5.84) | 36.22 (5.64) | 0.40 |
| U1/PP (°) | 122.10 (6.70) | 119.58 (5.74) | 0.45 |
| L1/MP (°) | 99.40 (5.35) | 98.23 (4.98) | 0.62 |
| SNA (°) | 83.79 (3.81) | 83.29 (4.10) | 0.45 |
| SNB (°) | 80.35 (4.42) | 80.34 (3.45) | 0.91 |
| Maxillary crowding (mm) | −3.90 (2.02) | −3.85 (0.84) | 0.94 |
| Mandibular crowding (mm) | −2.60 (0.75) | −2.85 (0.57) | 0.99 |
| UL thickness (mm) | 11.59 (1.45) | 10.65 (2.59) | 0.33 |
| LL thickness (mm) | 12.62 (1.64) | 12.88 (2.08) | 0.71 |
| Age (y) | 21.6 (7.1) | 27.4 (7.9) | 0.10 |
| Sex (% female) | 91 | 70 | 0.22 |
Patients meeting the inclusion criteria were divided into 2 treatment groups based on the type of anchorage used. Both groups were treated with extraction of 4 first premolars and full fixed appliances with an 0.018-in slot and twin brackets (3M Unitek, Monrovia, Calif; or Ensignia; Ormco, Orange, Calif). After the resolution of anterior crowding, the mandibular anterior teeth were retracted en masse in both groups as shown ( Fig 2 ). In the skeletal anchorage group (n = 11), bilateral C-tube temporary skeletal anchorage miniplates were placed mesially to the maxillary first molar ( Fig 2 ). The maxillary anterior teeth were then retracted en masse on a 0.016 × 0.022-in stainless steel archwire using elastomeric chain ligated from the C-tube to a canine retraction arm placed close to the height of the center of resistance. In the nonskeletal anchorage group (n = 13), the maxillary canines were first retracted segmentally on a 0.016 × 0.022-in stainless steel archwire using a soldered 0.032-instainless steel transpalatal archbar or arch between the maxillary first molars for anchorage ( Fig 2 ). After retraction of the canines, the maxillary incisors were retracted en masse using intrusion-retraction loops placed distally to the lateral incisors. Finishing was performed on a 0.0175-in square stainless steel archwire.

CBCT scans were taken at pretreatment and posttreatment using a CB MercuRay machine (Hitachi, Tokyo, Japan). Both scans were taken with the patient in maximum intercuspation with the lips and face in repose, as instructed by the technician. A scan captured 512 images with a 12-in diameter spherical volume encompassing the face, jaws, and entire cranial base. The voxel dimension was 0.376 mm 3 . DICOM data sets were converted into Amira mesh files (Visage Imaging, San Diego, Calif) and manipulated with the Amira software (version 5.4.2, Visage Imaging).
The pretreatment and posttreatment scans were registered on stable structures in the cranial base. Regions of the scan volumes were individually defined as a reference, masking structures outside the volume. This region included the entire cranial base, zygomatic arches, maxillary sinuses, frontal bone, and posterior cranial fossa ( Fig 3 ). These structures are stable in nongrowing patients. The masked posttreatment volume was then reoriented via isometric rigid translation and rotation onto the cranial base of the pretreatment scan using an automated, voxel-based algorithm that maximizes mutual information between the volumes.
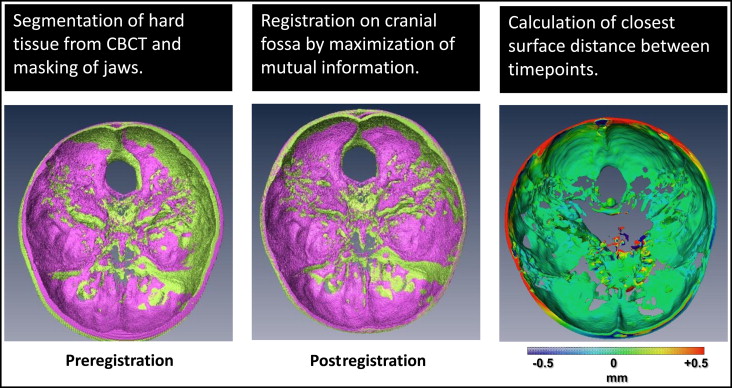
After the volumes were registered on the cranial base, the hard-tissue skeleton and exterior soft-tissue surface were isolated using voxel-value based segmentation. The segmentation values were selected for optimal rendering and kept constant for all time points and patients. Triangular mesh surfaces were then generated representing the skeleton, teeth, and exterior facial soft tissues. To quantify the relative changes between the pretreatment and posttreatment surfaces, vectors were calculated from each vertex on the pretreatment surface to the nearest point on the posttreatment surface, with a length equal to the Euclidean distance between the points. To determine the degree of change relative to the surface, the component of the vector perpendicular to the pretreatment surface was calculated, representing either outward (positive) or inward (negative) displacement of the surface. Surface distances were converted into a color scale, with longer wavelength colors (red) representing inward displacement, and shorter wavelength colors (blue) representing outward displacement ( Fig 3 ). Green indicated no displacement. The color maps are a global approximation of actual surface displacements.
The accuracy of the cranial base registration was verified by visualizing the surface displacement map of the interior surface of the cranial fossa. The only deviation occurred at the boundary of the scans, which are not identical because of differences in patient orientation. Based on the color scale, differences between the surfaces was less than 0.5 mm over the region of the cranial fossa. CBCT registrations were repeated by 2 independent observers (R.C.S. and R.M.) to verify consistency. Two-dimensional slices were taken through the maxillary and ethmoid sinuses to confirm the superimposition of the trabeculae and finer structures in the sinus.
To quantify absolute changes to the dentition and soft tissues, landmark points were defined on the teeth and lips with InVivo software (InvivoDental5.0; Anatomage, San Jose, Calif). A coordinate system was constructed using an adjusted Frankfort horizontal plane passing through sella prime, right porion, and right orbitale. Orthogonal vertical planes passing through nasion were defined relative to the horizontal. Twelve hard-tissue landmarks were selected on the segmented surfaces of the skull and teeth. These landmarks included the right and left maxillary and mandibular central incisor edges and root apices, and the maxillary and mandibular first molar crowns and mesiobuccal root apices. Ten soft-tissue landmarks were defined by dividing the lips into 5 equally spaced slices spanning the intercommissure length ( Fig 1 , B ). The most anterior points on the upper and lower lips were landmarked in each sagittal section ( Fig 1 , B ). Vectors were then determined at each landmark between the pretreatment and posttreatment surfaces, representing movement at each location between time points. A separate mandibular superimposition using established stable structures was performed to measure the movement of the mandibular incisors.
Digital 2-dimensional cephalometric tracings were generated and superimposed on the cranial base by using TIOPS software (Roskilde, Denmark; www.tiops.com ). Lateral cephalograms were generated from the CBCT data with Dolphin software (version 11.7; Dolphin Imaging, Chatsworth, Calif).
Statistical analysis
Displacement vectors for landmarks on the central incisors and lips were determined between pretreatment and posttreatment on the CBCT radiographs. The inclination changes of the incisors were measured as the change in axial inclination between pretreatment and posttreatment. The vertical and anteroposterior components of each vector were averaged between the right and left incisors. The anteroposterior components of lip movement were averaged across 5 planes spanning the intercommissure length for the upper and lower lips to determine the average anteroposterior movement for each lip.
The validity of superimposition and landmark placement was determined by having 2 independent observers (R.C.S. and R.M.) perform multiple observations on the records of 10 randomly selected patients from the combined groups. These calibrated observers repeated superimposition and landmark placement at 2-week intervals to determine interobserver and intraobserver errors. The variability in the anteroposterior and vertical components of the displacement vectors between observations was used to calculate intraclass correlation coefficients to test reliability. These values for intraobserver and interobserver correlations were all greater than 0.85. In addition, Bland-Altman plots were made to analyze the interobserver differences. Histograms were constructed for all variables to assess normality. Because of the small sample size and the lack of normality, nonparametric methods were used. Intergroup differences were compared using the Wilcoxon rank sum test. Interactions between variables were mostly linear, as determined from testing in linear and quadratic models. The nonparametric Spearman rank correlation coefficient was calculated for each comparison and adjusted for multiple comparisons using the Holm-Sidak correction. The Stata software package (StataCorp, College Station, Tex) was used for statistical calculations.
Results
The profiles of our patients were characterized by convexity of the lower facial third. The typical lip profile was protrusive, demonstrating either mentalis strain or an interlabial gap at rest. The variability in lip thickness was relatively low in the population (mean SD of 1.94 mm). Crowding was mild (<4 mm) in each arch and not significantly different between groups ( Table I ). The skeletal sagittal jaw relationship was within normal limits in both groups. There were no statistically significant ( P >0.05) differences in the dental or skeletal parameters between the groups.
The maxillary incisor edges were retracted 1.47 mm more posteriorly on average in the skeletal anchorage group than in the nonskeletal group ( P = 0.13; Table II ). The root apices of the maxillary incisors in the skeletal anchorage group were retracted approximately 0.9 mm on average, with little apical root retraction in the nonskeletal anchorage group ( P = 0.053; Table II ). This movement was accompanied by 3.36° of greater reduction on average in maxillary incisor proclination in the nonskeletal anchorage group. These differences, however, were not statistically significant with the available sample size. Movement of the maxillary incisor edge followed a consistent inferior and posterior vector, with a high degree of correlation between anteroposterior and vertical movement ( P = 0.0005; Table III ). The sagittal and vertical movements of the maxillary incisors were highly correlated with the degrees of retroclination ( P = 0.0002; Table III ), indicating primarily an apex-centered tipping movement, especially in the nonskeletal anchorage group.
| Mean movement (pretreatment-posttreatment) | Nonskeletal anchorage | Skeletal anchorage | Difference | P value |
|---|---|---|---|---|
| Mean (SD) | Mean (SD) | |||
| UL retraction (mm) | 2.26 (0.33) | 2.67 (0.36) | −0.49 | NS |
| LL retraction (mm) | 2.63 (0.40) | 4.12 (0.73) | −1.49 | 0.051 |
| U1i retraction (mm) | 4.16 (0.74) | 5.63 (0.66) | −1.47 | 0.13 |
| U1i extrusion (mm) | 1.79 (0.37) | 1.84 (0.37) | −0.04 | NS |
| U1 root retraction (mm) | −0.081 (0.33) | 0.89 (0.47) | −0.97 | 0.053 |
| L1i retraction (mm) | 3.39 (0.74) | 3.14 (0.71) | −0.25 | NS |
| L1i intrusion (mm) | 0.40 (0.23) | 0.54 (0.37) | −0.13 | NS |
| U1 retroclination (°) | 13.18 (2.60) | 9.82 (1.59) | −3.36 | NS |
| L1 retroclination (°) | 8.75 (1.45) | 9.89 (1.72) | −1.14 | NS |
| U6 crown A-P (mm) | 1.95 (0.40) | −0.45 (0.55) | 2.40 | 0.008 ∗ |
| U6 root A-P (mm) | 1.81 (0.33) | −0.53 (0.32) | 2.34 | 0.0004 ∗ |
| U6 crown extrusion (mm) | 0.02 (0.23) | 0.83 (0.46) | −0.81 | 0.17 |
| UL ret | LL ret | U1i y | U1i z | U1 retro | L1 retro | L1i y | L1i z | |
|---|---|---|---|---|---|---|---|---|
| UL ret | – | 0.69 | 0.74 ∗ | −0.60 | 0.53 | 0.26 | 0.63 | −0.27 |
| LL ret | 0.08 | – | 0.52 | −0.24 | 0.26 | 0.30 | 0.71 ∗ | −0.14 |
| U1i y | 0.02 ∗ | 0.50 | – | −0.81 ∗ | 0.83 ∗ | 0.25 | 0.51 | −0.36 |
| U1i z | 0.16 | NS | 0.0005 ∗ | – | −0.89 ∗ | −0.05 | −0.30 | 0.44 |
| U1 retro | NS | NS | 0.0002 ∗ | <0.0001 ∗ | – | 0.13 | 0.25 | −0.36 |
| L1 retro | NS | NS | NS | NS | NS | – | 0.23 | −0.14 |
| L1i y | 0.10 | 0.016 ∗ | NS | NS | NS | NS | – | −0.10 |
| L1i z | NS | NS | NS | NS | NS | NS | NS | – |
Stay updated, free dental videos. Join our Telegram channel
VIDEdental - Online dental courses


