Introduction
The aim of this study was to use cone-beam computed tomography to compare changes of skeletal and dental structures of the maxillary palatal vault in a group of growing patients treated for posterior crossbite before and after rapid palatal expansion (RPE) with changes over time in a control group.
Methods
The sample for this retrospective study included 19 patients treated with a hyrax palatal expander at a graduate orthodontic clinic and 19 control subjects who received no RPE. Beginning and progress cone-beam computed tomography scans of all patients were analyzed to measure the anatomic volume, width, height, and anteroposterior dimensions of the palatal region.
Results
Progress scans (after RPE treatment for cases) showed, the mean percentages of change in palatal volume were 10.8% in the controls and 21.7% in the RPE group ( P = 0.038); however, there were no statistically significant differences in palatal volume at baseline or at progress scan between the RPE patients and controls. Absolute first molar-to-molar width changes at progress scan were 0.57 mm in the controls and 3.27 mm in the RPE group ( P = 0.022). Absolute canine-to-canine width changes at progress scan were 0.45 mm in the controls and 2.79 mm in the RPE group ( P = 0.007). There were significant differences in percentage and absolute changes in maxillary width measured from molar to molar and canine to canine between RPE group and controls, but no significant differences in maxillary vault height or anteroposterior dimension changes.
Conclusions
At progress scan, canine-to-canine width, first molar-to-molar width, and anteroposterior length of the palatal maxillary volume in the RPE group approached the measurements of the controls. Palatal volumes (at baseline and progress scan) were not statistically significantly different between the groups.
Transverse maxillary deficiencies can create clinical esthetic and functional problems in both the maxilla and the mandible; the most common manifestation is a posterior crossbite. Posterior crossbites are a relatively common pathology with a reported prevalence of 7% to 23% in American and European populations. Rapid palatal expansion (RPE) treatment has been used to correct dental and skeletal discrepancies in patients with constricted maxillary arches since the early 1900s. There are well-established data to prove that the transverse maxillary width increases with RPE treatment, but it is less clear what occurs with the anteroposterior (AP), inferior-superior, and volumetric dimensions of the palatal area.
Typically, maxillary molar-to-molar width (the linear distance from the maxillary first molar to the maxillary first molar) increases have been measured in 2 ways: internally on dental casts by using soft-tissue landmarks and laterally on posteroanterior (PA) cephalometric radiographs by using the lateral or buccal surface of the maxillary first molars. Previous reports cite molar-to-molar width increases with RPE treatment in the range of 6.5 to 9.5 mm. Molar-to-molar width in the buccolingual dimension is measured at various locations on the casts and might account for some variations in the measurements. Molar-to-molar width measured on PA cephalometric radiographs ranged from 3.2 to 5.5 mm over the controls. More recently, Garib et al used computed tomography to measure the maxillary width between the lingual alveolar crests at the middle of the maxillary molar. They found that the dental arch at the lingual alveolar crest level had an increased width of approximately 4.3 mm with RPE treatment. However, the significant disadvantage of that study was that their sample size with the hyrax appliance was only 4 female patients.
Authors have actively debated the inferior or superior characteristics of the expanding the palate. From the early to mid-1900s, it was believed that the palatine processes were lowered as a result of the expanding alveolar processes; RPE caused lowering of the roof of the palatal vault. Other studies, by using tracings of plaster casts, found that palatal vault height appeared to remain constant or was elevated during growth, but there was no relationship between molar-to-molar width and height of the palatal vault.
More recently, RPE treatment has been used for reasons other than to correct a maxillary transverse deficiency: eg, an arch-length deficiency. However, RPE in these cases is used to treat an arch perimeter insufficiency rather than a true, absolute AP deficiency. RPE treatment can widen the maxillary arch and provide additional space of approximately 3 to 4 mm to relieve crowding.
Most previous research has attempted to evaluate the 3-dimensional (3D) effects of RPE, but these evaluation methods used 2-dimensional cephalometric films or plaster casts. The 3D characteristics—ie, volume—of the palatal area are an important area of study because an increase in volume could result in more space for the tongue. Patients with constricted maxillary arches tend to carry the tongue in a low position, and, when the tongue has more room, it might be more likely to stay in the palatal region, thus reducing low or forward tongue position. However, any 2-dimensional data cannot accurately depict the detailed 3D changes in the maxilla with RPE.
The overall purpose of this study was to compare the 3D changes of skeletal and dental structures in a group of growing patients treated for maxillary constriction before and after RPE with an age-matched, orthodontically only treated control group, by using cone-beam computed tomography (CBCT) 3D imaging. RPE increases the maxillary arch width with both orthodontic (tipping and bodily translation) and orthopedic (bony separation and remodeling at the suture) effects. The effect of archwire treatment alone is orthodontic. Therefore, we can evaluate the RPE effects of orthopedic change in the RPE patients and evaluate whether these changes increase the volume of the palatal vault region over that which would be normally seen with regular orthodontic treatment. Our groups were matched by age to minimize the confounding effect of growth. Secondarily, we evaluated changes in width, height, and AP length of the maxillary region in both groups.
Material and methods
In this retrospective study, all healthy patients who fulfilled the following inclusion criteria were selected as subjects for the study: (1) required RPE treatment for a bilateral or unilateral posterior crossbite, (2) required orthodontic treatment, and (3) had CBCT beginning and progress scans between July 2003 and July 2007. All healthy patients who fulfilled the following criteria were selected as controls: (1) orthodontic treatment only (no RPE), (2) no posterior crossbite (defined as palatal cusp of the maxillary posterior tooth in lingual position in relation to the mandibular opposing posterior tooth), (3) CBCT beginning and progress scans, and (4) matched a subject in the RPE group in age. As a result, the RPE group (mean age, 12.9 years; range, 8.8-15.8 years; 6 boys, 13 girls) and the control group (mean age, 12.8 years; range, 8.6-15.8 years; 7 boys, 12 girls) each had 19 subjects, matched by age and similar sex distribution ( Table I ). All patients were thought to be growing before fusion of the midpalatal suture, based on age and clinical judgment. All patients were in the late transitional or early permanent dentition stage. The patients had no craniofacial abnormalities and were not scheduled for surgical or extraction treatment. This retrospective study was approved by the University of Southern California IRB #UP-06-00217.
| Parameter | RPE group Mean ± SD (n = 19) |
Control group Mean ± SD (n = 19) |
P value † | Difference ∗ Mean ± SD (95% CI) |
|---|---|---|---|---|
| Age (y) | 13.0 ± 1.90 | 13.0 ± 1.48 | 0.939 | -0.0 ± 1.70 (−1.2, 1.1) |
| Sex (n) | 13 girls, 6 boys | 12 girls, 7 boys | 0.732 | |
| Beginning scan parameters | ||||
| Palatal volume (mm 3 ) | 14,514 ± 4702 | 16,323 ± 3,848.4 | 0.203 | 1808.1 ± 4296.8 (–1019, 4636) |
| First molar width (mm) | 34.6 ± 3.93 | 36.0 ± 2.88 | 0.212 | 1.4 ± 3.45 (–0.8, 3.7) |
| Canine width (mm) ‡ | 21.7 ± 3.25 | 23.9 ± 1.57 | 0.022 | 2.2 ± 2.52 (0.5, 4.0) |
| Height (mm) | 12.7 ± 3.37 | 12.1 ± 2.18 | 0.514 | −0.6 ± 2.83 (–2.5, 1.3) |
| Tallest height (mm) | 13.2 ± 3.15 | 12.8 ± 2.16 | 0.687 | −0.4 ± 2.7 (–2.1, 1.42) |
| AP length (mm) | 46.28 ± 3.41 | 48.5 ± 4.16 | 0.081 | 2.2 ± 3.80 (–0.29, 4.71) |
| Midpoint progress scan-treatment parameters | ||||
| Palatal volume (mm 3 ) | 17,241 ± 4692.1 | 18,022 ± 4181.6 | 0.591 | 781.0 ± 4444.2 (–2143, 3705) |
| Molar-to-molar width (mm) | 37.8 ± 3.79 | 36.6 ±2.85 | 0.245 | −1.3 ± 3.35 (–3.5, 0.9) |
| Canine-to-canine width (mm) § | 24.3 ± 2.74 | 24.4 ± 1.29 | 0.893 | 0.1 ± 2.13 (–1.3, 1.5) |
| Height (mm) | 13.9 ± 3.08 | 13.3 ±2.61 | 0.546 | −0.6 ± 2.86 (–2.4, 1.3) |
| Tallest height (mm) | 14.2 ± 3.29 | 14.0 ±2.54 | 0.839 | −0.2 ± 2.94 (–2.1, 1.7) |
| AP length (mm) | 47.6 ± 2.53 | 49.6 ± 4.12 | 0.084 | 1.99 ± 3.42 (–0.3, 4.2) |
∗ Data presented as means ± standard deviations for the continuous variables. Difference = controls – RPE
† P values obtained from the Pearson chi-square test for sex and independent t tests for the continuous variables
‡ There were 18 control subjects and16 RPE patients because of unerupted canines
§ There were 19 control subjects and 18 RPE patients because of unerupted canines.
Patients in the RPE group had a hyrax-type palatal expander banded on the maxillary first premolars and first molars. They were monitored weekly for appropriate activation of the appliance. Expanders were turned once a day (1/4 mm per turn) until the required expansion was achieved—ie, slight overcorrection of the crossbite defined as the palatal cusp of the maxillary first molar occluded with the buccal cusp of the mandibular first molar (average time, 4-6 weeks)—and then were stabilized. A hyrax-type RPE or a transpalatal arch was used for retention for at least 3 months postexpansion. Most patients with RPE had no orthodontic treatment until after the fixed retention period, but several had 2 × 4 appliances, standard edgewise preadjusted MBT brackets with a 0.022-in slot, during the fixed retention period. The control patients started orthodontic treatment within 6 months of the RPE group and had full braces placed (standard edgewise preadjusted MBT brackets with a 0.022-in slot). CBCT scans of all patients were taken as part of both beginning records and progress records (at the midpoint of the total treatment time). The times between the beginning and progress scan were not statistically significantly different ( P = 0.34) between the RPE group (mean, 18.0 ± 4.03 months; range, 11.5-24.6 months) and the control group (mean, 16.7 ± 4.51 months; range, 11.0-30.6 months). The CBCT (NewTom 3G, QR Verona, Italy) imaging system used in this study has an overall effective absorbed dose of radiation of 57 μSv, and the scanning time was 36 seconds. Traditional film panoramic radiographs result in an absorbed dose of radiation of 6 μSv, and a full-mouth series has a range of absorbed dose of radiation from 33 to 84 μSv to 14 to 100 μSv, depending on variables such as film speed, technique, kilovolt (peak), and collimation. The patients were scanned in the supine position with the Frankfort plane perpendicular to the floor. The DICOM data were imported into the imaging software Vworks (version 5.0, Cybermed, Seoul, Korea) and used for the measurements described below.
Standardization of head position between scans was achieved by measuring the angle between the line, anterior nasal spine to posterior nasal spine, and the vertical on the beginning scan and matching this to the progress scan (by reslicing the volume according to the beginning head angulation). After this process, the mean differences in head inclination between the beginning and progress scans were 0.2° for the controls and 0.83° for the RPE patients, with no statistically significant differences between the groups ( P = 0.25).
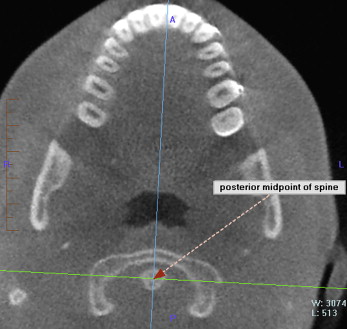
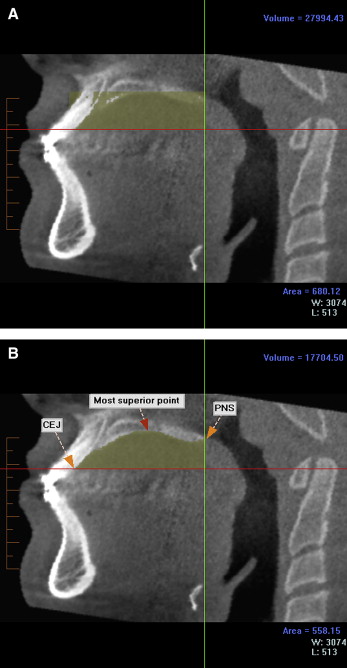
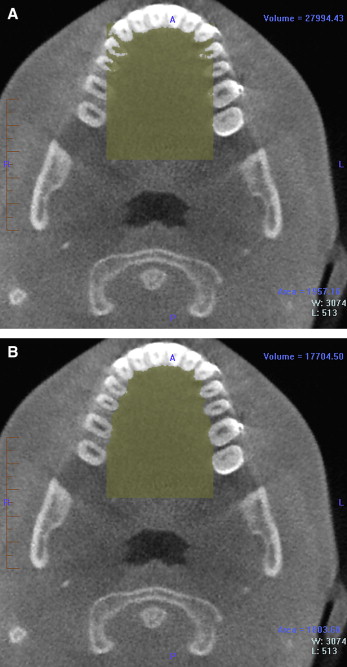
To define the palatal volume area of interest, a crude square prism was defined first to outline the general area, and, based on that, an anatomically well-defined hand-traced volume was created. To orient the prism angulation, the patient’s midsagittal plane was defined as the anterior midpoint of the 2 maxillary incisors and the posterior midpoint of the spine ( Fig 1 ). The borders of the crude prism containing the palatal volume were defined as follows: (1) the superior border was defined on the midsagittal image as the most superior point of the palatal vault ( Fig 2 , A ); (2) the inferior border was defined as the inferior cementoenamel junction (CEJ) of the central incisors ( Fig 2 , A ); (3) the anterior border was defined as the inferior CEJ of the central incisors ( Fig 2 , A ); (4) the posterior border was the posterior nasal spine, the most posterior border of the bony hard palate ( Fig 2 , A ); and (5) the lateral borders were defined on the axial section by the most mesial portion of the second molars at the CEJ ( Fig 3 , A ). A coronal section of the palatal volume can be seen in Figure 4 , A .
Stay updated, free dental videos. Join our Telegram channel
VIDEdental - Online dental courses


