Introduction
In this retrospective study with 3-dimensional computed tomography, we evaluated airway volume, soft-palate area, and soft-tissue thickness changes before and after rapid maxillary expansion in adolescents. Another purpose was to determine whether rapid maxillary expansion caused changes in the palatal and mandibular planes and facial height.
Methods
The sample comprised 20 patients who were treated with rapid maxillary expansion. Spiral tomographs were taken before and 3 months after treatment. Reliability studies were performed, and then volumetric, soft-palate area, soft-tissue thickness, and cephalometric parameters were compared on the tomographs. Intraclass correlations were performed on the reliability measurements. Before and after rapid maxillary expansion measurements were compared by using Wilcoxon signed rank tests. Spearman correlation coefficients were used to evaluate the associations among the airway volume, soft-palate area, soft-tissue thickness, and cephalometric measurements. Significance was accepted at P ≤0.05 for all tests.
Results
Intraclass correlation coefficients were ≥0.90 for all reliability measures. Significant increases from before to after rapid maxillary expansion were found in nasal cavity and nasopharynx volumes, and for the measurements of MP-SN, S-PNS, N-ANS, ANS-Me, and N-Me. Significant positive correlations existed between changes in PP-SN and N-ANS, and ANS-Me and N-Me.
Conclusions
Rapid maxillary expansion causes significant increases in nasal cavity volume, nasopharynx volume, anterior and posterior facial heights, and palatal and mandibular planes.
Rapid maxillary expansion (RME) is an orthodontic and orthopedic treatment option to correct posterior crossbites and maxillary transverse deficiencies. Rigid, fixed RME appliances produce heavy forces that result in skeletal or orthopedic expansion and also dentoalveolar changes. When the maxillary dental arch is rapidly expanded, the maxillary and palatine bones disarticulate along the midpalatal suture, and there are also changes to the frontomaxillary, zygomaticomaxillary, zygomaticotemporal, and pterygopalatine sutures. Stress distribution and displacement pattern studies have evaluated the effects of RME on the craniofacial complex. A finite element analysis showed minimum displacement of the pterygoid plates near the cranial base and maximum displacement in the areas of the maxillary central incisors and the anteroinferior border of the nasal septum. Jafari et al also demonstrated that the lateral structures of the nasomaxillary complex moved upward, and midline structures, including ANS and A-point, moved downward. Garrett et al confirmed clinically that midpalatal sutural separation occurred in a triangular pattern with the wider base in the anterior part of the maxilla, and the effects of RME extended to the surrounding nasal and craniofacial structures.
According to Moss’s functional matrix theory, during breathing, a continuous flow of air through the nasal passages produces a constant stimulus for lateral growth of the maxilla and lowering of the palatal vault. It is assumed that widening of the nasal passages will produce improved breathing. Gungor and Turkkahraman reviewed the literature evaluating the interaction between respiratory function and maxillary growth pattern. They showed maxillary morphologic differences between subjects with airway problems and the control groups; this suggested a potential etiologic role of the airway in these subjects. RME also caused a significant increase in nasal width and a decrease in maxillary sinus width. Numerous studies have evaluated the effects of maxillary expansion on the airway and found increases in nasal width and volume, leading to decreased nasal resistance. These findings could be used to recommend future treatment of subjects with constricted airways.
Airway changes after RME have been studied with acoustic rhinometry, 2 dimensionally (cephalometric methods), and 3 dimensionally (cone-beam computed tomography, computed tomography). Although there are many studies evaluating the skeletal effects of RME, so far only Zhao et al have evaluated the 3-dimensional airway volume changes after RME on the upper airway in control and experimental groups. Therefore, the primary purpose of this retrospective study was to evaluate the airway volume, soft-palate area, and soft-tissue thickness changes before and after RME treatment in adolescent subjects by using 3-dimensional images obtained from computed tomography. The secondary purpose of this study was to determine whether RME causes changes in the palatal and mandibular planes, and in anterior facial height.
Material and methods
Pretreatment and posttreatment spiral computed tomography images (Xvision EX; Toshiba Medical Systems, Otawara-Shi, Japan) from 20 patients treated with RME were analyzed. The scans were made at 120 kV and 20 mA by using the following protocol: 25-cm field of view, 0.4-mm voxel size, and 2 seconds per section. The scans were taken with the patients in supine position and the palatal plane perpendicular to the floor. The study was approved prospectively by the ethical committee of the Faculty of Dental Medicine, Al-Azhar University, Cairo, Egypt, and retrospectively by the institutional review board of Indiana University-Purdue University at Indianapolis. Inclusion criteria for the study were subjects with bilateral maxillary constriction; age between 8 and 15 years; no previous orthodontic or orthopedic treatment; no systemic diseases, craniofacial anomalies, or temporomandibular joint disorders; no tonsillectomy or adenoidectomy; no carious, gingival, or periodontal lesions; no metallic restorations; and RME planned as a part of comprehensive orthodontic treatment. Our subjects included 8 boys and 12 girls with an average age of 12.3 years ± 1.9 months. The RME appliance used was a Hyrax appliance (Dentaurum, Ispringen, Germany), which included bands on the permanent first molars and first premolars. If the premolars were not present, the bands were cemented to the deciduous first molars. The subjects were instructed to turn the appliance 2 times, twice daily (producing 0.8 mm of expansion daily) until the palatal cusps of the maxillary first molars contacted the buccal cusps of the mandibular first molars. Spiral computed tomography images were taken immediately before the RME and 3 months (91 ± 3.5 days) after the last activation of the appliance.
After training with the scanner (version 11.0; Dolphin Imaging, Chatsworth, Calif), the reliability of the primary investigator (T.S.) was determined by tracing 10 images twice. Since access to the original images was not available at the time, the intrareliability in detecting the anatomic landmarks was done with cone-beam computed tomography scans as the most practical alternative. This could be considered a deficiency in the study concerning the reliability test. Ten cone-beam computed tomographs were chosen randomly from the orthodontic records at the School of Dentistry of Indiana University and coded. Landmarks ( Table I ) were identified on the tomographs, and the airway volumes were calculated with the Dolphin software. All 10 images were traced again 2 weeks later in random order with the same computer and monitor. An intraclass correlation coefficient equal to or greater than 0.90 was required, or the process would have been repeated 2 weeks later.
| Anterior boundary | Posterior boundary | Superior boundary | Inferior boundary | |
|---|---|---|---|---|
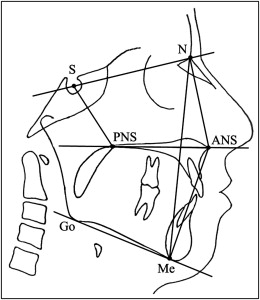
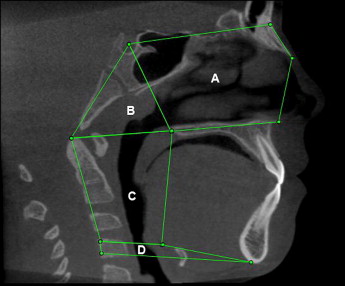
| Nasal cavity | Line connecting the anterior nasal spine (ANS) to the tip of the nasal bone to nasion (N) | Line extending from sella (S) to the posterior nasal spine (PNS) | Line connecting N to S | Line extending from the ANS to the PNS |
| Nasopharynx | Line extending from sella (S) to the posterior nasal spine (PNS) | Line extending from S to the tip of the odontoid process | Line extending from the PNS to tip of the odontoid process | |
| Oropharynx | Line extending from the posterior nasal spine (PNS) to the base of the epiglottis | Line extending from the tip of the odontoid process to the posterior-superior border of CV 4 | Line extending from the PNS to the tip of the odontoid process | Line extending from the base of the epiglottis to the posterior-superior border of CV 4 |
| Hypopharynx | Line extending from the base of the epiglottis to the inferior border of the symphysis | Line extending from the posterior-superior corner of CV 4 to the posterior-inferior corner of CV 4 | Line extending from the base of the epiglottis to the posterior-superior corner of CV 4 | Line extending from the posterior-inferior corner of CV 4 to the inferior border of the symphysis |
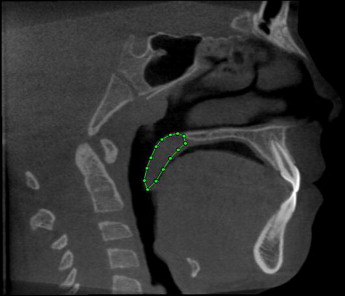
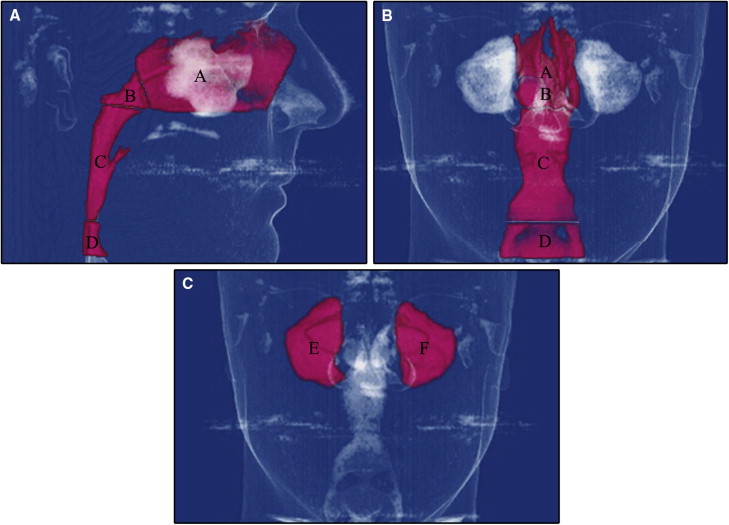
| Soft-palate area | Confined by the soft palate that starts and ends at PNS through the uvula tip | |||
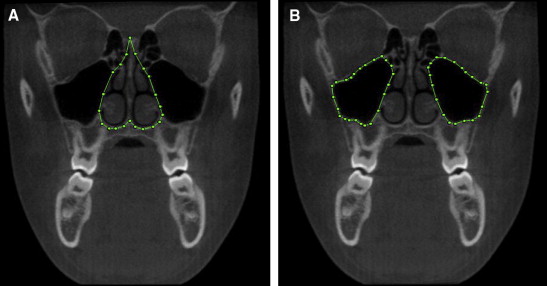
| Maxillary sinus | The superior, inferior, medial, and lateral aspects of the maxillary sinus as seen on a section including the maxillary first molar bifurcation | |||
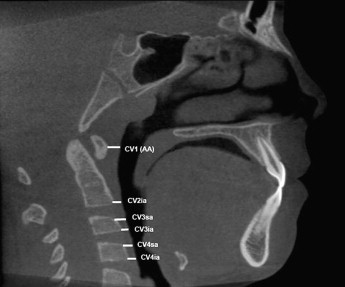
| The prevertebral soft-tissue thickness was measured as the distance parallel to the Frankfort horizontal plane from 6 points on the CV 1, CV 2, CV 3, and CV 4 to the posterior wall of the airway. Bony structure and soft tissue transposed on each other in midsagittal plane with the 3D Dolphin imaging system. | ||||
| • The most anterior point on the anterior arch of CV 1 | ||||
| • The most inferior-anterior point of CV 2 | ||||
| • The most superior-anterior point of CV 3 | ||||
| • The most inferior-anterior point of CV 3 | ||||
| • The most superior-anterior point of CV 4 | ||||
| • The most inferior-anterior point of CV 4 | ||||
Coded computed tomographs were analyzed by using the Dolphin 3D software, on the same computer and monitor (21-in monitor; Dell, Round Rock, Tex; 1680 × 1050 pixels). Although previous 2-dimensional studies have established anatomic landmarks for various airway parameters, 3-dimensional landmarks were required for the analysis of the airway volumes and areas in this study. The definitions for the airway parameters, volumetric analysis, and cephalometric measures are presented in Table I and Figures 1-6 .
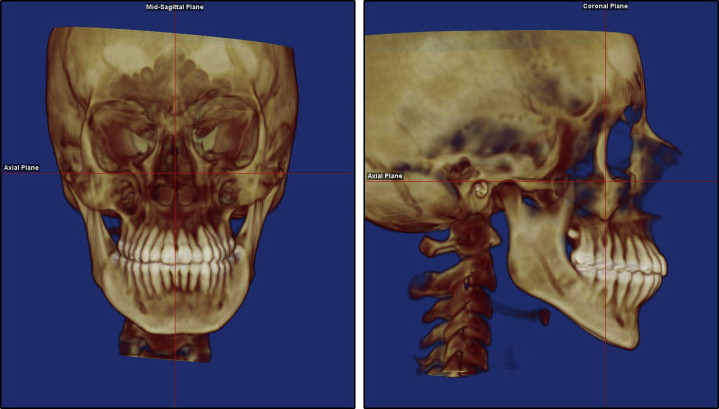
Before landmark identification, the 3-dimensional volumetric images were oriented with the Dolphin imaging software as follows: the midsagittal plane was adjusted on the skeletal midline of the face, the axial plane was adjusted to show the Frankfort horizontal plane (right porion to right orbitale), and the coronal plane was adjusted to pass through the level of the furcation point of the right maxillary first molar ( Fig 7 ).
Statistical analysis
Intrarater reliability was assessed by using Student t tests, intraclass correlation coefficients, and Bland-Altman plots. The volumes (maxillary sinuses, nasal cavity, nasopharynx, oropharynx, and hypopharynx), surface area measurement (soft palate), soft-tissue thickness, and the cephalometric parameters (PP-SN, MP-SN, S-PNS, N-ANS, ANS-Me, and N-Me) before and after RME, and the changes (before to after RME) were summarized with descriptive statistics (means and standard deviations).
Because the before to after RME changes in the measurements were not normally distributed, comparisons between these measurements were made by using Wilcoxon signed rank tests. A P value of ≤0.05 was considered statistically significant for both tests. Spearman correlation coefficients were calculated to evaluate the associations among airway volume, soft-palate area, soft-tissue thickness, and cephalometric measurements. All tests were conducted at a 5% significance level with no adjustment for multiple testing. With this sample size, the study had 80% power testing at a 5% significance level to detect a correlation coefficient of 0.55 and a 0.7 SD difference of the before and after RME changes.
Results
The intraexaminer reliability test showed no statistically significant differences between the readings (except for PP-SN and ANS-Me) and excellent intraexaminer reliability (intraclass correlation coefficient, ≥0.90) for all measurements ( Table II ).
| First reading, mean (SE) | Second reading, mean (SE) | Difference, mean (SE) | P value | Intraclass correlation | |
|---|---|---|---|---|---|
| Nasal cavity volume (mm 3 ) | 20048 (1715) | 20101 (1715) | 53 (97) | 0.59 | 1.00 |
| Nasopharynx volume (mm 3 ) | 5117 (889) | 5135 (889) | 18 (50) | 0.73 | 1.00 |
| Oropharynx volume (mm 3 ) | 12643 (1710) | 12876 (1710) | 233 (183) | 0.23 | 0.99 |
| Hypopharynx volume (mm 3 ) | 2780 (473) | 2478 (473) | 302 (182) | 0.13 | 0.91 |
| Maxillary right sinus volume (mm 3 ) | 14101 (1399) | 14130 (1399) | 28 (116) | 0.81 | 1.00 |
| Maxillary left sinus volume (mm 3 ) | 13972 (1549) | 13938 (1549) | 34 (128) | 0.80 | 1.00 |
| Soft palate area (mm 2 ) | 212 (25) | 217 (25) | 5 (4) | 0.32 | 0.99 |
| Soft-tissue thickness CV 1 (mm) | 18.1 (1.1) | 18.0 (1.1) | 0.1 (0.1) | 0.32 | 1.00 |
| Soft-tissue thickness CV 2 (mm) | 3.5 (0.2) | 3.4 (0.2) | 0.1 (0.1) | 0.46 | 0.96 |
| Soft-tissue thickness CV 3 sa (mm) | 4.7 (0.4) | 4.7 (0.4) | 0.1 (0.1) | 0.40 | 0.99 |
| Soft-tissue thickness CV 3 ia (mm) | 3.6 (0.2) | 3.6 (0.2) | 0.0 (0.1) | 0.71 | 0.95 |
| Soft-tissue thickness CV 4 sa (mm) | 4.5 (0.2) | 4.5 (0.2) | 0.0 (0.1) | 1.00 | 0.97 |
| Soft-tissue thickness CV 4 ia (mm) | 4.2 (0.2) | 4.2 (0.2) | 0.0 (0.1) | 0.43 | 0.97 |
| PP-SN (mm) | 7.2 (0.8) | 7.7 (0.8) | −0.4 (0.1) | 0.01 ∗ | 0.97 |
| MP-SN (mm) | 33.7 (1.9) | 33.5 (1.9) | 0.1 (0.3) | 0.70 | 0.99 |
| S-PNS (mm) | 40.1 (1.2) | 39.9 (1.2) | 0.2 (0.2) | 0.56 | 0.98 |
| N-ANS (mm) | 49.3 (0.9) | 48.6 (0.9) | 0.7 (0.5) | 0.18 | 0.90 |
| ANS-Me (mm) | 65.7 (1.7) | 65.0 (1.7) | 0.7 (0.3) | 0.04 ∗ | 0.98 |
| N-Me (mm) | 113.8 (2.5) | 113.3 (2.5) | 0.5 (0.6) | 0.38 | 0.97 |
Stay updated, free dental videos. Join our Telegram channel
VIDEdental - Online dental courses


