Introduction
We evaluated the 3-dimensional craniofacial skeletal and pharyngeal airway morphology in growing patients with and without cleft lip and palate.
Methods
Our juvenile subjects consisted of 34 girls (ages, 9-12 years); 15 had cleft lip and palate, and 19 did not. The adolescent subjects consisted of 32 girls (ages, 13-17 years); 14 had cleft lip and palate, and 18 did not. Each subject was examined with cone-beam computed tomography. The dimensions of the craniofacial skeleton and pharyngeal airway were measured. The Scheffé method of multiple comparisons was used to identify relationships among skeletal and pharyngeal variables.
Results
The pharyngeal airway and mandibular size variables did not differ significantly between the juvenile and adolescent cleft lip and palate groups. Significant differences were observed between each cleft lip and palate group and its corresponding control group. FHN-A, FHN-B, FH-NA, FH-NB, and Co-Me were significantly smaller in the cleft lip and palate groups than in the corresponding control groups. Anteroposterior and lateral widths, heights, and volumes of the superior oropharyngeal airway were significantly smaller in the adolescent cleft lip and palate group than in the adolescent controls.
Conclusions
The mandible and the oropharyngeal airway were larger in the adolescent controls than in the juvenile controls without cleft lip and palate, but there were no significant differences between the adolescent and juvenile patients with cleft lip and palate.
The condition of the upper airway is of interest to orthodontists investigating the relationship between facial type and airway morphology, changes in airway shape and volume with growth and development, and the possibility of modifying the airway by dental treatment. The dimensions of the nasopharyngeal airway typically continue to grow rapidly until around 13 years of age, and the growth rate decreases thereafter. Taylor et al reported that the anteroposterior dimensions of the oropharyngeal airway increased between the ages of 6 and 9 years and again between 12 and 15 years, but showed little change from 9 to 12 years of age. Recent studies have demonstrated significant differences in facial structure and growth associated with cleft lip and palate (CLP) compared with facial structures and growth in normal subjects; patients with CLP have a smaller upper airway compared with normal controls. However, age-related changes in the dimensions of the nasopharyngeal airway are unclear. Parents of children with CLP have often reported that their children snore and breathe noisily during sleep, and patients with reduced nasal airways are also predisposed to mouth breathing. Rose et al found that patients with a cleft palate had significantly elevated incidences of mouth breathing, snoring, and hypopnea during sleep. These clinical findings are considered to represent the initial symptoms of sleep-disordered breathing.
Imamura et al reported that juvenile patients with complete unilateral CLP had larger adenoidal tissues than did age-matched subjects without CLP. The high risk for sleep-disordered breathing in children with CLP is caused by the dysfunction of muscles controlling the soft palate in conjunction with structural abnormalities of the maxilla and the mandible. Patients suffering from sleep-disordered breathing are at increased risk for hypertension, cardiovascular and cerebrovascular diseases, and excessive daytime sleepiness.
Morphometric evaluation of the pharyngeal airway is therefore important in patients with CLP. Most previous evaluations have been performed by identifying landmarks on lateral cephalometric images and measuring standard lengths and areas in the pharyngeal region. According to Imamura et al, the anteroposterior dimension of the pharyngeal airway was smaller in adolescent patients with CLP than in those without CLP and significantly larger in the upper airway of adolescent patients with CLP than in juveniles with CLP. Oosterkamp et al reported that adults with CLP and obstructive sleep apnea had similar craniofacial and pharyngeal morphologies, except for a significantly more retrusive maxilla among the CLP subjects. In comparison with a reference group, the CLP and the obstructive sleep apnea groups had a significantly smaller oropharyngeal depth at the tip of the velum, larger craniocervical angulation, and more inferiorly positioned hyoid bone.
Lateral cephalograms are limited by the inherent errors accompanying the 2-dimensional representation of a 3-dimensional (3D) structure, including distortion, differences in magnification, and the superposition of the bilateral craniofacial structures. Several imaging technologies, such as spiral or helical computed tomography (CT) and dental cone-beam CT (CBCT), are widely used for morphologic evaluations. CBCT is a radiographic technique that captures anatomic images with a cone-shaped beam, instead of a thin fan-shaped beam, and renders these images in 3 dimensions. Arai et al developed a high-resolution CBCT system for use in dentistry. The accuracy of volumetric measurements of the airway by using CBCT images has been previously confirmed. Thus, 3D morphologic analysis of the pharyngeal airway is possible with CBCT scans. Nevertheless, there have been few reports about this technique. The authors of 1 study specifically compared the pharyngeal volumes of patients with skeletal Class I and Class III malocclusions ; in another study, the effects of nonextraction and extraction orthodontic treatments on airway volumes were compared.
Our study was performed to determine whether the 3D size of the pharyngeal airway and the craniofacial skeletal morphology differ between growing patients with and without CLP.
Material and methods
All subjects were randomly selected from patients who visited the Kanomo Orthodontic and Pediatric Dental Clinic in Hyogo, Japan, for orthodontic treatment of malocclusion and were examined by using CBCT between 2003 and 2009. Exclusion criteria were (1) a history of treatment for sleep-disordered breathing, including tonsillectomy, adenoidectomy, or recurrent tonsillitis; (2) frequent colds (6 or more per year); or (3) a history of dysphagia and continuous positive airway pressure therapy. A further exclusion criterion for the control groups was any type of syndrome. All control subjects had normal craniofacial morphology with no jaw deformities.
The patients’ skeletal maturity was determined by the cervical vertebral maturation method developed by Baccetti et al. The juvenile subjects were in cervical stages 2 and 3, and the adolescent subjects were in stages 4 and 5. The juvenile subjects consisted of 15 girls with CLP (mean age, 10.6 years) and 19 girls without CLP (mean age, 10.9 years). The adolescent subjects included 14 girls with CLP (mean age, 14.7 years) and 18 girls without CLP (mean age, 15.4 years) ( Table I ).
| Juvenile (CS 2 and 3) | Adolescent (CS 4 and 5) | |||
|---|---|---|---|---|
| CLP | Control | CLP | Control | |
| n | 15 | 19 | 14 | 18 |
| Age (y) | 10.6 ± 1.2 | 10.9 ± 1.2 | 14.7 ± 1.2 | 15.4 ± 1.4 |
Ten patients in the juvenile group with CLP had unilateral CLP, and 5 had bilateral CLP. In the adolescent group with CLP, 10 patients had unilateral and 4 had bilateral CLP. Lip closure by Millard-type lip repair had been performed in most patients at a mean age of 3.8 months (SD, 1.2 months), and closure of the palate had been performed by pushback palatoplasty and the Furlow method at a mean age of 8.6 months (SD, 3.9 months). Bone grafting had been done at a mean age of 10.2 years (SD, 1.4 years). No patient had undergone pharyngeal flap surgery.
The study protocol was reviewed and approved by the Ethics Committee of the Faculty of Dentistry, Kyushu University, Fukuoka, Japan. Before the CT scan, the patients’ parents were fully informed of the purpose of this study and of the risks associated with CT.
CT images were obtained by using the facial mode of a maxillofacial CB imaging device (MercuRay; Hitachi Medical, Tokyo, Japan), because this mode provided the largest field of view (192.5 mm) and was designed to capture the whole face. The device was set to 120 kV and 15 mA, and the scan time was 9.6 seconds. Each patient was seated in a chair with the Frankfort horizontal plane parallel to the floor and asked to not move her head or swallow and to maintain centric occlusion and relaxed tongue and lip positions during the examination.
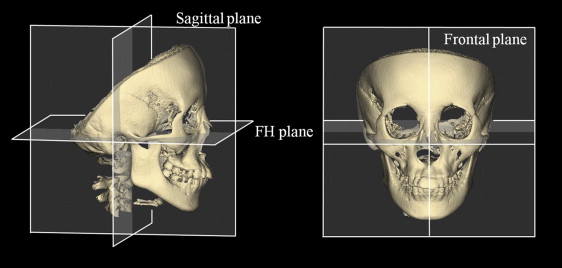
The acquired digital axial images were transferred directly from the CT scanner to a personal computer in the digital imaging and communications in medicine (DICOM) format. Volume-rendering software (VG Studio MAX 1.2; Nihon Visual Science, Tokyo, Japan) was used to create the 3D images. The volumetric data were rendered in a 512 × 512 matrix with a voxel size of 0.377 mm. The slice data sets were reoriented as follows: (1) the axial plane was parallel to the Frankfort horizontal plane, which was defined by the right and left poria and the center of the right and left orbitales; (2) the frontal plane was perpendicular to the Frankfort horizontal plane, passing through the right and left poria; and (3) the sagittal plane was perpendicular to the Frankfort horizontal and frontal planes, passing through the center of the right and left orbitales ( Fig 1 ). After defining the 3D spatial coordinate system, the craniofacial skeletal structures (craniomaxillary complex and mandible) were separated by threshold-based segmentation of differences in their permeability to x-rays. The outlines of the airway spaces were clearly visible at the contrast threshold and were traced on each 2-dimensional axial, sagittal, and coronal sectional image, based on the visual interpretation of tissue boundaries. Finally, the 3D CBCT images were constructed.
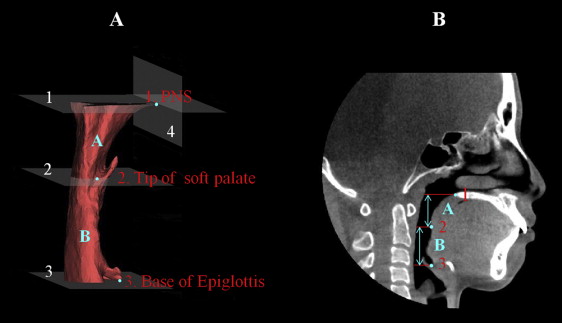
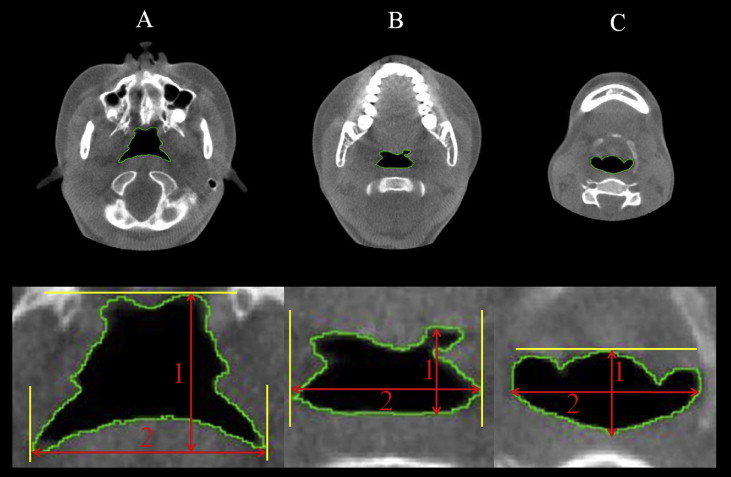
To measure the dimensions of the pharynx in the region of interest, we first defined the following planes: the superior boundary was the nasal floor plane, defined as the plane parallel to the Frankfort horizontal plane that passed through the posterior nasal spine; and the middle and inferior boundaries were the soft palate plane and the epiglottal plane, respectively, which were parallel to the Frankfort horizontal plane and passed through the tip of the soft palate and the base of the epiglottis, respectively ( Table II , Fig 2 ). The anteroposterior and lateral widths of the airway were measured on 2-dimensional axial slices of each plane (nasal floor, soft palate, and epiglottal; Fig 3 ). The pixels in a cross-section of the airway lumen were also counted in each axial plane. The upper airway was further divided into 2 regions: the superior oropharyngeal airway area formed by the nasal floor and soft palate planes, and the inferior oropharyngeal airway area formed by the soft palate and epiglottal planes ( Fig 2 ). The volumes and heights of these 2 regions were calculated by multiplying the sum of voxels in the cross-section of the airway lumen by the number of slices with the volume-rendering software. The total volume and height were then calculated for the 2 regions.
| Landmark | Definition | |
|---|---|---|
| Cross-sectional planes | ||
| ANP | Anterior nasal plane | A frontal plane perpendicular to FH plane through the posterior nasal spine |
| NP | Nasal floor plane | A plane parallel to FH plane through the posterior nasal spine |
| SP | Soft palate plane | A plane parallel to FH plane through the top of the soft palate |
| EP | Epiglottal plane | A plane parallel to FH plane through the base of the epiglottis |
| Pharyngeal airways | ||
| Superior oropharyngeal airway | A pharyngeal airway formed by the NP and SP | |
| Inferior oropharyngeal airway | A pharyngeal airway formed by the SP and EP | |
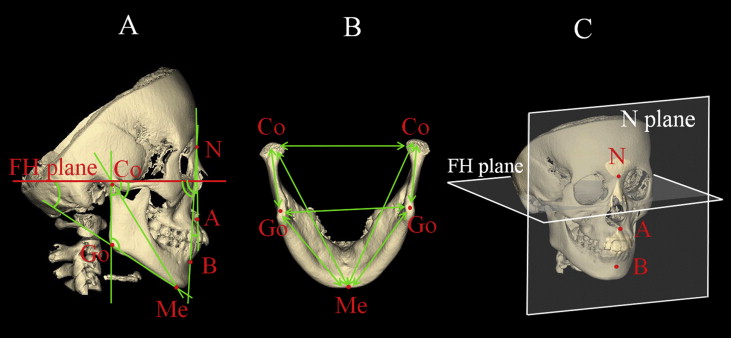
The 3D CBCT images of the craniofacial skeletal structures were exported to image-measurement software (3-D Rugle for STL; Medic Engineering, Kyoto, Japan) in stereolithography format. The images could then be rotated and viewed from any perspective. After 6 anatomic landmarks had been identified for each subject, 7 angular and 7 linear measurements were defined. These measurements were then taken bilaterally by an investigator (M.Y.) using the measurement software, and the right and left values for each measurement were averaged ( Tables III and IV , Fig 4 ).
| Landmark | Definition |
|---|---|
| N | Nasion |
| A | Point A |
| B | Point B |
| PNS | Posterior nasal spine |
| Co | Condylion |
| Go | Gonion |
| Me | Menton |
| FH | Frankfort horizontal plane |
| N plane | A plane perpendicular to the FH plane through N |
| Measurement | Definition |
|---|---|
| Angular measurements | |
| FH-NA | Angle of N-A axis to the FH plane on the lateral view |
| FH-NB | Angle of N-B axis to the FH plane on the lateral view |
| ANB | Angle between N-A and N-B |
| FH-CoGo | Angle of Co-Go axis to the FH plane on the lateral view |
| FH-GoMe | Angle of Go-Me axis to the FH plane on the lateral view |
| FH-CoMe | Angle of Co-Me axis to the FH plane on the lateral view |
| Go angle | Angle between Co-Go and Go-Me |
| Linear measurements | |
| FHN-A | Linear distance between N plane and A |
| FHN-B | Linear distance between N plane and B |
| Go-Go | Linear distance between left and right Go |
| Co-Co | Linear distance between left and right Co |
| Co-Go | Linear distance between Co and Go |
| Go-Me | Linear distance between Go and Me |
| Co-Me | Linear distance between Co and Me |
A subsample of 10 subjects was selected randomly to determine the extent of measurement errors, and all measurements were repeated in these subjects by the same investigator (M.Y.) after 2 weeks. Systematic errors were analyzed by using the paired t test to compare the pairs of measurements taken at different times. The paired measurements were highly correlated (r = 0.973-0.999) and were not significantly different from each other ( P <0.001).
Random errors were estimated by using Dahlberg’s formula. Random errors varied from 62.44 to 101.13 mm 3 for volumetric measurements, from 3.01 to 5.16 mm 2 for cross-sectional area measurements, from 0.05 to 0.74 mm for linear measurements, and from 0.17° to 0.63° for angular measurements.
Statistical analysis
The mean value and standard deviation of each measurement were calculated. Differences in skeletal values between the left and right sides of the subjects were analyzed by using paired t tests. The significance of between-group differences was tested with the Hotelling T2 as an initial exploratory test. When significance was found, analysis of variance (ANOVA) was applied to identify significant between-group differences for each variable. Significant differences were verified by using the Scheffé multiple comparisons test. All statistical analyses were performed with SPSS software (version 15.0J for Windows; SPSS, Chicago, Ill), and P <0.05 was taken to indicate statistical significance.
Results
Table V shows a comparison of the craniofacial skeletal variables for the 2 patient groups and the 2 control groups. The anteroposterior positions of the maxilla and the mandible in the juvenile patients with CLP were characterized by significantly smaller mean values for FH-NA ( P <0.05) compared with those in the juvenile control subjects. The mean values for FHN-A ( P <0.01), FHN-B ( P <0.05), FH-NA ( P <0.01), and FH-NB ( P <0.05) in the adolescent CLP group were significantly smaller than those in the adolescent control group (see Table IV for definitions).
| CLP/j | Control/j | CLP/a | Control/a | Multiple comparisons | |||||
|---|---|---|---|---|---|---|---|---|---|
| Mean | SD | Mean | SD | Mean | SD | Mean | SD | ||
| Angular measurements (°) | |||||||||
| FH-NA | 86.7 | 2.9 | 89.9 | 1.5 | 85.5 | 5.1 | 90.1 | 2.7 | (CLP/j, Control/j) ∗ (CLP/a, Control/a) † |
| FH-NB | 85.7 | 2.2 | 86.9 | 1.7 | 84.4 | 4.0 | 87.7 | 3.0 | (CLP/a, Control/a) ∗ |
| ANB | 1.4 | 2.8 | 3.0 | 1.2 | 2.5 | 3.2 | 2.4 | 2.5 | NS |
| FH-CoGo | 93.6 | 2.6 | 87.8 | 4.4 | 91.4 | 4.6 | 92.8 | 4.7 | (Control/j, Control/a) † (CLP/j, Control/j) † |
| FH-GoMe | 31.6 | 4.3 | 29.5 | 3.6 | 31.9 | 5.1 | 29.0 | 3.9 | NS |
| FH-CoMe | 56.3 | 9.4 | 55.5 | 8.4 | 58.8 | 9.5 | 53.5 | 3.3 | NS |
| Go angle | 125.2 | 5.1 | 123.2 | 5.6 | 123.3 | 6.0 | 121.8 | 6.3 | NS |
| Linear measurements (mm) | NS | ||||||||
| FHN-A | −2.9 | 2.7 | −0.1 | 1.3 | −4.1 | 4.6 | 0.2 | 2.5 | (CLP/a, Control/a) † |
| FHN-B | −6.6 | 3.4 | −4.8 | 2.6 | −8.8 | 6.1 | −3.5 | 5.1 | (CLP/a, Control/a) ∗ |
| Co-Co | 95.7 | 4.2 | 94.4 | 5.3 | 96.0 | 5.0 | 98.2 | 4.5 | NS |
| Go-Go | 87.1 | 3.5 | 85.4 | 3.6 | 88.4 | 6.9 | 89.8 | 4.2 | (Control/j, Control/a) ∗ |
| Co-Go | 46.8 | 2.6 | 48.9 | 3.0 | 50.3 | 4.7 | 52.7 | 2.6 | (Control/j, Control/a) ∗ |
| Go-Me | 78.3 | 3.5 | 77.2 | 4.3 | 78.9 | 4.0 | 82.8 | 3.9 | (Control/j, Control/a) † |
| Co-Me | 110.4 | 5.4 | 110.1 | 4.7 | 112.4 | 5.1 | 117.5 | 4.2 | (Control/j, Control/a) † (CLP/a, Control/a) ∗ |
Stay updated, free dental videos. Join our Telegram channel
VIDEdental - Online dental courses


