Introduction
Our objectives in this study were to evaluate in 3 dimensions the growth and treatment effects on the midface and the maxillary dentition produced by facemask therapy in association with rapid maxillary expansion (RME/FM) compared with bone-anchored maxillary protraction (BAMP).
Methods
Forty-six patients with Class III malocclusion were treated with either RME/FM (n = 21) or BAMP (n = 25). Three-dimensional models generated from cone-beam computed tomographic scans, taken before and after approximately 1 year of treatment, were registered on the anterior cranial base and measured using color-coded maps and semitransparent overlays.
Results
The skeletal changes in the maxilla and the right and left zygomas were on average 2.6 mm in the RME/FM group and 3.7 mm in the BAMP group; these were different statistically. Seven RME/FM patients and 4 BAMP patients had a predominantly vertical displacement of the maxilla. The dental changes at the maxillary incisors were on average 3.2 mm in the RME/FM group and 4.3 mm in the BAMP group. Ten RME/FM patients had greater dental compensations than skeletal changes.
Conclusions
This 3-dimensional study shows that orthopedic changes can be obtained with both RME/FM and BAMP treatments, with protraction of the maxilla and the zygomas. Approximately half of the RME/FM patients had greater dental than skeletal changes, and a third of the RME/FM compared with 17% of the BAMP patients had a predominantly vertical maxillary displacement.
The orthopedic facemask combined with rapid maxillary expansion (RME/FM) has been a valuable treatment option for children with Class III malocclusion associated with maxillary retrusion. Effective maxillary advancement has been observed when treatment is performed at an early age (late deciduous or early mixed dentition), the time of greatest responsiveness of the circummaxillary sutures. RME affects the midpalatal suture and all adjacent circummaxillary articulations, the disruption of which presumably facilitates the orthopedic effect of the FM.
A meta-analysis statistical synthesis has indicated that more skeletal effect and less dental change are produced with RME/FM. Even though the findings from a randomized clinical trial demonstrated a significant response to FM therapy with or without palatal expansion, there has been a remarkable difference in the amount of maxillary protraction reported when comparing results from the perspective of traditional cephalometrics, an x-y coordinate system (where the horizontal axis was the sella-nasion line rotated downward 7°, and the vertical axis was a line perpendicular to the horizontal axis through sella), and the pitchfork analysis.
De Clerck at al reported successful maxillary protraction in the late mixed or permanent dentition phase (age, 10-14 years) with an innovative treatment technique that uses bone anchors and Class III elastics (bone-anchored maxillary protraction, BAMP). Improvements have been reported in skeletal relationships, primarily through maxillary advancement, with little effect on dentoalveolar units or change in mandibular position. Preliminary studies based on conventional 2-dimensional cephalometric data showed significantly greater maxillary advancement induced by BAMP when compared with an untreated control group (about 4 mm). Furthermore, BAMP produced significantly larger maxillary advancements with less dentoalveolar compensation with respect to RME/FM therapy.
The advances in 3-dimensional (3D) imaging of facial structures have provided alternative tools to analyze skeletal changes. Cevidanes et al developed and validated a method for 3D longitudinal assessment of dentoskeletal changes using surface registration on the anterior cranial base as a reference for the superimposition of 3D models before and after Class III malocclusion orthopedic treatment with miniplates. When evaluating the growth and therapeutic effects of BAMP in growing patients with Class III malocclusion in 3 dimensions, Nguyen et al showed significant maxillary and zygomatic protraction with hardly any skeletal rotational changes or dental compensation of the maxillary incisors.
To date, there are no 3D studies describing the treatment effects of RME/FM. The purpose of this study was to evaluate in 3 dimensions the growth and active treatment effects on the maxillary dentition and midface with RME/FM, comparing these treatment outcomes to those produced by the BAMP protocol.
Material and methods
The study sample consisted of 46 patients with Class III malocclusion treated with either RME/FM or BAMP. The project was approved by a committee for research on human subjects at Methodist University, Sao Paulo, Brazil, and informed consent was obtained from each patient family before treatment. Both RME/FM and BAMP cone-beam computed tomography (CBCT) scans were acquired using an iCAT machine (Imaging Sciences International, Hatfield, Pa) with a 40-second scan and a 16 × 22-cm field of view. After acquisition, the CBCT scans were reformatted to an isotropic resolution of 0.5 × 0.5 × 0.5 mm to decrease the computational power and the time required to compute the automated registration.
The inclusion criteria were skeletal Class III malocclusion characterized by a Wits appraisal of –1 mm or less, an anterior crossbite or incisor end-to-end relationship, and a Class III molar relationship or mesial terminal step for the deciduous second molars. All patients were of white ancestry between stages 1 and 3 of skeletal maturity according to the cervical vertebral maturation method. All patients were treated at least to a positive dental overjet before discontinuing treatment, with most patients overcorrected to a Class II molar relationship.
Twenty-one consecutive patients (16 girls, 5 boys) were treated with RME/FM therapy by the lead author (C.T.H.). All patients had a Class III malocclusion in the deciduous or early mixed dentition. To visualize the treatment changes in 3 dimensions, CBCT scans were taken before the placement of the hyrax-type expansion appliances (T1) and after approximately 10 months of maxillary protraction (T2). The mean ages were 8.1 ± 1.5 years at T1 and 9 ± 1.5 years at T2. The mean duration of the T1-to-T2 interval was 10.1 ± 2.2 months.
Twenty-five consecutive patients (13 girls, 12 boys) were treated with the BAMP protocol by 2 operators (H.D.C. and a graduate student). All patients had Class III malocclusion in the mixed or permanent dentition. The mean duration of the T1-to-T2 interval was 1.2 ± 1 year. CBCT images were taken after placement of the miniplates (T1) and after approximately 1 year (T2). The mean ages for the BAMP sample were 11.9 ± 1.8 years at T1 and 13.1 ± 1.7 years at T2.
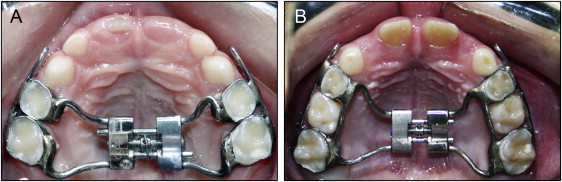
For the RME/FM protocol, the hyrax-type rapid palatal expander was constructed with orthodontic bands adapted to the maxillary deciduous first and second molars or to the deciduous first molars and permanent first molars in children during the mixed dentition. The arms of the expander were soldered to the palatal side of the bands. A heavy (0.045 in) wire was soldered to the buccal surface of the bands, and it extended anteriorly to the canine area with a hook to receive the protraction elastics ( Fig 1 ). The appliance was activated 2 turns a day (0.25 mm per turn) until the desired amount of expansion had been achieved. The amount of expansion necessary was determined clinically, based on creating a near-buccal crossbite relationship. All patients started RME before protraction with the FM.
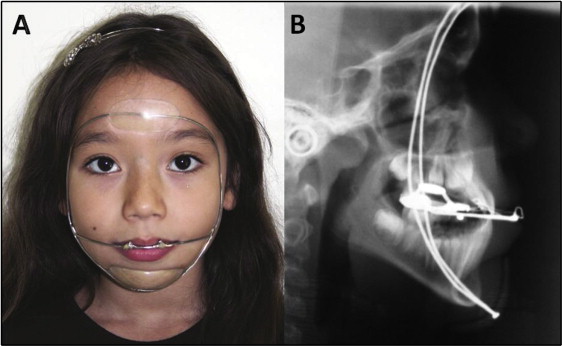
An FM was made for each patient, as described by Turley. Protraction of the maxilla was initiated immediately after the completion of expansion. A traction force from 600 to 800 g per side was used, and each patient was instructed to wear the mask for 14 to 16 hours per day. The elastics were oriented in a downward and forward direction at an angle of approximately 15° to 30° relative to the occlusal plane to minimize the tendency of counterclockwise rotation of the maxilla ( Fig 2 , A and B ).
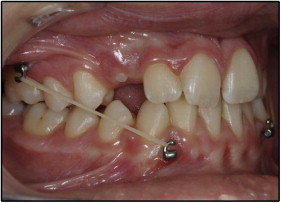
For the BAMP protocol, 4 orthodontic miniplates (Bollard; Tita-Link, Brussels, Belgium) were inserted into the infrazygomatic crests of the maxillary buttress and between the mandibular left and right lateral incisors and canines. The miniplates were fixed to the bone with 2 (mandible) or 3 (maxilla) titanium screws (2.3 mm in diameter, 5 mm in length). The extensions of the plates perforated the attached gingiva near the mucogingival junction. Three weeks after surgery, Class III elastics were attached between the upper and lower miniplates with an initial force of 100 g per side, progressing to a maximum force of 250 g per side. The patients were asked to replace the elastics at least once a day and wear them 24 hours per day. In 14 patients, after 2 to 3 months of intermaxillary traction, a removable biteplate was placed on the maxillary arch to eliminate the occlusal interference in the incisor region until correction of the anterior crossbite was obtained ( Fig 3 ).
In the radiographic protocol, the data from each CBCT scan were saved as digital imaging and communications in medicine (DICOM) files. Model construction, cranial base registration and visualization, and assessment of treatment outcomes were performed using methods described by Adams et al, Nguyen et al, and Cevidanes et al. Gray scale isotropic models were constructed from the CBCT images with a voxel dimension of 0.5 × 0.5 × 0.5 mm to reduce the computation processing during registration. Three-dimensional surface models of the anatomic region of interest were constructed from the T1 and T2 images of each patient using ITK-SNAP (open-source software; http://www.itksnap.org ).
The initial and final 3D models were registered on anterior cranial fossa structures, specifically the endocranial surfaces of the cribriform plate region of the ethmoid bone and the internal surface of the frontal bone. These regions were chosen because of their early completion of growth. A fully automated voxel-based registration method was performed with IMAGINE (open-source software; http://www.ia.unc.edu/dev/download/imagine/index.htm ). This software computes the rigid registration (translation and rotation) that aligns the T1 and T2 gray-level CBCT data sets optimally with subvoxel accuracy at the anterior cranial base.
Visualization and assessment of changes were performed using CMF application software (developed at the M. E. Muller Institute for Surgical Technology and Biomechanics, University of Bern, Bern, Switzerland, under the funding of the Co-Me network; http://co-me.ch ). Three-dimensional closest-point surface distances from T1 to T2 that are graphically displayed as color maps quantified the differences between the superimposed 3D images. Semitransparent overlays were also used to visualize the 3D displacements of the maxilla relative to the cranial base ( Fig 4 ). In the quantitative color maps, areas at the red end of the spectrum have positive mean surface-distance values and represent outward movement, and areas at the blue end of the spectrum have negative mean surface-distance values and represent inward movement. Green indicates minor changes with little or no overall movement.
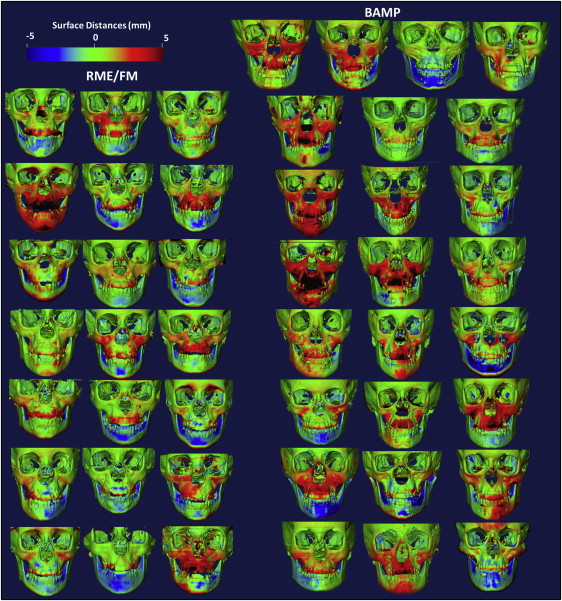
To quantify changes on the color maps, an isoline tool (contour line) was used to measure the greatest 3D displacements among hundreds of surface distances between the superimposed images at 4 anatomic regions: the maxillary incisors, the maxilla, and the right and left zygomas. For the maxillary incisor, the maximum surface distance was measured at the most labial surface of the incisor. The maxillary region was defined as the anterior surface of the maxilla between the canines. The right and left zygomas were defined as the surfaces above the zygomatic-maxillary sutures and medial to the lateral wall of the orbits.
Statistical analysis
To assess interexaminer reliability, the measurements were repeated for 5 randomly selected patients. Systematic error was evaluated with the Wilcoxon signed rank test, whereas the method of moments’ estimator was used to calculate random error.
The Kolmogorov-Smirnov test showed that the data were distributed normally. Therefore, parametric statistics were applied.
Descriptive statistics of the RME/FM group were used to describe the means, standard deviations, and ranges at T1 and T2. Descriptive statistics of the BAMP group had been determined in a previous study. The homogeneity between the 2 treatment groups allowed for comparisons without annualizing the data.
Significant differences between the T2-to-T1 changes in the RME/FM group vs the BAMP group were assessed with paired t tests. Independent-sample t tests were used to compare the greatest displacements between T1 and T2 at each anatomic region of interest. The level of significance was set at 0.05 for P values. The power of the study was 0.84, and it was calculated for an effect size of 0.9 for the sagittal displacement of the maxilla. All statistical procedures were performed in Statistica (version 5.1; StatSoft, Tulsa, Okla).
Results
No systematic error was found ( Table I ). The random error ranged from 0.02 to 0.07 mm, thus demonstrating the reliability of measures in the 3D assessments ( Table I ).
| Measurements | First measurement | Second measurement | Z | P | Random error | ||||
|---|---|---|---|---|---|---|---|---|---|
| Median | 25 th | 75 th | Median | 25 th | 75 th | ||||
| Maxilla | 2.7 | 1.8 | 5.0 | 2.7 | 1.7 | 5.0 | −1.604 | 0.109 NS | 0.04 |
| Maxillary incisor | 4.2 | 2.4 | 6.3 | 4.0 | 2.4 | 6.3 | 0.000 | 1.000 NS | 0.07 |
| Right zygoma | 3.7 | 2.4 | 4.2 | 3.6 | 2.4 | 4.2 | 0.000 | 1.000 NS | 0.03 |
| Left zygoma | 3.7 | 2.2 | 4.2 | 3.7 | 2.2 | 4.2 | −1.461 | 0.144 NS | 0.02 |
Table II summarizes the descriptive statistics for the skeletal and dental changes for the RME/FM and BAMP groups. The magnitude, location, and direction of the changes in the RME/FM group are visually displayed in Figures 4 through 6 and shown in Figure 7 . The color maps and semitransparent overlays also allowed qualitative assessment, not measured in this study, of the expansion of the maxillary complex in the subjects shown in Figures 8 through 10 .
| Measurement | Group | Mean | SD | Minimum | Maximum | P |
|---|---|---|---|---|---|---|
| Maxilla | RME/FM | 2.6 | 1.2 | 1.3 | 5.5 | 0.007 ∗ |
| BAMP | 3.7 | 1.7 | 1.5 | 8.5 | ||
| Maxillary incisor | RME/FM | 3.2 | 1.8 | −0.2 | 6.5 | 0.023 ∗ |
| BAMP | 4.3 | 1.7 | 1.7 | 8.5 | ||
| Right zygoma | RME/FM | 2.6 | 1.0 | 0.7 | 4.4 | 0.005 ∗ |
| BAMP | 3.6 | 1.3 | 1.6 | 6.9 | ||
| Left zygoma | RME/FM | 2.6 | 0.9 | 0.6 | 4.5 | 0.003 ∗ |
| BAMP | 3.8 | 1.5 | 1.4 | 7.8 |
Stay updated, free dental videos. Join our Telegram channel
VIDEdental - Online dental courses


