Introduction
Sequential stages in the development of the hand, wrist, and cervical vertebrae commonly are used to assess maturation and predict the timing of the adolescent growth spurt. This approach is predicated on the idea that forecasts based on skeletal age must, of necessity, be superior to those based on chronologic age. This study was undertaken to test this reasonable, albeit largely unproved, assumption in a large, longitudinal sample.
Methods
Serial records of 100 children (50 girls, 50 boys) were chosen from the files of the Bolton-Brush Growth Study Center in Cleveland, Ohio. The 100 series were 6 to 11 years in length, a span that was designed to encompass the onset and the peak of the adolescent facial growth spurt in each subject. Five linear cephalometric measurements (S-Na, Na-Me, PNS-A, S-Go, Go-Pog) were summed to characterize general facial size; a sixth (Co-Gn) was used to assess mandibular length. In all, 864 cephalograms were traced and analyzed. For most years, chronologic age, height, and hand-wrist films were available, thereby permitting various alternative methods of maturational assessment and prediction to be tested. The hand-wrist and the cervical vertebrae films for each time point were staged. Yearly increments of growth for stature, face, and mandible were calculated and plotted against chronologic age. For each subject, the actual age at onset and peak for stature and facial and mandibular size served as the gold standards against which key ages inferred from other methods could be compared.
Results
On average, the onset of the pubertal growth spurts in height, facial size, and mandibular length occurred in girls at 9.3, 9.8, and 9.5 years, respectively. The difference in timing between height and facial size growth spurts was statistically significant. In boys, the onset for height, facial size, and mandibular length occurred more or less simultaneously at 11.9, 12.0, and 11.9 years, respectively. In girls, the peak of the growth spurt in height, facial size, and mandibular length occurred at 10.9, 11.5, and 11.5 years. Height peaked significantly earlier than both facial size and mandibular length. In boys, the peak in height occurred slightly (but statistically significantly) earlier than did the peaks in the face and mandible: 14.0, 14.4, and 14.3 years. Based on rankings, the hand-wrist stages provided the best indication (lowest root mean squared error) that maturation had advanced to the peak velocity stage. Chronologic age, however, was nearly as good, whereas the vertebral stages were consistently the worst. Errors from the use of statural onset to predict the peak of the pubertal growth spurt in height, facial size, and mandibular length were uniformly lower than for predictions based on the cervical vertebrae. Chronologic age, especially in boys, was a close second.
Conclusions
The common assumption that onset and peak occur at ages 12 and 14 years in boys and 10 and 12 years in girls seems correct for boys, but it is 6 months to 1 year late for girls. As an index of maturation, hand-wrist skeletal ages appear to offer the best indication that peak growth velocity has been reached. Of the methods tested here for the prediction of the timing of peak velocity, statural onset had the lowest errors. Although mean chronologic ages were nearly as good, stature can be measured repeatedly and thus might lead to improved prediction of the timing of the adolescent growth spurt.
Milo Hellman’s observation that facial growth undergoes periods of acceleration and deceleration was a major advance in the understanding of facial growth. Today, it is generally accepted that treatment during the so-called adolescent growth spurt increases the efficiency and effectiveness of orthodontic treatment, especially for a Class II malocclusion. For stature, the peak of the adolescent spurt is generally thought to occur at approximately ages 12 years in girls and 14 years in boys. The onset of the spurt occurs approximately 2 years before the peak. Although mean chronologic age can serve as a guide to treatment timing, there are sufficient individual variations to prompt investigators to search for some sort of skeletal age that might be better correlated with the growth of the face.
Because of the recognizable sequence of developmental stages and the ease with which radiographs can be obtained, hand-wrist staging is perhaps the most common method of assessing skeletal maturation. Many investigators, however, have found that several key hand-wrist events (eg, the appearance of the adductor sesamoid) appear at or near the peak of the pubertal growth spurt and thus have little use in prediction of the spurt’s onset. The observation that other areas of the skeleton progress through a series of well-defined changes during puberty has led orthodontists to look to these events to assess maturation and predict the timing of facial growth.
The cervical vertebrae undergo a well-defined sequence of changes that are visible on routine lateral cephalometric radiographs. These events are correlated with the stages of the hand and wrist and thus might serve to assess a patient’s current developmental status. The original method of staging by Lamparski, however, does not seem to lend itself to a statistically efficient prediction of future growth. Recently, however, several groups have developed new vertebral scales that warrant consideration, both as methods of assessing present maturity and for predicting the timing of future growth.
Franchi et al and Baccetti et al modified the methods of Lamparski and produced a single set of standards for both sexes. With respect to these new standards, they found that the peak in mandibular growth occurs between cervical vertebral stages (CS) 3 and 4 and that the stages of vertebral maturation occur, on average, 1 year apart. Thus, CS 2 might be a basis for prediction in that it would tend to precede the interval of maximum mandibular growth by about a year.
As things stand, indexes of skeletal maturation are the generally accepted means of assessing “growth potential”; however, the various methods are based on relatively small samples and commonly are validated against statural growth rather than a more obvious gold standard: the growth of the various regions of the face. The purpose of this investigation, therefore, was to develop incremental growth curves for stature, facial size, and mandibular length for a large longitudinal sample of growing children. As determined from these curves, the timing of major growth events (onset and peak) will be compared, with both the mean ages at which these events are supposed to occur and the estimated ages at which key hand-wrist and cervical vertebral stages appeared. Our goal was to test the common supposition that estimates of maturation and prediction based on bone age have smaller errors than estimates based on chronologic age or stature.
Material and methods
We used the serial records of 100 subjects (50 girls, 50 boys) from the files of the Bolton-Brush Growth Study Center in Cleveland, Ohio. The participants in the Bolton study were certified by their family physician as “well and normal.” Because the main goal of this study was to examine the individual pattern of growth, practically the only criterion for inclusion was the availability of a long (>6 years), unbroken series of lateral cephalograms, hand-wrist radiographs, and statural records. Class III subjects were excluded. In all but a few instances, the radiographs were taken at yearly intervals (± 30 days). A few subjects (3 girls, 18 boys) had undergone limited orthodontic treatment, mainly space maintenance and anterior alignment. It was assumed—albeit without proof—that this sort of intervention had little appreciable effect on the skeletal cephalometric measures used here.
Initially, each series was 6 years in length, an interval designed to surround vertebral stage 3 development. Analysis of the first 60 subjects, however, showed that this time span frequently did not contain an obvious spurt in facial growth. In an attempt to capture this event (if present), data were added as needed to extend all series back to at least age 8 for girls and age 10 for boys. Furthermore, if the onset and the peak of the facial growth spurt could not yet be detected, the older end of the series was added. Ultimately, the number of data sets in the 100 series ranged from 6 to 11. In all, the timing of facial growth was inferred from 808 serial lateral cephalograms.
The cephalograms were hand traced on 0.003-in matte acetate by one of 2 authors (Z.J.M. and L.E.J.). To ensure consistency, the first author’s tracings were checked by the third author. Each series was traced at a single sitting so that anatomic details (especially the mandibular condyle) could be coordinated from one film to the next. The tracings then were digitized (digitizing board model A30BL.H; Numonics, Montgomeryville, Pa) and analyzed with commercial digitizing software (version 7.02; Dentofacial Planner, Toronto, Ontario, Canada). The Bolton cephalograms were taken at a minimum object-film distance. Thus, the average magnification ranged from 7.4% at age 8 to 8.4% at age 18. It was assumed that this small variation would not alter the form of the resulting growth curves, and no correction was made.
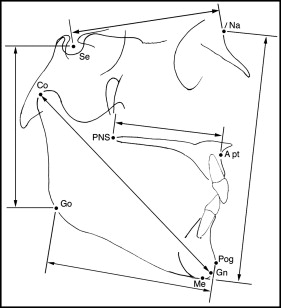
Five measurements (Na-Me, S-Go, S-Na, PNS-A, Go-Pog) were summed to give an overall representation of facial size. A sixth measurement (Co-Gn) was used to analyze mandibular growth separately relative to the growth of the rest of the face ( Fig 1 ).
With the aid of random numbers generated by variations in atmospheric pressure, 8 series (57 radiographs) were selected and reanalyzed. Because there were 2 workers, each redid 2 of his own series and 2 of his colleague’s, thereby permitting the use of intraclass correlation (ICC) to characterize technical reliability. For both interrater and intrarater reliabilities, the ICC values for the summed measurements of facial size and mandibular length exceeded 0.96.
On each cephalogram, the cervical vertebrae were staged according to the 6 stages of maturation described by Baccetti et al. Their method is based on changes in shape of the cervical vertebral bodies (2-4) and developing concavities on their lower borders. Staging was effected by inspection, and a cephalometric analysis was partially adopted from Hellsing and Baccetti et al. San Román et al reported that a concavity greater than 1 mm is the most reliable characteristic of maturation. For our study, a millimeter gauge was used to measure this characteristic on the lower border of cervical verbebra 3.
For most series, hand-wrist films were available at all ages. The films were staged according to Fishman’s system of skeletal maturation assessment by the principal investigator (Z.J.M.) and checked by a coauthor (R.G.B.).
Yearly increments of stature, facial size, and mandibular length were calculated for each subject and plotted against intervals of chronologic age (Microsoft Excel; Microsoft, Redmond, Wash). On the resulting growth curves, spline interpolation lines (version 14.0; SPSS, Chicago, Ill), the onset of the growth spurt was identified as the smallest increment—the local minimum—immediately preceding a relatively continuous increase to a peak—the local maximum. Some curves, however, deviated from the classic form first depicted by Scammon in 1927. Occasionally, for example, 2 peaks were observed. If they were separated by a smaller increment, the average age of the 2 maxima was taken as the peak. To qualify for averaging, the multiple peaks had to be within 2 mm of each other on the facial growth curve, 0.5 mm on the mandibular growth curve, and 5 mm on the height curve. Despite individual variations, onset and peak ultimately were assigned with reference to points at which the curves had a slope of zero (ie, dy/dx = 0).
Chronologic age, hand-wrist stage, and vertebral stage at onset and peak then were estimated for each subject. Age was interpolated to the nearest quarter year. When onset or peak occurred at a half-year or a three-quarter-year point, the corresponding hand-wrist and vertebral stages were taken from the next time point’s records. For 7 subjects, height data were unavailable for portions of the series, and thus neither statural onset nor peak could be identified.
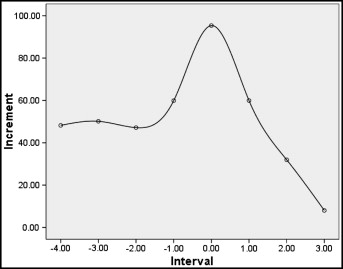
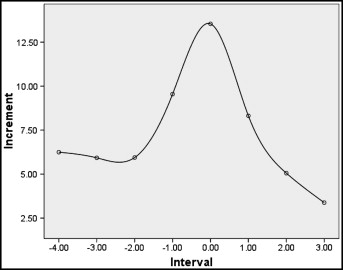
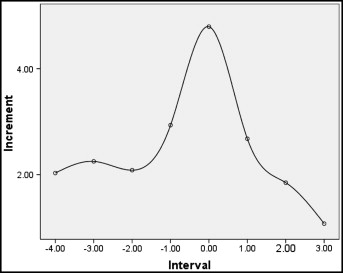
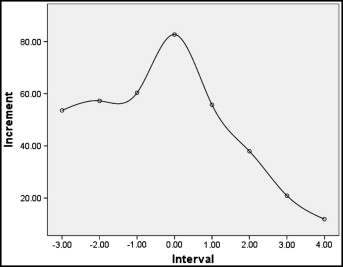
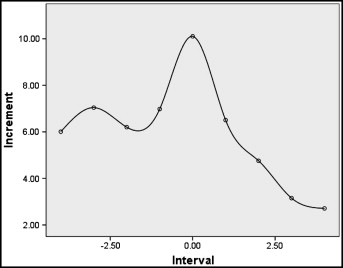
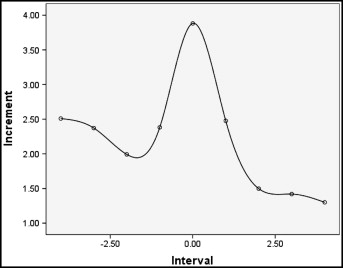
For both the male and female subsamples, average growth curves were plotted for height, facial size, and mandibular length. To generate these curves, the individual peaks were aligned (registered), and the increments for the peak and each prior and succeeding interval were averaged. Intervals at the 2 tails with fewer than 10 subjects were not included in the averaged curves.
Each index studied here is commonly used to assess maturational progress relative to a modal stage at which peak growth is said to occur. For the Fishman hand-wrist method, peak growth is said most often to occur in girls at stage 5 for height and stage 6 for the face; in boys, it tends to occur at stage 6 for height and stage 7 for the face. For the cervical vertebrae, the modal event is the midpoint between CS 3 and CS 4. As a baseline for comparison, assessments based on mean ages taken from the literature also were tested: onset, 10 years for girls and 12 years for boys; peak, 12 years for girls and 14 years for boys.
In each of the 100 series, the age at which these key events occurred was estimated by interpolation and compared with the actual timing of the onset and the peak in stature, facial size, and mandibular length. Because the errors in the various estimates of maturation (estimated minus actual) would tend to sum to zero, the arithmetic mean would be meaningless. Instead, for each event and structure, the errors were squared, summed, and then averaged. The square root of each of these averages— the so-called root mean squared error—expresses error in years (rather than years squared) and thus is a sort of error standard deviation.
Indexes of maturation are also used to predict the timing of the adolescent acceleration. Three separate predictions of the peak age were generated from the vertebral method: age at CS 2 plus 1, 1.5, and 2.0 years. Stature was used to predict the peak by using the age at onset plus 2 years. In addition, predictions of onset and peak were generated based on mean chronologic age from other studies (girls, 10 and 12 years; boys, 12 and 14 years). The linear correlation between predicted and actual was calculated, and root mean squared errors (error standard deviations) were generated as estimates of the accuracy of each method. As with the assessment of maturation, facial and mandibular cephalometric data were taken to be the gold standards for the validation of the various methods of prediction.
Statistical analysis
Descriptive statistics were calculated with a commercial spreadsheet program (Microsoft Excel). Means, standard deviations, ranges, and confidence intervals were calculated for chronologic age at onset and peak for facial size, mandibular length, and height. Differences between means within the sexes were analyzed at both onset and peak by paired t tests (SPSS). For the hand-wrist and vertebral stages, modes were calculated to identify the stage that occurred most frequently at the peak of the statural, facial, and mandibular curves. The root mean squared errors for the various methods were ranked within sexes and structures, and the rankings were then tested with the Friedman blocked nonparametric analysis of variance.
Results
Descriptive statistics for the timing of the onset and the peak of the pubertal growth spurt are summarized in Table I . The average growth curves for stature, facial size, and mandibular length are depicted in Figures 2 through 7 . Between sexes and among the 3 measures of size, the curves display a similar shape, with onset and peak clearly discernible on each curve. Girls seem to show a preadolescent spurt that closely precedes the pubertal growth spurt, whereas boys show a relatively constant growth rate up to the onset of the spurt. In boys, the average peak yearly increments in height and mandibular length were 95.35 and 4.79 mm, respectively. The average peak increments for girls were 82.70 mm for height and 3.88 mm for mandibular length.
| Structure | Event | Statistics (y) | |||
|---|---|---|---|---|---|
| Mean | SD | Range | 95% CI | ||
| Boys | |||||
| Height | Onset | 11.93 | 0.98 | 9.5-13.5 | 11.64-12.21 |
| Peak | 13.99 | 1.03 | 12.5-17.5 | 13.7-14.29 | |
| Facial composite | Onset | 11.95 | 1.08 | 10.25-15.5 | 11.64-12.26 |
| Peak | 14.35 | 1.14 | 11.75-17.5 | 14.02-14.68 | |
| Mandibular length | Onset | 11.86 | 1.27 | 10.25-15.75 | 11.49-12.23 |
| Peak | 14.34 | 1.12 | 12-17.5 | 14.02-14.66 | |
| Girls | |||||
| Height | Onset | 9.29 | 0.98 | 7.5-12.5 | 8.98-9.60 |
| Peak | 10.92 | 0.99 | 9-13.75 | 10.63-11.20 | |
| Facial composite | Onset | 9.77 | 1.19 | 7.5-13.5 | 9.43-10.11 |
| Peak | 11.52 | 1.16 | 9.75-14.75 | 11.18-11.85 | |
| Mandibular length | Onset | 9.54 | 1.12 | 7.5-13.5 | 9.21-9.86 |
| Peak | 11.50 | 1.24 | 9.5-15 | 11.14-11.85 | |
The hand-wrist and cervical vertebral stages at onset and peak of the growth spurt are summarized in Table II . Although certain stages tend to be related to onset and peak, there is a wide range, and the modal percentages are quite low. Paired t tests show that, in boys, the peak occurred significantly earlier for stature than for facial size and mandibular length ( Table III ), whereas in girls, both onset and peak for height occurred significantly earlier than these events in the face and mandible.
| Maturation stage | Structure | HW | CS | ||
|---|---|---|---|---|---|
| Modal stage (%) | Range | Modal stage (%) | Range | ||
| Boys | |||||
| Onset | Height | 1 (30) | 1-7 | 1 (54) | 1-5 |
| Facial composite | 2 (31) | 1-7 | 1 (60) | 1-4 | |
| Mandibular length | 2 (35) | 1-7 | 1 (60) | 1-4 | |
| Peak | Height | 7 (42) | 4-10 | 4 (47) | 1-6 |
| Facial composite | 7 (36) | 3-10 | 4 (34) | 1-6 | |
| Mandibular length | 7 (46) | 5-10 | 4 (38) | 1-6 | |
| Girls | |||||
| Onset | Height | 1 (32) | 1-6 | 1 (64) | 1-4 |
| Facial composite | 3 (19) | 1-8 | 1 (54) | 1-4 | |
| Mandible | 2 (21) | 1-7 | 1 (64) | 1-4 | |
| Peak | Height | 7 (30) | 3-8 | 2 (28) | 1-5 |
| Facial composite | 7 (36) | 3-10 | 4 (24) | 1-5 | |
| Mandible | 7 (28) | 3-10 | 4 (30) | 1-6 | |
As indexes of maturation, errors attendant to the use of averages from the literature (10 years for girls; 12 years for boys) to identify the probable occurrence of onset are given in Table IV . For peak growth, linear correlation (between assessed and actual) and errors (root mean squared error for assessed minus actual) for the average ages (12 years for girls; 14 years for boys), hand-wrist stages (Fishman stages 6 and 7 for boys, and 5 and 6 for girls), and the cervical vertebrae (CS 3.5) are summarized in Table V . Among the 3 methods of assessment, ages estimated from Fishman’s hand-wrist method show the best correlation and smallest root mean squared error. Mean ages are the next best, and stage CS 3.5 is the worst. Based on the 1-2-3 rankings for the 3 dimensions in the sexes, the differences are significant (χ 2 = 10.3; P <0.01).
Stay updated, free dental videos. Join our Telegram channel
VIDEdental - Online dental courses


