Introduction
The objective of this study was to characterize the volume and the morphology of the pharyngeal airway in adolescent subjects, relating them to their facial skeletal pattern.
Methods
Fifty-four subjects who had cone-beam computed tomography were divided into 3 groups—skeletal Class I, Class II, and Class III—according to their ANB angles. The volumes of the upper pharyngeal portion and nasopharynx, and the volume and morphology of the lower pharyngeal portion and its subdivisions (velopharynx, oropharynx, and hypopharynx) were assessed with software (version 11.5; Dolphin Imaging & Management Solutions, Chatsworth, Calif). The results were compared with the Kruskal-Wallis and the Dunn multiple comparison tests to identify intergroup differences. Correlations between variables assessed were tested by the Spearman correlation coefficient. Correlations between the logarithms of airway volumes and the ANB angle values were tested as continuous variables with linear regression, considering the sexes as subgroups.
Results
The minimum areas in the Class II group (112.9 ± 42.9, 126.9 ± 45.9, and 142.1 ± 83.5 mm 2 ) were significantly smaller than in Class III group (186.62 ± 83.2, 234.5 ± 104.9, and 231.1 ± 111.4 mm 2 ) for the lower pharyngeal portion, the velopharynx, and the oropharynx, respectively, and significantly smaller than the Class I group for the velopharynx (201.8 ± 94.7 mm 2 ). The Class II group had a statistically significant different morphology than did the Class I and Class III groups in the velopharynx. There was a tendency to decreased airway volume with increased ANB angle in the lower pharyngeal portion, velopharynx, and oropharynx. In the upper pharyngeal portion, nasopharynx, and hypopharynx, there seemed to be no association between the airway volume and the skeletal pattern.
Conclusions
The Class II subjects had smaller minimum and mean areas (lower pharyngeal portion, velopharynx, and oropharynx) than did the Class III group and significantly less uniform velopharynx morphology than did the Class I and Class III groups. A negative correlation was observed between the ANB value and airway volume in the lower pharyngeal portion and the velopharynx (both sexes) and in the oropharynx (just in male subjects).
The upper airway is a structure responsible for one of the main vital functions in the human organism—breathing. The interest in studying the upper airway has always been present in orthodontics, and 1 main objective is to clarify the relationship between pharynx structures and craniofacial complex growth and development.
Obstructive processes of morphologic, physiologic, or pathologic nature, such as hypertrophy of adenoids and tonsils, chronic and allergic rhinitis, irritant environmental factors, infections, congenital nasal deformities, nasal traumas, polyps, and tumors, are predisposing factors to a blocked upper airway. When that happens, a functional imbalance results in an oral breathing pattern that can alter facial morphology and dental arch forms, generating a malocclusion.
Considering the functional matrix theory proposed by Moss, the association of respiratory and masticatory functions and swallowing might act on craniofacial development.
The literature is controversial when it comes to the possible associations among respiratory function, facial morphology, and occlusion. The ways in which variation in the airflow can influence growth and development are not completely elucidated. These questions remain unanswered because of methodologic limitations related to, among other factors, the multifactorial etiology of malocclusion, the limitations in the cephalometric method, and the lack of longitudinal studies assessing the airway.
Many studies have assessed the relationship between craniofacial morphology and the pharyngeal airway in cephalometric radiographs. However, lateral teleradiographs are limited because they reproduce a 3-dimensional structure in a 2-dimensional way that does not allow the assessment of cross-sectional areas and volumes of these structures.
Techniques that allow the precise diagnosis of changes in the upper airway considering their morphology and volume are fundamental to ensure normal development of the craniofacial complex in growing subjects and the choice of an adequate treatment plan.
Although it might expose patients to higher levels of radiation than isolated customary orthodontic digital radiography, cone-beam computed tomography (CBCT) uses a significantly reduced radiation dose compared with medical computed tomography machines and is equivalent to traditional dental imaging methods such as a full-mouth series. CBCT has the advantage of resulting images with good accuracy. Specific softwares and their tools make it possible to obtain highly reliable measurements of osseous structures and facial characteristics, as well as to assess soft tissues in 3 dimensions, including measurements of the oropharynx for volume, morphology, and minimum axial area. Many studies have been developed in this area.
Guijarro-Martínez and Swennen published a systematic review concerning the CBCT analysis of the upper airway and included 46 clinically or technically relevant articles from 382 articles from 1968 to 2010 found in PubMed (National Library of Medicine, NCBI). The results indicate that the 3-dimensional analysis of the upper airway by using CBCT can be accurate and reliable, although important aspects still need to be elucidated.
The aim of this study was to characterize through CBCT and 3-dimensional image reconstruction software the volumes of the upper pharyngeal portion and nasopharynx, and the volume, minimum axial area, and morphology of the lower pharyngeal portion and its subdivisions—velopharynx, oropharynx, and hypopharynx—in adolescent subjects, relating them to their facial skeletal patterns.
Material and methods
This project was approved by the research ethics committee of the Institute of Collective Health Studies from the Universidade Federal do Rio de Janeiro in Brazil. All patients signed a consent form allowing the use of their orthodontic records.
A sample calculation was performed based on the mean standard deviation from a previous study. A sample size of at least 17 patients would be necessary in each group to detect differences of 65 mm 2 in the minimum axial area and of 2500 mm 3 in the oropharynx volume, with a test power of 0.80 (α = 0.05). The formula used was described by Pandis.
The sample was composed of 54 CBCT scans, requested as part of the initial records needed for diagnosis and planning of patients starting their orthodontic treatment in the orthodontic clinics of the postgraduate program in our school of dentistry. All CBCT scans used so far as orthodontic records in this university were performed on 1 device (i-CAT; Imaging Sciences International, Hatfield, Pa) according to a standard protocol (120 kV, 5 mA, 13 × 17-cm field of view, 0.4-mm voxel, and 20-second scanning time). The CBCT scans were made with each subject sitting in a vertical position, and with the Frankfort horizontal plane parallel to the ground and in maximum intercuspation.
The CBCT scans of patients in the sample were selected from the sequential initial records from the clinics. The following inclusion criteria were used in sample selection: DICOM file, no previous orthodontic treatment or other treatment that might interfere with the natural course of maxillomandibular growth and development, good health conditions, no airway pathology, cranio-cervical inclination between 90° and 110° (since head posture might interfere with airway volume), CBCT image including the whole fourth cervical vertebra, no severe hyperdivergence (FMA angle, 19°-30°), and age from 13 to 20 years. The inclination between the palatal plane and the sella-nasion plane was measured to characterize the sample. To take the initial angular measurements necessary to confirm the inclusion criteria and distribute the subjects among the groups (ANB and FMA angles, and cranio-cervical inclination), 2-dimensional lateral cephalometric radiographs were created (ray-sum technique) from the CBCT scans in the software (version 11.5; Dolphin Imaging & Management Solutions, Chatsworth, Calif), and measurements were made by an experienced operator (L.V.C.). The subjects were then divided into 3 groups considering the relationship between the maxilla and the mandible (ANB angle): Class I (1° ≤ANB ≤3°), Class II (ANB >3°), and Class III (ANB <1°). Fewer Class I and Class III subjects met all inclusion criteria than Class II patients. To maintain the sample size calculated and make the groups more even, random subjects were excluded from the Class II group using initials and sex. No numeric parameters were considered.
The groups were divided in the following way: Class I (17 patients, 12 female and 5 male), Class II (20 patients, 10 female and 10 male), and Class III (17 patients, 11 female and 6 male). The mean age of the sample was 16.28 years (SD, 2.30 years) and the mean FMA angle was 24.82° (SD, 3.45°). The mean inclination between the palatal plane and the sella-nasion plane was 8.40° (SD, 3.60°). Specific age and cephalometric characteristics for each group are described in Table I .
| Class I (n = 17) Mean (SD) |
Class II (n = 20) Mean (SD) |
Class III (n = 17) Mean (SD) |
|
|---|---|---|---|
| Age (y) | 15.62 (2.17) | 16.83 (2.74) | 16.28 (1.74) |
| FMA (°) | 24.51 (2.37) | 25.73 (4.07) | 24.05 (3.52) |
| ANB (°) | 2.18 (0.76) | 5.55 (2.00) | −2.05 (2.52) |
| PP-SN (°) | 6.64 (3.89) a | 8.7 (3.21) a | 9.83 (3.18) a |
The direct measurements selected for the dimensional assessment of the pharyngeal airway in this study were (1) upper pharyngeal portion, nasopharynx, lower pharyngeal portion, velopharynx, oropharynx, and hypopharynx volume; (2) lower pharyngeal portion, velopharynx, oropharynx, and hypopharynx minimum axial area; (3) lower pharyngeal portion total length and upper length; and (4) velopharynx, oropharynx, and hypopharynx total length.
All measurements were made with Dolphin Imaging software. The volumes and minimum axial areas were measured with the tool for airway volume calculation in the 3-dimensional mode of the software in the 25 (standard) threshold values. The limits for each portion of interest were defined in the sagittal slice, and the software automatically calculated the total volume and the most constricted airway area (minimum axial area) in the region previously set out.
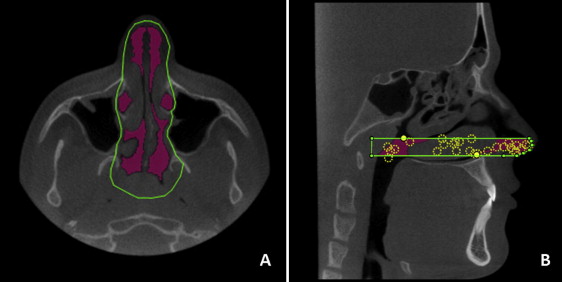
The limits adopted for the upper pharyngeal portion were those proposed by El and Palomo. The lower limit was defined by the palatal plane, which is the line passing by the anterior nasal spine and posterior nasal spine, extended to the pharyngeal posterior wall. The upper limit was defined as a slice before the nasal septum merges with the pharyngeal posterior wall ( Fig 1 ).
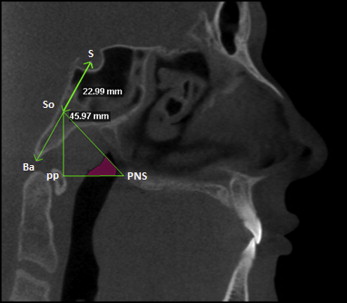
The lower limit of the nasopharynx segment was the palatal plane; its upper limit was defined in the sagittal view as the line uniting the posterior nasal spine and the So (middle point of the sella-basion line) points, and its posterior limit was defined in the sagittal view as a line approximately perpendicular to the palatal plane that intersects the So point ( Fig 2 ).
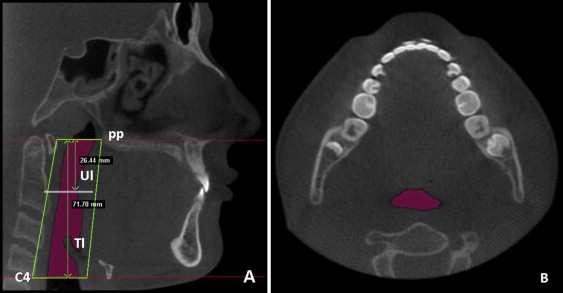
The lower pharyngeal portion’s upper limit was the palatal plane extended to the posterior pharyngeal wall, and the lower limit was the plane parallel to the palatal plane that intersected the lower and most anterior point in the fourth cervical vertebra ( Fig 3 ). The location of the minimum axial area in the lower pharyngeal portion was determined using the ratio proposed by Van Holsbeke et al between the upper airway length (distance from the upper limit to the minimum axial area) and the total airway length ( Fig 3 ). The position ratio can be described as follows: location = upper airway length/total airway length.
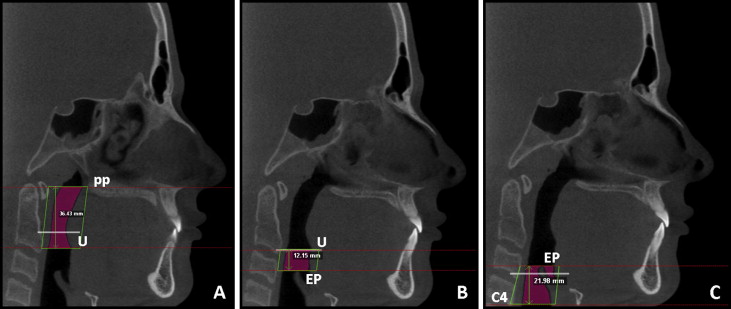
The 3 segments assessed in the lower pharyngeal portion—velopharynx, oropharynx, and hypopharynx—were delimited by 4 cross-sectional planes, constructed with previously determined points. The upper limit of the velopharynx was the palatal plane, and the lower limit was a plane parallel to the palatal plane that intersected the uvula ( Fig 4 , A ). The upper limit of the oropharynx segment was the lower limit of velopharynx, and its lower limit was a plane parallel to the palatal plane intersecting the upper point of the epiglottis ( Fig 4 , B ). The upper limit of the hypopharynx was the lower limit of the oropharynx, and its lower limit was a plane parallel to the palatal plane intersecting the lower and most anterior point of the fourth cervical vertebra ( Fig 4 , C ).
Once volume, minimum axial area, and total length of the lower pharyngeal portion, velopharynx, oropharynx, and hypopharynx were obtained, the mean area of each segment was calculated using the following ratio: mean area = volume/total airway length.
The morphologic characterizations of the lower pharyngeal portion, velopharynx, oropharynx, and hypopharynx were possible by calculation of the following ratio for each segment: morphology = minimum area/mean area. This ratio shows whether the area distribution along the upper airway was uniform or irregular.
Statistical analysis
All measurements were repeated in 40% of the CBCT scans after a 2-week interval. Calibration of the operator was tested with the intraclass correlation coefficient.
A descriptive analysis, including means and standard deviations, was performed for all quantitative variables. The Kolmogorov-Smirnov test was applied to assess the normality of the data. No significant sex-related differences were found; therefore, the data were combined. The Kruskal-Wallis test was used to verify whether there were statistically significant differences ( P <0.05) among the groups. The Dunn multiple comparison test was then used to identify where these differences were. Correlations among the variables were tested by the Spearman correlation coefficient. The P values were adjusted for multiple comparisons. Correlations between the logarithms of airway volumes and the ANB angle values were tested as continuous variables using linear regression, with the sexes as subgroups.
Results
The intraclass correlation coefficient results were higher than 0.95 for all variables assessed; this confirmed the operator’s calibration.
The Kruskal-Wallis nonparametric test was applied for all variables, since the distribution of some variables was not normal. Comparisons among mean values of all groups for all dimensional variables (except for volumes) assessed for each airway segment are given in Tables II through V .
| Class I (n = 17) Mean (SD) |
Class II (n = 20) Mean (SD) |
Class III (n = 17) Mean (SD) |
|
|---|---|---|---|
| LPP total length (mm) | 66.7 (7.0) a | 67.0 (7.8) a | 70.22 (5.4) a |
| LPP upper length (mm) | 50.8 (14.5) a | 31.30 (15.2) b | 46.81 (17.65) a,b |
| LPP minimum area (mm 2 ) | 132.45 (48.5) a,b | 112.9 (42.9) a | 186.62 (83.2) b |
| LPP mean area (mm 2 ) | 205.38 (68.7) a,b | 211.8 (52.9) a | 299.93 (93.16) b |
| Minimum area location (Ul/Tl) | 0.7 (0.2) a | 0.5 (0.2) b | 0.6 (0.3) a,b |
| LPP morphology (Amin/Amean) | 0.5 (0.1) a | 0.5 (0.1) a | 0.6 (0.1) a |
| Class I (n = 17) Mean (SD) |
Class II (n = 20) Mean (SD) |
Class III (n = 17) Mean (SD) |
|
|---|---|---|---|
| VP length (mm) | 29.5 (4.9) a | 28.7 (4.1) a | 31.5 (3.7) a |
| VP minimum area (mm 2 ) | 201.8 (94.7) a | 126.9 (45.9) b | 234.5 (104.9) a |
| VP mean area (mm 2 ) | 291.0 (93.6) a | 218.8 (87.8) b | 327.9 (112.0) a |
| VP morphology (Amin/Amean) | 0.7 (0.1) a | 0.6 (0.1) b | 0.7 (0.2) a |
| Class I (n = 17) Mean (SD) |
Class II (n = 20) Mean (SD) |
Class III (n = 17) Mean (SD) |
|
|---|---|---|---|
| OP length (mm) | 18.56 (3.9) a | 14.73 (5.4) a | 16.0 (5.8) a |
| OP minimum area (mm 2 ) | 160.2 (62.6) a,b | 142.1 (83.5) a | 231.1 (111.4) b |
| OP mean area (mm 2 ) | 210.9 (86.9) a,b | 195.1 (85.3) a | 283.4 (124.1) b |
| OP morphology (Amin/Amean) | 0.76 (0.1) a | 0.7 (0.1) a | 0.8 (0.1) a |
| Class I (n = 17) Mean (SD) |
Class II (n = 20) Mean (SD) |
Classs III (n = 17) Mean (SD) |
|
|---|---|---|---|
| HP length (mm) | 19.2 (5.4) a | 21.8 (5.1) a | 22.3 (5.2) a |
| HP minimum area (mm 2 ) | 147.4 (51.9) a | 149.6 (53.0) a | 206.5 (93.0) a |
| HP mean area (mm 2 ) | 224.1 (59.2) a | 235.4 (69.9) a | 283.9 (80.7) a |
| HP morphology (Amin/Amean) | 0.6 (0.1) a | 0.6 (0.1) a | 0.7 (0.1) a |
Stay updated, free dental videos. Join our Telegram channel
VIDEdental - Online dental courses


