Introduction
The purpose of this study was to evaluate the dynamic changes in the periodontal microstructure and the molar displacement pattern during orthodontic tooth movement in ovariectomized rats.
Methods
Twenty ovariectomized rats received either 100 or 30 g of orthodontic force to induce mesial movement of the maxillary left first molars over 14 days. Ten healthy rats underwent sham operations as controls. Periodontal ligament thickness, alveolar bone microstructural properties, and displacement of the molar were measured with 6 in-vivo microcomputed tomography scans for each sample.
Results
The ovariectomized rats that received 100 g of orthodontic force had obvious changes in periodontal ligament thickness at day 1 and poor periodontal ligament thickness recovery from days 5 through 14. The bone volume fraction increased and the trabecular separation decreased significantly in this group at day 3, and obvious bone loss was observed at day 14. Molar linear and angular movements were also higher in this group than in the other 2 groups.
Conclusions
Relatively heavier force applications in ovariectomized rats resulted in poor periodontal ligament thickness recovery and local alveolar bone overcompression, and consequently induced undermining resorption and obvious alveolar bone loss; these led to high rates of tooth movement and molar inclination.
Orthodontic tooth movement is the result of bone remodeling and is susceptible to systemic hormones and local factors. Studies have indicated that estrogen deficiency disrupts the balance between bone resorption and bone formation, leading to obvious bone loss. During orthodontic treatment of perimenopausal patients, bone formation cannot keep pace with resorption; this results in cancellous bone loss, widening of the periodontal ligament space, and loose teeth. Studies focusing on the relationship between systemic osteoporosis and orthodontic treatment indicated that the high rates of tooth movement seen in osteoporotic patients were the result of increased bone turnover after ovariectomy.
The orthodontic tooth movement pattern is closely related to the periodontal microstructural properties. Previous studies have examined the relationship between periodontal tissues and tooth movement mainly with histopathologic method or transmission electron microscopy. However, 3-dimensional reconstruction and in-vivo observation would provide great help in this field. Microcomputed tomography was initially used to examine in-vitro samples and later refined to allow in-vivo observations in small laboratory animals. With microcomputed tomography, it is possible to evaluate dynamic changes in periodontal ligament thickness and alveolar bone remodeling.
Orthodontic tooth movement performed on the rats’ maxillary first molars is a reliable and reproducible method. However, in-vivo periodontal tissue changes during orthodontic tooth movement have not been fully understood in ovariectomized rats. The aim of this study was to analyze the relationship between the microstructural changes in the periodontal tissues and the tooth movement pattern in ovariectomized rats using in-vivo microcomputed tomography over a 14-day period. To observe the effects of the different force magnitudes, forces of 30 and 100 g were applied.
Material and methods
Thirty 8-week-old female Sprague Dawley rats (weight, 232-254 g) were obtained from the animal center of the Fourth Military Medical University in China. The rats were individually housed under standard conditions: room temperature at 25°C ± 2°C; humidity at 55% ± 5%, standardized laboratory rat diet, free access to water, and 12-hour light and dark cycles. After 1 week of adaptation to the environment, 20 rats were randomly selected for ovariectomy, and 10 rats underwent a sham operation as the control group. The sham surgical procedures were the same as those used for ovariectomy, except that the ovaries were left intact. After the surgeries, all rats were kept under standard conditions.
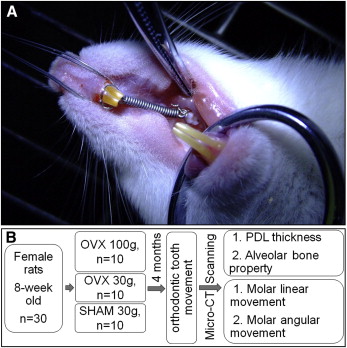
Four months later, the rats were anesthetized by intraperitoneal injection of pentobarbital (60 mg/kg), and we installed the orthodontic appliance as previously described ( Fig 1 , A ). The maxillary left first molar was connected with both maxillary central incisors with nickel-titanium closed-coil springs (3M Unitek, Monrovia, Calif) to perform the mesial movement. Previous studies have noted that different force magnitudes led to quite different amounts of tooth movement and root resorption. Thus, forces of both 30 and 100 g were applied to observe the reactions of the periodontal tissues and the tooth movements. The maxillary right first molars received no orthodontic force and served as the negative controls. The ovariectomized rats were randomly divided into 30-g and 100 g-groups. The control group received 30 g of force ( Fig 1 , B ). All experimental procedures were approved by the Fourth Military Medical University’s intramural animal use and care committee and performed strictly according to its guidelines.
Microcomputed tomography (Siemens, Munich, Germany) was used to observe the periodontal microstructure and tooth movement. The settings were 80 kV and 500 μA, with a resolution of 10-μm and a scan angle of 360°. Each scan produced 1024 images in Digital Imaging and Communications in Medicine (DICOM) 3.0 format. To obtain accurate data, the rats were anesthetized to ensure that they remained still during scanning. The rats were placed in a prone position on the sample platform; each rat was aligned with the marker line on the platform to achieve an identical scan position. Microcomputed tomography scans were made at day 0 (right before installment of the orthodontic appliance) and at days 1, 3, 5, 7, and 14. The rats were killed by carbon dioxide inhalation after the experiment.
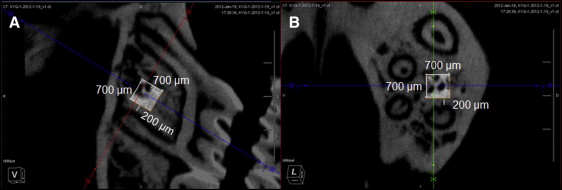
In the maxillary left first molar region, a cubic region of interest (700 × 700 × 700 μm) on the mesial side of the middle third of the distobuccal root was selected for analysis of alveolar bone properties ( Fig 2 ). The distance between the region of interest and the root was 200 μm. The microstructural parameters assessed included bone volume fraction, trabecular number, trabecular thickness, trabecular separation, and structure model index.
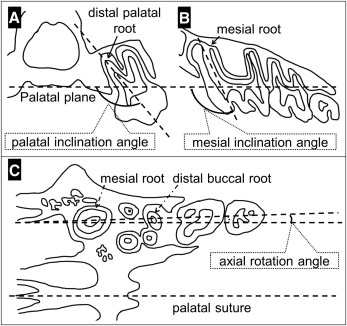
The image reconstruction was carried out using Inveon Research Workplace (Siemens). Periodontal ligament thickness and tooth movement were measured with landmarks identified on the longitudinal section through the center of the distobuccal root perpendicular to the palatal plane and parallel to the palatal suture as described before ( Fig 3 ). The palatal plane was defined as the line tangent to the lower border of the palatal vault and used as the reference plane for linear and angular measurements ( Fig 4 ).
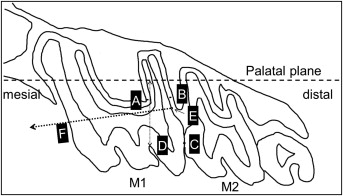
The radiolucent area between the root and the alveolar bone in the sagittal view represented the periodontal ligament thickness. Points A and B at the cervical area of the root were registered to measure the periodontal ligament thickness on the mesial and distal sides of the root ( Fig 3 ).
Molar mesial movement was assessed by measuring the shortest distance between the crowns of the first and second molars, as indicated by point C in Figure 3 . Molar vertical movement was recorded as the distance from the bottom of the first molar’s distal sulcus (point D) to the palatal plane ( Fig 3 ).
The mesial inclination angle was formed by the intersection of the mesial root axis line and the palatal plane in the sagittal view. The palatal inclination angle was formed by the intersection of the distal palatal root axis line and the palatal plane in the coronal view. The axial rotation angle was formed by the intersection of the palatal suture and a line running through the midpoints of the mesial and distobuccal roots in the axial view ( Fig 4 ).
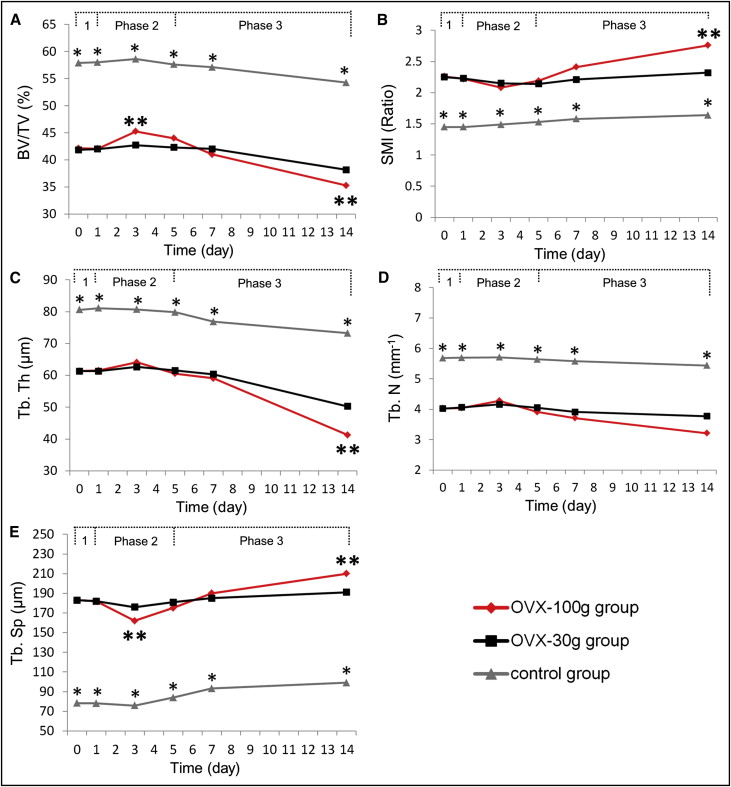
Based on the changes in periodontal ligament thickness and molar movement pattern, the experiment was divided into 3 phases: phase 1 (days 0-1), phase 2 (days 2-5), and phase 3 (days 6-14).
All measurements were performed by the same researcher (Y.X.) and repeated 3 times, with 2 weeks between each assessment. The mean value was calculated and used as the final value. To assess measurement reproducibility, 4 measurements of periodontal ligament thickness, tooth displacement, tooth inclination, and bone microstructural properties were selected randomly and performed 10 times each. The standard deviation of each measurement was within 1%.
Statistical analysis
Statistical analysis was performed using SPSS software (version 11.0; SPSS, Chicago, Ill). The Mann-Whitney test was used to assess between-group differences. Differences were considered statistically significant at P <0.05.
Results
The maxillary left molars in all 3 groups moved mesially and showed various patterns. In the ovariectomized rats, the alveolar bone microstructure showed special characteristics under 100 g of force. The maxillary right molars (negative controls) had no detectable tooth movement or periodontal tissue change.
The periodontal membranes at point A were compressed under orthodontic force loading ( Fig 5 , B ). In phase 1, the periodontal ligament thickness decreased obviously in all 3 groups, and a significant difference was found between the 100-g and 30-g groups ( P <0.05). The periodontal ligament thickness during the second phase was stable in the 100-g group. In phase 3, the periodontal ligament thickness increased by different degrees in all 3 groups. The periodontal ligament thickness in the 100-g group was lower than that of the 30-g group at days 7 and 14 ( P <0.05).
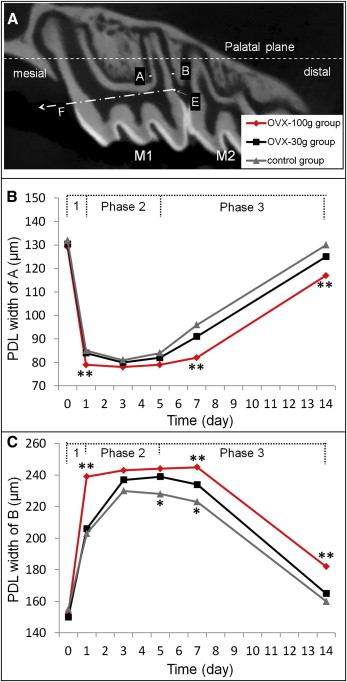
The periodontal membranes were stretched at point B ( Fig 5 , C ). In phase 1, the periodontal ligament thickness of the 100-g group was significantly higher than that of the 30-g group ( P <0.05). The periodontal ligament thickness in the 100-g group increased gradually in phase 2 and decreased to approach the original periodontal ligament thickness in phase 3. A significant difference was found between the 100-g and 30-g groups at days 7 and 14 ( P <0.05). The periodontal ligament thickness of the 30-g group was significantly higher than that of the control group at days 5 and 7 ( P <0.05).
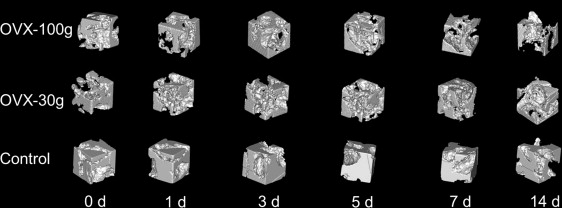
Four months after surgery, the ovariectomized rats showed obvious alveolar bone loss relative to the control group at all 6 time points ( Fig 6 ). In the 100-g group, the alveolar bone was slightly compacted at day 3 and had obviously more bone loss than did the other 2 groups at day 14. The control group had a slight bone loss at day 14.
All 5 parameters of both the 100-g and 30-g groups remained nearly unchanged in phase 1 ( Fig 7 ). In the 100-g group, the bone volume fraction increased to reach its peak at day 3, whereas the trabecular separation decreased to reach its nadir at the same time ( P <0.05; Fig 7 , A and E ). During phase 3, the bone volume fraction and the trabecular thickness of the 100-g group decreased significantly, and the structure model index and the trabecular separation of the same group increased significantly at day 14 ( P <0.05).