2.2.2 Dentin
Dentin differs radically from enamel in that about 30 % of the tissue is made up of organic matrix (Table
2.1), of which about 90 % is the fibrous, insoluble protein collagen. The remainder consists of a variety of proteins and carbohydrates and a small amount of lipid. The mineral crystals are platelike in form rather than ribbon-like as in enamel and are also much smaller and thinner: approximately 30 nm wide, 3 nm thick [
5].
During dentinogenesis, many of the crystals are deposited within the collagen fibres, so are intimately associated with the sub-fibrils, while the remaining crystals are deposited between the fibres. The proportion of crystals within the fibres is between 25 and 80 % [
6].
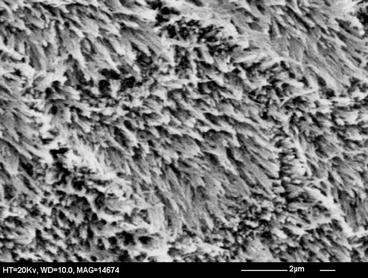
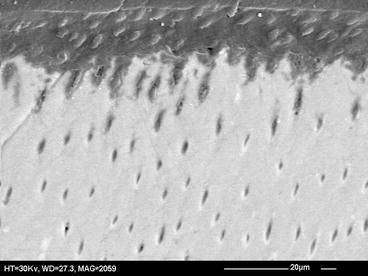
Of the overall porosity (about 21 vol%: Table
2.1), about 6.5 vol% is associated with the tubules, which run from the enamel-dentin junction to the pulp chamber. As these are wider and more closely packed towards the pulp, they occupy a greater proportion of the inner dentin (22 vol%) than of the outer dentin (1 vol%). Within the intertubular dentin, the average porosity is about 15 vol%. The interfibrillar regions are probably less porous than the intertubular regions, because of the close packing of organic and inorganic material. It is unlikely that the pores of dentin show much directionality because the crystals are very small and platelike.
2.3 Chemistry of Dental Mineral
Dental minerals are forms of a sparingly soluble calcium phosphate known as hydroxyapatite, which in its pure form has the formula Ca10(PO4)6(OH)2. An important property of dental mineral is the solubility, which determines whether a given solution will allow dissolution to proceed, and the concept requires a few words of introduction.
When a sparingly soluble solid such as hydroxyapatite is immersed in water, it will begin to dissolve. If there is an excess of solid and a limited volume of water, dissolution will not continue indefinitely but will eventually cease. At this point, the system is in equilibrium and the solution is said to be saturated. Analysis of the saturated solution enables the solubility of the solid to be determined. The fundamental thermodynamic solubility is defined in terms of the chemical activity of the dissolved solid and is a constant for a given temperature. In this chapter, a more practical definition of solubility will be used, namely, the gravimetric solubility, which is the concentration (mass per unit volume) of dissolved solid in solution.
Solutions in which the concentration of dissolved solid is less than in a saturated solution are undersaturated and solutions with a higher concentration are supersaturated. Undersaturated solutions can support dissolution of the solid but not precipitation, while supersaturated solutions support precipitation but not dissolution.
In the dental tissues, the mineral contains a number of impurity ions, which take the place of ions in the hydroxyapatite structure. Thus, Ca
2+ ions can be replaced by Na
+ or Mg
2+ ions;

ions can be replaced by

ions and OH
− ions by

or F
− ions [
5]. In most of these cases, the impurity ion has a different charge or size to the ion it is replacing. This results in misfits in the crystal lattice which disturb the crystal structure and in turn make the mineral chemically less stable: in other words more soluble.
Table
2.2 shows that the major impurities in both dentin and enamel mineral are carbonate, magnesium and sodium. In relation to the calcium and phosphate concentrations (i.e. the total mineral), dentin contains more carbonate and magnesium than enamel and is also much less well crystallised. In Fig.
2.1, the curves represent the equilibrium concentration of relevant solids over a range of pH from neutral to the low values typical of erosive products. The higher the concentration at any particular pH, the greater the solubility. The figure shows that enamel is slightly more soluble than pure hydroxyapatite but dentin is much more soluble. The figure also shows that the gravimetric solubility of these solids increases as the pH of the solution decreases.
Table 2.2
Principal inorganic constituents of dentin and enamel (percent dry weight) [
5]
|
Ca
|
36.6
|
26.9
|
|
P
|
17.7
|
13.2
|
|
CO3
|
3.2
|
4.6
|
|
Na
|
0.7
|
0.6
|
|
Mg
|
0.4
|
0.8
|
|
Cl
|
0.4
|
0.06
|
|
K
|
0.04
|
0.02
|
Figure
2.1 also shows solubility of an additional solid, fluorapatite, which is structurally close to hydroxyapatite but in which all the OH
− ions are replaced by F
−. Because the F
− ion has the same charge as the OH
− ion and is slightly smaller, this substitution (unlike those discussed above) results in a more stable crystal structure and hence reduces solubility. The solubility of fluorapatite depends on the fluoride concentration in solution, so its solubilities are given for a range of fluoride concentrations found in representative erosive products [
7].
2.4 Acids and Demineralisation
The acids responsible for erosion (Table
2.3) may be
intrinsic or
extrinsic in origin. The intrinsic acid is hydrochloric acid, the principal component of gastric juice. This comes into contact with teeth when gastric juice is regurgitated, either as an occasional occurrence or more frequently, as in gastro-oesophageal reflux disorder. Extrinsic acids reach the mouth via two routes. Certain industries, e.g. battery production, are associated with vapours of strong acids such as sulphuric acid, which attack the teeth after inhalation and dissolution in the saliva. Of far greater importance at population level are acidic components of products intended for human consumption: soft drinks, fruit juices, acidic fruits and vegetables, some alcoholic drinks, some vitamin supplements and medications. The acids found in foods may be metabolic products of fruits or vegetables (malic, tartaric, citric acids) or products of bacterial fermentation (acetic, lactic).
Table 2.3
Acids associated with dental erosion
|
Intrinsic acid
|
|
Hydrochloric acid
|
Gastric juice reflux
|
|
Extrinsic acids
|
|
Sulphuric acid, chromic acid
|
Vapours associated with battery production
|
|
Phosphoric acid
|
Cola
|
|
Acetic acid
|
Vinegar, pickles
|
|
Lactic acid
|
Cheese, yoghurt, wine, fermented cabbage (e.g. sauerkraut)
|
|
Malic acid
|
Apples, grapes, wine
|
|
Tartaric acid
|
Grapes, tamarind, wine
|
|
Citric acid
|
Citrus fruits
|
|
Ascorbic acid
|
Vitamin C supplements
|
All of these acids provide hydrogen ions (H
+) which dissolve dental mineral. Taking hydroxyapatite as an example for this process, the reaction is:
Here, the fully dissociated phosphate anion,  , is omitted because its concentration is exceedingly low. The proportions of the other forms of phosphate (x, y, z) depend on pH. The reaction for dental mineral is similar but also involves the conversion of carbonate ions to carbon dioxide and water:
Hydrochloric and sulphuric acids are strong acids: i.e. at all pH values they are fully dissociated into H+ ions and Cl− or  ions. The remaining acids in Table 2.3 are weak acids. At low pH, they consist almost entirely of undissociated acid. As the pH increases, the acids dissociate progressively. Each molecule of acid may provide one H+ (acetic, lactic), two H+ (malic, tartaric) or three H+ (citric, phosphoric). The dissociation reactions for tartaric acid are:
The pH values at which dissociation occurs is determined by the acid dissociation constant(s), Ka, which are given after the above equations as the negative logarithms (pKa). The dissociation process is illustrated graphically in Fig. 2.2. Weak acids, because they dissociate progressively, act as buffers, so can resist changes in pH. When pH equals a pKa, the buffering strength is at a maximum. It is considered that there is effective buffering over the pH range pKa ± 1. Polybasic acids can therefore buffer over a wide pH range: for instance, citric acid, with pKa of 3.13, 4.74 and 6.42, is a good buffer over the pH range 2.1–7.4.
The strength of buffering is related to the total concentration of acid, and it can be quantified in different ways, using different techniques of titration with a base such as sodium hydroxide. The buffer capacity measures the strength of buffering at the pH of the solution. The titratable acidity measures the amount of buffering between the pH of the solution and some defined higher pH, usually 5.5 or 7.0. The titratable acidity to pH 5.5 is preferable, mainly because the pH region between 5.5 and 7.0 is of little or no interest to erosion.
A possibly important property of weak acids which form anions with more than one negative charge is that they are capable of forming
ionic complexes with cations such as Ca
2+. Complexes are stabilised by formation of chemical bonds rather than by simple electrostatic attraction. One type of complex is formed by
chelation, in which formation of coordinate bonds between two or more negative anionic groups and the Ca
2+ ion results in a ring structure (see Fig.
2.3 for an example). Chelation will remove calcium ions from solution and reduce their concentration, but they could also speed up the process of mineral solution more directly. Chelating anions can bind to Ca
2+ ions at the surface of the solid, thus weakening bonds holding the Ca
2+ in place and causing them to be solubilised [
6,
8].
The possible roles of buffering and chelation in erosion will be discussed later.