Introduction
Our objective was to investigate surface strain around orthodontic miniscrews under different orthodontic loading conditions in simulated supporting bone.
Methods
Thirty miniscrews with lengths of 6, 8, and 10 mm were embedded into customized composite analog bone models. All miniscrews were inserted into the simulated test bone 6 mm deep and loaded with the same force of 200 cN, creating different tipping moments at the peri-implant bone surface. A digital image correlation technique was used to measure the resulting surface strain around the orthodontic miniscrews.
Results
Changing the tipping moments is directly related to the strain generated at the bone surface close to the miniscrews, with greater moments creating greater maximum principal strains.
Conclusions
Within the limitations of this model, it can be stated that greater tipping moments of miniscrews create greater maximum principal strain values, which have the potential to increase bone turnover around the implant. Hence, miniscrews farther from the bone surface should be loaded with less force, whereas miniscrews loaded closer to the bone surface may sustain higher forces.
Highlights
- •
This is the first study to use digital image correlation method for orthodontic miniscrews.
- •
This allows actual measurement of surface strain vs simulation or computation.
- •
Greater implant head-to-bone distance was associated with greater tipping moments.
- •
Greater tipping moments increase maximum principal strain on bone, triggering resorption.
- •
Greater mini-implant protrusion from bone requires less force to be applied clinically.
Unless there is peri-implantitis, a negatively imbalanced biomechanical environment in the adjacent bone tissue is the main assumption for miniscrew failure. Therefore, understanding how functional loads are transferred to the bone-miniscrew interface will help to determine the best prognosis of stability for orthodontic anchorage. Although miniscrews can be loaded immediately without impairing stability and reducing success rates, Büchter et al showed that increased miniscrew failures under immediate loading appear to be directly related to the tipping moment at the bone rim.
More recently, an interest in bone biomechanics has developed by authors who found that bone failure by fracture was driven by deformation and strain-based conditions, which can predict fracture sites. The influence of strain distribution on the success of dental implants is undisputed and has been known for decades; however, less is known about specific thresholds of strain parameters related to the success of miniscrews. A recent subject-specific finite element analysis (FEA) study of miniscrews demonstrated that the maximum principal strain is the most reliable parameter for predicting miniscrew failure. Because FEA modeling depends on many assumptions and represents a simplification of actual conditions, it has the shortcoming of being a simulation of clinical parameters with inherent inaccuracies. To date, no authors have actually measured strain distributions around orthodontic miniscrews at different loads.
Digital image correlation is an optical full field for noncontact, 3-dimensional (3D) deformation measurement that has been developed to measure displacement and surface strain distribution in materials testing. It is particularly suitable for biologic applications because it can be used accurately to determine strain in inhomogeneous, anisotropic, nonlinear materials such as bone. Several studies have used the digital image correlation method to analyze the biomechanics of an implant-supported prosthesis. Digital image correlation can simultaneously measure 3D displacements in a high dynamic range (nanometers to millimeters) and has low intrasample variations of the surface strain while reconstructing the surface accurately.
Therefore, the purpose of this in-vitro study was to analyze strains generated by miniscrews under continuously applied orthodontic loads in simulated supporting bone by creating different tipping moments, mimicking various clinical situations.
Material and methods
Thirty self-drilling miniscrews (Tomas SD; Dentaurum, Ispringen, Germany) with lengths of 6, 8, and 10 mm and a diameter of 1.6 mm were used in this study. Half of the miniscrews were assigned to strain testing on the compression side, and the other half were assigned to strain testing on the noncompression side ( Table I ).
| Load type | ||
|---|---|---|
| Compression | Tension | |
| Miniscrews (n = 30) | 15 | 15 |
| 200 cN, 3-mm lever arm (600 cN∙mm) | 5 | 5 |
| 200 cN, 5-mm lever arm (1000 cN∙mm) | 5 | 5 |
| 200 cN, 7-mm lever arm (1400 cN∙mm) | 5 | 5 |
For the simulated bone blocks, customized composite analog bone models (Sawbones; Pacific Research Laboratories, Vashon Island, Wash) were used to simulate the cortical and cancellous bone. The models were milled to 11.5 × 40 × 20 mm (height, length, and depth, respectively). Young’s modulus values of cortical plate and cancellous bone were 16.7 and 68.4 MPa, respectively.
Digital image correlation analysis comprises 4 consecutive steps: (1) specimen preparation, (2) calibration of the imaging system for a defined field of view, (3) collection of specimen deformation before and after loading, and (4) postprocessing of images to determine displacement or strain.
A specimen is prepared before testing by coating the surface of the composite analog bone model using a high-quality airbrush (Evolution Solo airbrush with a Euro-Tech 10A compressor; Harder & Steenbeck, Oststeinbek, Germany) with airbrush paint (8549 titanium white, high-flow acrylic; Golden Artist Colors, New Berlin, NY) as the background color to improve the contrast between the replicate bone model surface and the speckle pattern. The speckle pattern was applied using airbrush paint (8524 carbon black, high-flow acrylic; Golden Artist Colors). A similar method for speckling samples on a microscale was outlined in a previous study.
A charged-coupled device camera (Correlated Solutions, Columbia, SC) calibration was performed to orient the cameras in 3D space. The calibration process is essential for acquiring accurate 3D measurements. The calibration procedure determines the 3D position of each camera relative to the world coordinate system.
Calibration for the camera setup was carried out with a calibration grid plate (3 mm dot spacing; Correlated Solutions). The calibration plate was displaced in increments in all 3 planes, and images of the calibration target were acquired to calibrate the system.
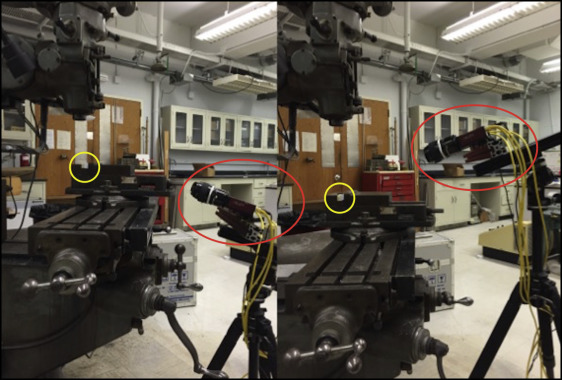
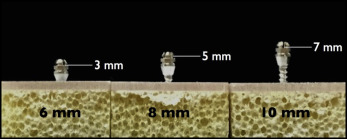
All composite analog bone models were rigidly stabilized, and 3 images were taken on each experimental procedure ( Fig 1 ). Thirty miniscrews (6, 8, and 10 mm in length) were inserted to a 6-mm depth, regardless of their length, into replicated bone models according to the manufacturer’s recommendation ( Fig 2 ). The point of force application was 3 mm from the base of the collar; thus, the distances between the point of force application and bone surface were 3, 5, and 7 mm for the 6-, 8-, and 10-mm miniscrews, respectively. After insertion, each miniscrew was loaded with either a 200-cN push force (Dontrix gauge; Lancer Orthodontics, Vista, Calif) or a 200-cN pull force (200-g load cell). The first image was captured immediately after miniscrew placement, and the second image was taken at least 2 minutes later with the miniscrew under load as described above.
The images were processed using special software (Vic-3D version 7; Correlated Solutions), and the field of view for the area of interest was 10 × 10 mm. Unique correlation areas were defined across the entire imaging area. For each area, the corresponding locations in all other images from the second camera and all loading situations were automatically determined and tracked with subpixel accuracy. The system then used photogrammetric principles to calculate the 3D coordinates of the entire surface in all loading stages to determine displacement or strain.
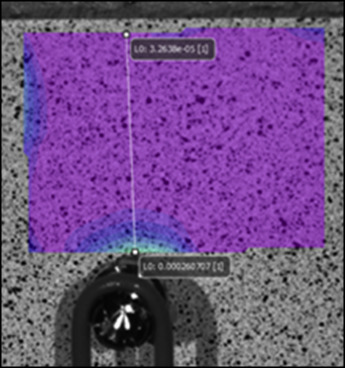
Five measurement points were selected with increasing distances from the miniscrews along the x-line (0.5, 1.0, 1.5, 2.0, and 2.5 mm) ( Fig 3 ).
Statistical analysis
All statistical calculations were performed with SPSS software (version 22; IBM, Armonk, NY). The Shapiro-Wilk test was used to determine frequency distribution, and intraclass correlation was used to determine intrarater reliability. Because the distribution was predominantly nonnormal, the Kruskal-Wallis test with the Mann-Whitney U test for post hoc analysis was used to test for differences in bone surface strain distribution. The level of significance was set at P ≤0.05. Additional post hoc analysis was used to calculate whether the power of the statistical test was effectively performed.
Results
Intrarater reliability was high ( r = 0.92), and the measurements proved to be reproducible. Post hoc analysis in groups with a statistically significant difference ranged from 88% to 100% at 0.5 mm from the orthodontic miniscrews.
Three parameters (maximum principal, minimum principal, and shear strains) were calculated, with mean values and standard deviations shown in Table II .
| Type of force | Strain parameter | Strain values (microstrains) | P value | |||||
|---|---|---|---|---|---|---|---|---|
| 600 cN∙mm | 1000 cN∙mm | 1400 cN∙mm | ||||||
| Mean | SD | Mean | SD | Mean | SD | |||
| Push | e 1 | −320 | 48.82 | −440 | 52.8 | −647 | 123.6 | 0.000 ∗ |
| e 2 | −1358 | 86.0 | −2517 | 547 | −2853 | 123 | 0.013 ∗ | |
| e xy | 128 | 57.61 | 160 | 135.09 | 260 | 169.22 | 0.005 ∗ | |
| Pull | e 1 | 228 | 44.04 | 547 | 70.73 | 953 | 123.59 | 0.000 ∗ |
| e 2 | −18 | 24.86 | 10 | 39.58 | 17 | 11.94 | 0.543 | |
| e xy | 66 | 54.20 | 68 | 35.10 | 142 | 123.30 | 0.216 | |
Stay updated, free dental videos. Join our Telegram channel
VIDEdental - Online dental courses


